Statistik Asas
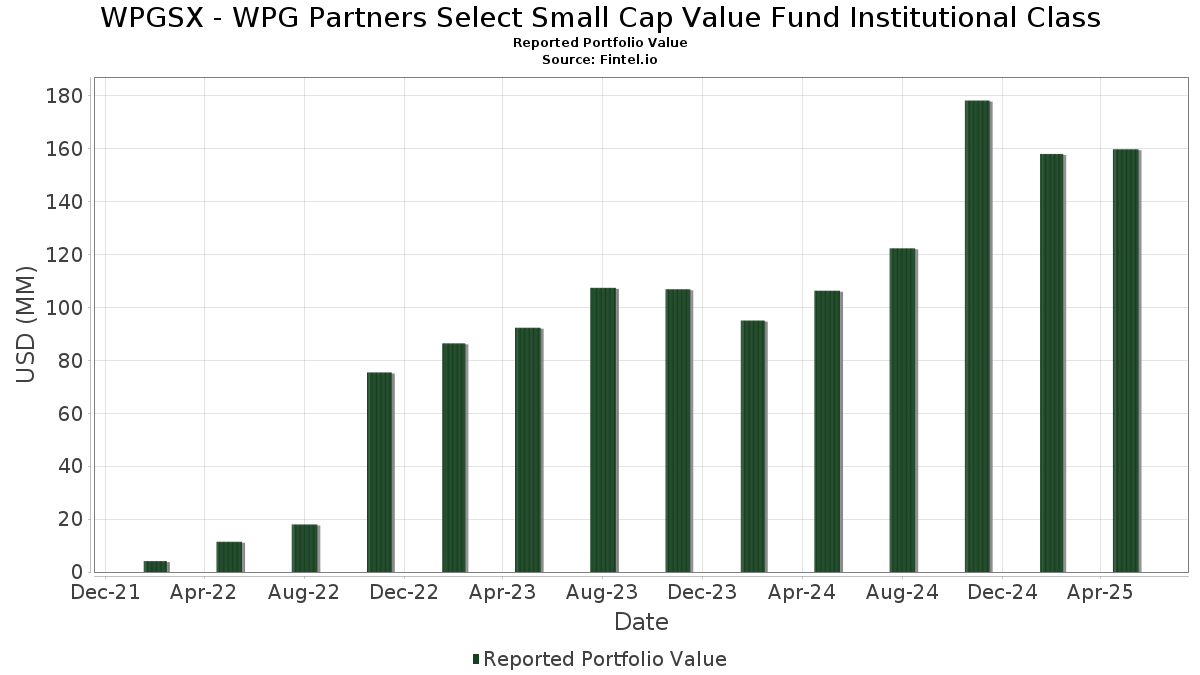
| Nilai Portfolio | $ 159,818,725 |
| Kedudukan Semasa | 50 |
Pegangan Terkini, Prestasi, AUM (dari 13F, 13D)
WPGSX - WPG Partners Select Small Cap Value Fund Institutional Class telah mendedahkan 50 jumlah pegangan dalam pemfailan SEC terkini mereka. Nilai portfolio terkini dikira sebagai $ 159,818,725 USD. Aset Sebenar Di Bawah Pengurusan (AUM) ialah nilai ini ditambah dengan tunai (yang tidak didedahkan). Pegangan teratas WPGSX - WPG Partners Select Small Cap Value Fund Institutional Class ialah Kemper Corporation (US:KMPR) , Silicon Motion Technology Corporation - Depositary Receipt (Common Stock) (US:SIMO) , Tutor Perini Corporation (US:TPC) , Teleflex Incorporated (US:TFX) , and Enovis Corporation (US:ENOV) . Kedudukan baharu WPGSX - WPG Partners Select Small Cap Value Fund Institutional Class termasuk Broadstone Net Lease, Inc. (US:BNL) , Century Aluminum Company (US:CENX) , Huntsman Corporation (US:HUN) , Maximus, Inc. (US:MMS) , and Viper Energy, Inc. (US:VNOM) .
Kenaikan Teratas Suku Tahun Ini
Kami menggunakan perubahan dalam peruntukan portfolio kerana ini adalah metrik yang paling bermakna. Perubahan boleh disebabkan oleh perdagangan atau perubahan dalam harga saham.
| Sekuriti | Saham (MM) |
Nilai (MM$) |
Portfolio % | ΔPortfolio % |
|---|---|---|---|---|
| 10.52 | 6.5867 | 6.5867 | ||
| 0.29 | 4.55 | 2.8469 | 2.8469 | |
| 0.19 | 3.01 | 1.8834 | 1.8834 | |
| 0.47 | 5.21 | 3.2606 | 1.7803 | |
| 0.05 | 6.24 | 3.9059 | 1.7315 | |
| 0.19 | 4.07 | 2.5453 | 1.6899 | |
| 0.20 | 2.21 | 1.3822 | 1.3822 | |
| 0.17 | 3.55 | 2.2244 | 1.3565 | |
| 0.09 | 2.06 | 1.2898 | 1.2898 | |
| 0.03 | 2.02 | 1.2634 | 1.2634 |
Penurunan Teratas Suku Tahun Ini
Kami menggunakan perubahan dalam peruntukan portfolio kerana ini adalah metrik yang paling bermakna. Perubahan boleh disebabkan oleh perdagangan atau perubahan dalam harga saham.
| Sekuriti | Saham (MM) |
Nilai (MM$) |
Portfolio % | ΔPortfolio % |
|---|---|---|---|---|
| 0.06 | 2.86 | 1.7882 | -1.8992 | |
| 0.06 | 2.26 | 1.4172 | -1.6577 | |
| 0.05 | 0.74 | 0.4652 | -1.6488 | |
| 0.05 | 1.77 | 1.1090 | -1.6362 | |
| 0.04 | 1.55 | 0.9726 | -1.4201 | |
| 0.62 | 5.75 | 3.6012 | -1.2699 | |
| 0.20 | 6.15 | 3.8498 | -1.1144 | |
| 1.21 | 1.99 | 1.2452 | -1.0179 | |
| 0.10 | 6.68 | 4.1788 | -0.9563 | |
| 0.79 | 1.23 | 0.7677 | -0.7816 |
13F dan Pemfailan Dana
Borang ini telah difailkan pada 2025-07-29 untuk tempoh pelaporan 2025-05-31. Klik ikon pautan untuk melihat sejarah transaksi penuh.
Tingkatkan untuk membuka data premium dan eksport ke Excel ![]() .
.
| Sekuriti | Jenis | Purata Harga Saham | Saham (MM) |
ΔSaham (%) |
ΔSaham (%) |
Nilai ($MM) |
Portfolio (%) |
ΔPortfolio (%) |
|
|---|---|---|---|---|---|---|---|---|---|
| Tri-State Deposit / STIV (N/A) | 10.52 | 6.5867 | 6.5867 | ||||||
| KMPR / Kemper Corporation | 0.10 | -13.80 | 6.68 | -18.71 | 4.1788 | -0.9563 | |||
| SIMO / Silicon Motion Technology Corporation - Depositary Receipt (Common Stock) | 0.11 | 2.89 | 6.43 | 12.24 | 4.0227 | 0.4425 | |||
| TPC / Tutor Perini Corporation | 0.17 | -10.41 | 6.36 | 12.43 | 3.9809 | 0.4434 | |||
| TFX / Teleflex Incorporated | 0.05 | 94.82 | 6.24 | 79.44 | 3.9059 | 1.7315 | |||
| ENOV / Enovis Corporation | 0.20 | -4.34 | 6.15 | -22.54 | 3.8498 | -1.1144 | |||
| BGC / BGC Group, Inc. | 0.62 | -21.21 | 5.75 | -26.15 | 3.6012 | -1.2699 | |||
| PB / Prosperity Bancshares, Inc. | 0.08 | 23.52 | 5.29 | 12.10 | 3.3122 | 0.3600 | |||
| NCR / NCR Corp. | 0.47 | 123.81 | 5.21 | 120.03 | 3.2606 | 1.7803 | |||
| AL / Air Lease Corporation | 0.09 | 7.69 | 4.92 | 29.47 | 3.0777 | 0.7030 | |||
| BNL / Broadstone Net Lease, Inc. | 0.29 | 4.55 | 2.8469 | 2.8469 | |||||
| VMEO / Vimeo, Inc. | 1.04 | 15.63 | 4.55 | -14.42 | 2.8463 | -0.4758 | |||
| POR / Portland General Electric Company | 0.10 | 20.48 | 4.25 | 13.96 | 2.6582 | 0.3278 | |||
| AOSL / Alpha and Omega Semiconductor Limited | 0.19 | 324.17 | 4.07 | 197.37 | 2.5453 | 1.6899 | |||
| TPH / Tri Pointe Homes, Inc. | 0.13 | 26.31 | 3.73 | 17.61 | 2.3325 | 0.3513 | |||
| CTOS / Custom Truck One Source, Inc. | 0.84 | -13.52 | 3.59 | -16.06 | 2.2478 | -0.4272 | |||
| BKV / BKV Corporation | 0.17 | 140.42 | 3.55 | 156.16 | 2.2244 | 1.3565 | |||
| EYE / National Vision Holdings, Inc. | 0.18 | -33.42 | 3.54 | 3.78 | 2.2174 | 0.0828 | |||
| MYRG / MYR Group Inc. | 0.02 | -8.87 | 3.21 | 16.49 | 2.0083 | 0.2858 | |||
| NMRK / Newmark Group, Inc. | 0.28 | 24.33 | 3.07 | -6.68 | 1.9245 | -0.1358 | |||
| CENX / Century Aluminum Company | 0.19 | 3.01 | 1.8834 | 1.8834 | |||||
| INVA / Innoviva, Inc. | 0.15 | 19.55 | 2.96 | 30.57 | 1.8535 | 0.4353 | |||
| WBS / Webster Financial Corporation | 0.06 | -47.00 | 2.86 | -51.56 | 1.7882 | -1.8992 | |||
| GIL / Gildan Activewear Inc. | 0.06 | 26.41 | 2.85 | 9.00 | 1.7816 | 0.1491 | |||
| MATW / Matthews International Corporation | 0.13 | 75.13 | 2.70 | 50.73 | 1.6911 | 0.5705 | |||
| PAL / Proficient Auto Logistics, Inc. | 0.32 | 14.21 | 2.55 | -11.99 | 1.5953 | -0.2155 | |||
| BRX / Brixmor Property Group Inc. | 0.10 | -24.67 | 2.47 | -31.56 | 1.5468 | -0.7103 | |||
| BV / BrightView Holdings, Inc. | 0.16 | 12.24 | 2.45 | 30.29 | 1.5353 | 0.3583 | |||
| KRO / Kronos Worldwide, Inc. | 0.38 | 12.28 | 2.43 | -18.78 | 1.5223 | -0.3499 | |||
| ERO / Ero Copper Corp. | 0.17 | 39.53 | 2.34 | 66.57 | 1.4662 | 0.5868 | |||
| DENN / Denny's Corporation | 0.60 | 28.29 | 2.28 | -1.39 | 1.4262 | -0.0187 | |||
| NBHC / National Bank Holdings Corporation | 0.06 | -46.67 | 2.26 | -53.98 | 1.4172 | -1.6577 | |||
| HUN / Huntsman Corporation | 0.20 | 2.21 | 1.3822 | 1.3822 | |||||
| TDC / Teradata Corporation | 0.09 | 2.06 | 1.2898 | 1.2898 | |||||
| MMS / Maximus, Inc. | 0.03 | 2.02 | 1.2634 | 1.2634 | |||||
| EGHT / 8x8, Inc. | 1.21 | -16.21 | 1.99 | -45.02 | 1.2452 | -1.0179 | |||
| VNOM / Viper Energy, Inc. | 0.05 | 1.91 | 1.1986 | 1.1986 | |||||
| MOS / The Mosaic Company | 0.05 | 2,154.88 | 1.77 | 1,467.26 | 1.1090 | -1.6362 | |||
| XPRO / Expro Group Holdings N.V. | 0.20 | 1.68 | 1.0497 | 1.0497 | |||||
| TKA / thyssenkrupp AG | 0.17 | -46.65 | 1.67 | -34.05 | 1.0442 | -0.5379 | |||
| CARS / Cars.com Inc. | 0.15 | -5.14 | 1.56 | -26.37 | 0.9776 | -0.3483 | |||
| TSEM / Tower Semiconductor Ltd. | 0.04 | -56.24 | 1.55 | -59.41 | 0.9726 | -1.4201 | |||
| PWP / Perella Weinberg Partners | 0.09 | 12.23 | 1.52 | -15.69 | 0.9490 | -0.1748 | |||
| MTRX / Matrix Service Company | 0.12 | 163.12 | 1.50 | 157.63 | 0.9404 | 0.5757 | |||
| BBWI / Bath & Body Works, Inc. | 0.04 | -19.42 | 1.24 | -37.50 | 0.7768 | -0.4640 | |||
| SEAT / Vivid Seats Inc. | 0.79 | 31.37 | 1.23 | -50.50 | 0.7677 | -0.7816 | |||
| HLLY / Holley Inc. | 0.61 | 71.25 | 1.19 | 22.15 | 0.7458 | 0.1358 | |||
| GSM / Ferroglobe PLC | 0.21 | 0.76 | 0.4751 | 0.4751 | |||||
| GO / Grocery Outlet Holding Corp. | 0.05 | -80.79 | 0.74 | -78.02 | 0.4652 | -1.6488 | |||
| TBI / TrueBlue, Inc. | 0.07 | 0.41 | 0.2594 | 0.2594 |