Statistik Asas
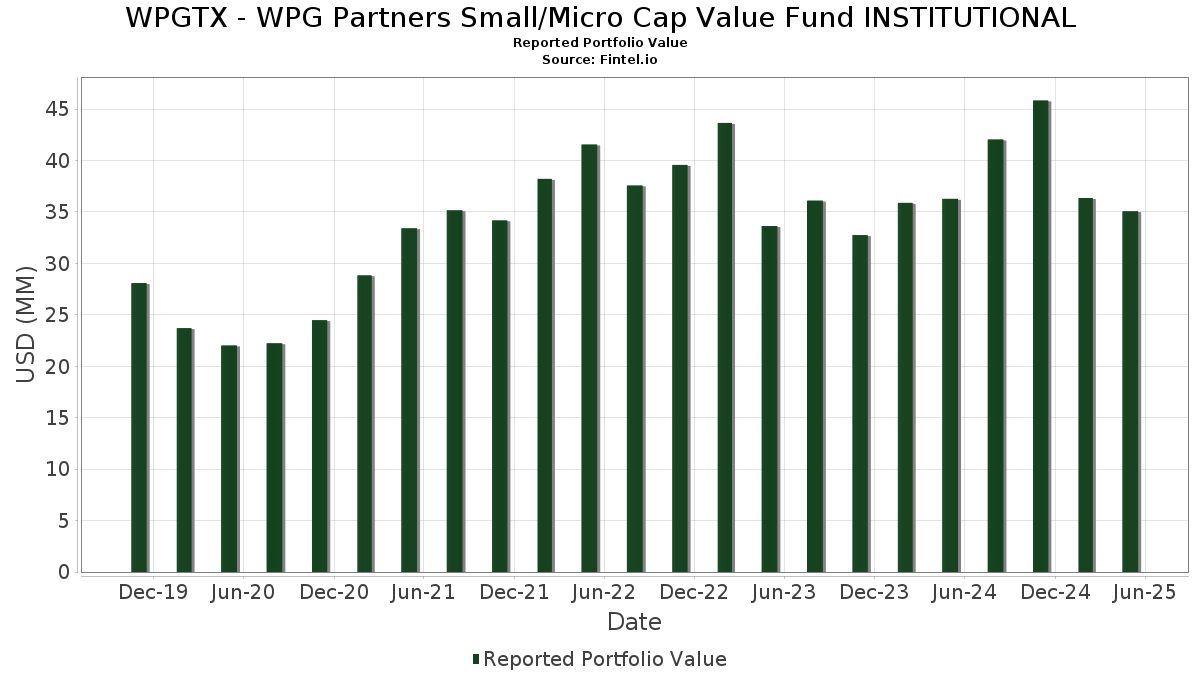
| Nilai Portfolio | $ 35,065,165 |
| Kedudukan Semasa | 95 |
Pegangan Terkini, Prestasi, AUM (dari 13F, 13D)
WPGTX - WPG Partners Small/Micro Cap Value Fund INSTITUTIONAL telah mendedahkan 95 jumlah pegangan dalam pemfailan SEC terkini mereka. Nilai portfolio terkini dikira sebagai $ 35,065,165 USD. Aset Sebenar Di Bawah Pengurusan (AUM) ialah nilai ini ditambah dengan tunai (yang tidak didedahkan). Pegangan teratas WPGTX - WPG Partners Small/Micro Cap Value Fund INSTITUTIONAL ialah Kemper Corporation (US:KMPR) , Silicon Motion Technology Corporation - Depositary Receipt (Common Stock) (US:SIMO) , BGC Group, Inc. (US:BGC) , Teleflex Incorporated (US:TFX) , and Brixmor Property Group Inc. (US:BRX) . Kedudukan baharu WPGTX - WPG Partners Small/Micro Cap Value Fund INSTITUTIONAL termasuk Broadstone Net Lease, Inc. (US:BNL) , WesBanco, Inc. (US:WSBC) , Coherent Corp. (US:COHR) , SLM Corporation (US:SLM) , and Maximus, Inc. (US:MMS) .
Kenaikan Teratas Suku Tahun Ini
Kami menggunakan perubahan dalam peruntukan portfolio kerana ini adalah metrik yang paling bermakna. Perubahan boleh disebabkan oleh perdagangan atau perubahan dalam harga saham.
| Sekuriti | Saham (MM) |
Nilai (MM$) |
Portfolio % | ΔPortfolio % |
|---|---|---|---|---|
| 5.22 | 5.22 | 17.4780 | 17.4780 | |
| 0.90 | 3.0048 | 3.0048 | ||
| 0.02 | 0.38 | 1.2685 | 1.2685 | |
| 0.01 | 0.29 | 0.9702 | 0.9702 | |
| 0.00 | 0.28 | 0.9455 | 0.9455 | |
| 0.01 | 0.28 | 0.9243 | 0.9243 | |
| 0.00 | 0.24 | 0.7908 | 0.7908 | |
| 0.04 | 0.47 | 1.5777 | 0.6747 | |
| 0.01 | 0.61 | 2.0604 | 0.6663 | |
| 0.00 | 0.34 | 1.1469 | 0.6227 |
Penurunan Teratas Suku Tahun Ini
Kami menggunakan perubahan dalam peruntukan portfolio kerana ini adalah metrik yang paling bermakna. Perubahan boleh disebabkan oleh perdagangan atau perubahan dalam harga saham.
| Sekuriti | Saham (MM) |
Nilai (MM$) |
Portfolio % | ΔPortfolio % |
|---|---|---|---|---|
| 0.01 | 0.14 | 0.4643 | -1.0032 | |
| 0.00 | 0.27 | 0.9013 | -0.5779 | |
| 0.01 | 0.29 | 0.9586 | -0.5475 | |
| 0.00 | 0.00 | -0.5346 | ||
| 0.01 | 0.07 | 0.2312 | -0.5091 | |
| 0.01 | 0.54 | 1.8095 | -0.5067 | |
| 0.01 | 0.27 | 0.9131 | -0.4620 | |
| 0.00 | 0.07 | 0.2457 | -0.4278 | |
| 0.03 | 0.29 | 0.9593 | -0.4165 | |
| 0.00 | 0.10 | 0.3202 | -0.4063 |
13F dan Pemfailan Dana
Borang ini telah difailkan pada 2025-07-29 untuk tempoh pelaporan 2025-05-31. Klik ikon pautan untuk melihat sejarah transaksi penuh.
Tingkatkan untuk membuka data premium dan eksport ke Excel ![]() .
.
| Sekuriti | Jenis | Purata Harga Saham | Saham (MM) |
ΔSaham (%) |
ΔSaham (%) |
Nilai ($MM) |
Portfolio (%) |
ΔPortfolio (%) |
|
|---|---|---|---|---|---|---|---|---|---|
| Mount Vernon Liquid Assets Portfolio, LLC / STIV (N/A) | 5.22 | 5.22 | 17.4780 | 17.4780 | |||||
| Tri-State Deposit / STIV (N/A) | 0.90 | 3.0048 | 3.0048 | ||||||
| KMPR / Kemper Corporation | 0.01 | -7.88 | 0.72 | -13.16 | 2.4122 | -0.2200 | |||
| SIMO / Silicon Motion Technology Corporation - Depositary Receipt (Common Stock) | 0.01 | 1.64 | 0.72 | 10.84 | 2.4005 | 0.3482 | |||
| BGC / BGC Group, Inc. | 0.07 | 0.38 | 0.66 | -5.82 | 2.2252 | -0.0166 | |||
| TFX / Teleflex Incorporated | 0.01 | 52.12 | 0.61 | 40.18 | 2.0604 | 0.6663 | |||
| BRX / Brixmor Property Group Inc. | 0.02 | -10.99 | 0.61 | -19.15 | 2.0388 | -0.3506 | |||
| THG / The Hanover Insurance Group, Inc. | 0.00 | 0.41 | 0.60 | 3.61 | 2.0178 | 0.1718 | |||
| ENOV / Enovis Corporation | 0.02 | -1.77 | 0.58 | -20.47 | 1.9432 | -0.3723 | |||
| AL / Air Lease Corporation | 0.01 | -15.44 | 0.57 | 1.60 | 1.9163 | 0.1294 | |||
| GTY / Getty Realty Corp. | 0.02 | 0.38 | 0.57 | -6.45 | 1.8967 | -0.0254 | |||
| EFSC / Enterprise Financial Services Corp | 0.01 | 0.38 | 0.56 | -10.11 | 1.8780 | -0.1013 | |||
| WBS / Webster Financial Corporation | 0.01 | -18.98 | 0.54 | -25.93 | 1.8095 | -0.5067 | |||
| POR / Portland General Electric Company | 0.01 | -5.73 | 0.53 | -10.76 | 1.7796 | -0.1125 | |||
| PB / Prosperity Bancshares, Inc. | 0.01 | 10.47 | 0.48 | 0.21 | 1.6036 | 0.0870 | |||
| BV / BrightView Holdings, Inc. | 0.03 | 11.31 | 0.48 | 29.27 | 1.6002 | 0.4264 | |||
| NCR / NCR Corp. | 0.04 | 68.47 | 0.47 | 65.49 | 1.5777 | 0.6747 | |||
| ABM / ABM Industries Incorporated | 0.01 | 23.87 | 0.46 | 20.00 | 1.5287 | 0.3215 | |||
| SR / Spire Inc. | 0.01 | -11.72 | 0.45 | -13.60 | 1.5125 | -0.1457 | |||
| STNG / Scorpio Tankers Inc. | 0.01 | 0.38 | 0.44 | 0.00 | 1.4794 | 0.0784 | |||
| GXO / GXO Logistics, Inc. | 0.01 | 9.98 | 0.44 | 14.88 | 1.4753 | 0.2568 | |||
| GIL / Gildan Activewear Inc. | 0.01 | -5.83 | 0.43 | -18.75 | 1.4378 | -0.2403 | |||
| CARG / CarGurus, Inc. | 0.01 | -9.45 | 0.42 | -11.79 | 1.4041 | -0.1058 | |||
| CSCCF / Capstone Copper Corp. | 0.07 | 25.72 | 0.40 | 23.38 | 1.3448 | 0.3118 | |||
| KNX / Knight-Swift Transportation Holdings Inc. | 0.01 | 28.99 | 0.40 | 13.35 | 1.3386 | 0.2190 | |||
| CXT / Crane NXT, Co. | 0.01 | 20.23 | 0.39 | 15.73 | 1.3077 | 0.2341 | |||
| DRVN / Driven Brands Holdings Inc. | 0.02 | 0.38 | 0.39 | 2.11 | 1.2986 | 0.0922 | |||
| DRS / Leonardo DRS, Inc. | 0.01 | 0.38 | 0.39 | 39.35 | 1.2965 | 0.4151 | |||
| NBHC / National Bank Holdings Corporation | 0.01 | -6.73 | 0.38 | -19.53 | 1.2723 | -0.2255 | |||
| BNL / Broadstone Net Lease, Inc. | 0.02 | 0.38 | 1.2685 | 1.2685 | |||||
| FCF / First Commonwealth Financial Corporation | 0.02 | 0.38 | 0.38 | -4.55 | 1.2683 | 0.0077 | |||
| NWE / NorthWestern Energy Group, Inc. | 0.01 | 22.58 | 0.38 | 35.13 | 1.2640 | 0.2576 | |||
| BKV / BKV Corporation | 0.02 | 30.65 | 0.38 | 39.26 | 1.2609 | 0.4018 | |||
| CSTM / Constellium SE | 0.03 | -5.67 | 0.37 | 0.83 | 1.2266 | 0.0711 | |||
| ERO / Ero Copper Corp. | 0.03 | 0.38 | 0.36 | 19.87 | 1.2153 | 0.2539 | |||
| KBR / KBR, Inc. | 0.01 | 45.35 | 0.36 | 55.02 | 1.1899 | 0.4608 | |||
| DHT / DHT Holdings, Inc. | 0.03 | 0.38 | 0.35 | 12.42 | 1.1848 | 0.1858 | |||
| BPOP / Popular, Inc. | 0.00 | 101.22 | 0.34 | 107.27 | 1.1469 | 0.6227 | |||
| VRNT / Verint Systems Inc. | 0.02 | 50.12 | 0.34 | 16.78 | 1.1436 | 0.2144 | |||
| INR / Infinity Natural Resources, Inc. | 0.02 | 16.11 | 0.34 | 7.62 | 1.1388 | 0.1366 | |||
| BKH / Black Hills Corporation | 0.01 | 15.18 | 0.34 | 22.38 | 1.1375 | 0.1901 | |||
| CNO / CNO Financial Group, Inc. | 0.01 | 30.07 | 0.32 | 18.52 | 1.0750 | 0.2146 | |||
| HCC / Warrior Met Coal, Inc. | 0.01 | 12.10 | 0.32 | 5.65 | 1.0677 | 0.1114 | |||
| PHR / Phreesia, Inc. | 0.01 | 10.40 | 0.31 | 1.96 | 1.0471 | 0.0727 | |||
| MYRG / MYR Group Inc. | 0.00 | -24.90 | 0.30 | -3.82 | 1.0128 | 0.0125 | |||
| AXS / AXIS Capital Holdings Limited | 0.00 | -34.85 | 0.30 | -30.30 | 1.0045 | -0.3597 | |||
| SBLK / Star Bulk Carriers Corp. | 0.02 | -35.24 | 0.30 | -31.58 | 1.0035 | -0.3872 | |||
| TDC / Teradata Corporation | 0.01 | 33.22 | 0.30 | 22.73 | 0.9967 | 0.2268 | |||
| WSBC / WesBanco, Inc. | 0.01 | 0.29 | 0.9702 | 0.9702 | |||||
| ADT / ADT Inc. | 0.03 | -34.93 | 0.29 | -33.95 | 0.9593 | -0.4165 | |||
| TSEM / Tower Semiconductor Ltd. | 0.01 | -34.98 | 0.29 | -39.66 | 0.9586 | -0.5475 | |||
| ACA / Arcosa, Inc. | 0.00 | -0.45 | 0.29 | 2.15 | 0.9583 | 0.0710 | |||
| FBP / First BanCorp. | 0.01 | -14.16 | 0.29 | -11.76 | 0.9553 | -0.0727 | |||
| COHR / Coherent Corp. | 0.00 | 0.28 | 0.9455 | 0.9455 | |||||
| NOMD / Nomad Foods Limited | 0.02 | -19.85 | 0.28 | -25.87 | 0.9347 | -0.2593 | |||
| SLM / SLM Corporation | 0.01 | 0.28 | 0.9243 | 0.9243 | |||||
| ASH / Ashland Inc. | 0.01 | -22.67 | 0.27 | -37.04 | 0.9131 | -0.4620 | |||
| MTZ / MasTec, Inc. | 0.00 | -51.63 | 0.27 | -42.37 | 0.9013 | -0.5779 | |||
| NMRK / Newmark Group, Inc. | 0.02 | 12.41 | 0.26 | -15.86 | 0.8744 | -0.1082 | |||
| THC / Tenet Healthcare Corporation | 0.00 | 14.94 | 0.26 | 53.25 | 0.8703 | 0.3319 | |||
| HUN / Huntsman Corporation | 0.02 | 34.19 | 0.26 | -11.76 | 0.8554 | -0.0629 | |||
| HLMN / Hillman Solutions Corp. | 0.03 | 47.53 | 0.25 | 9.65 | 0.8385 | 0.1122 | |||
| MMS / Maximus, Inc. | 0.00 | 0.24 | 0.7908 | 0.7908 | |||||
| TKA / thyssenkrupp AG | 0.02 | -25.68 | 0.23 | -8.27 | 0.7821 | -0.0251 | |||
| AA / Alcoa Corporation | 0.01 | 0.39 | 0.23 | -19.01 | 0.7712 | -0.1334 | |||
| CMC / Commercial Metals Company | 0.00 | 38.78 | 0.22 | 33.53 | 0.7486 | 0.2169 | |||
| BBWI / Bath & Body Works, Inc. | 0.01 | 7.83 | 0.22 | -16.28 | 0.7257 | -0.0963 | |||
| 8AMMF0A92 / US Bank MM Deposit Account Global Fund | 0.21 | 62.95 | 0.21 | 63.08 | 0.7106 | 0.2972 | |||
| SM / SM Energy Company | 0.01 | 13.01 | 0.21 | -19.23 | 0.7069 | -0.1213 | |||
| AAP / Advance Auto Parts, Inc. | 0.00 | 0.39 | 0.20 | 29.80 | 0.6601 | 0.1802 | |||
| MOS / The Mosaic Company | 0.01 | 107.57 | 0.19 | 46.92 | 0.6410 | 0.2341 | |||
| HALO / Halozyme Therapeutics, Inc. | 0.00 | -1.26 | 0.18 | 15.13 | 0.5875 | 0.1565 | |||
| XPRO / Expro Group Holdings N.V. | 0.02 | 206.53 | 0.17 | 116.25 | 0.5820 | 0.3248 | |||
| DIOD / Diodes Incorporated | 0.00 | 0.36 | 0.17 | -9.42 | 0.5801 | -0.0293 | |||
| THRM / Gentherm Incorporated | 0.01 | 9.76 | 0.17 | -9.19 | 0.5632 | -0.0248 | |||
| UFPI / UFP Industries, Inc. | 0.00 | 0.37 | 0.16 | -8.09 | 0.5328 | -0.0191 | |||
| TKR / The Timken Company | 0.00 | 0.35 | 0.16 | -15.30 | 0.5226 | -0.0612 | |||
| UA / Under Armour, Inc. | 0.02 | -34.22 | 0.15 | -34.75 | 0.5161 | -0.2336 | |||
| NVEE / NV5 Global, Inc. | 0.01 | 0.15 | 0.5065 | 0.5065 | |||||
| FLR / Fluor Corporation | 0.00 | -48.91 | 0.15 | -44.32 | 0.4950 | -0.3451 | |||
| FCFS / FirstCash Holdings, Inc. | 0.00 | -49.32 | 0.14 | -42.17 | 0.4826 | -0.3099 | |||
| GO / Grocery Outlet Holding Corp. | 0.01 | -73.78 | 0.14 | -70.07 | 0.4643 | -1.0032 | |||
| CCS / Century Communities, Inc. | 0.00 | 20.47 | 0.14 | -10.00 | 0.4531 | -0.0241 | |||
| WH / Wyndham Hotels & Resorts, Inc. | 0.00 | 0.13 | 0.4399 | 0.4399 | |||||
| FA / First Advantage Corporation | 0.01 | 0.13 | 0.4302 | 0.4302 | |||||
| VNOM / Viper Energy, Inc. | 0.00 | 0.12 | 0.4104 | 0.4104 | |||||
| LBRT / Liberty Energy Inc. | 0.01 | 0.11 | 0.3733 | 0.3733 | |||||
| BB / BlackBerry Limited | 0.03 | -10.21 | 0.10 | -24.64 | 0.3503 | -0.0896 | |||
| W / Wayfair Inc. | 0.00 | -59.93 | 0.10 | -58.33 | 0.3202 | -0.4063 | |||
| PLAY / Dave & Buster's Entertainment, Inc. | 0.00 | -61.42 | 0.08 | -59.49 | 0.2651 | -0.3546 | |||
| CALX / Calix, Inc. | 0.00 | 0.08 | 0.2603 | 0.2603 | |||||
| TLN / Talen Energy Corporation | 0.00 | -34.75 | 0.08 | -23.47 | 0.2518 | -0.0600 | |||
| WHR / Whirlpool Corporation | 0.00 | -54.92 | 0.07 | -65.57 | 0.2457 | -0.4278 | |||
| PRI / Primerica, Inc. | 0.00 | 0.07 | 0.2430 | 0.2430 | |||||
| AESI / Atlas Energy Solutions Inc. | 0.01 | -48.94 | 0.07 | -73.66 | 0.2312 | -0.5091 | |||
| PTEN / Patterson-UTI Energy, Inc. | 0.00 | -100.00 | 0.00 | -100.00 | -0.5346 |