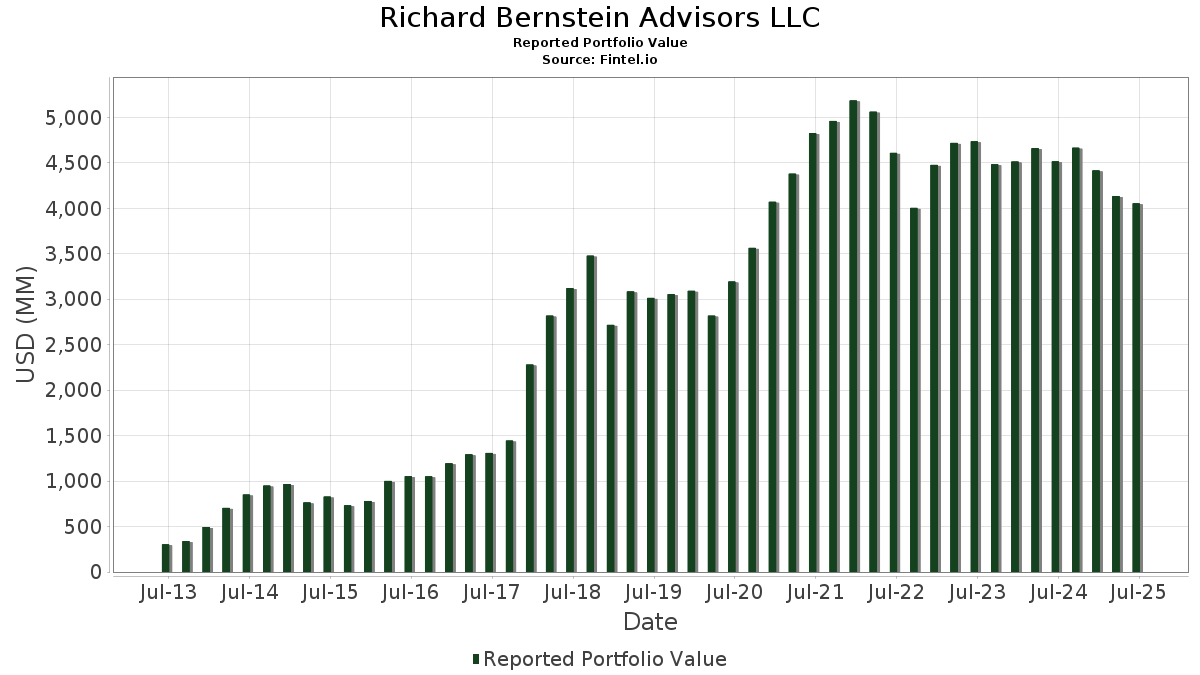
Statistik Asas
| Nilai Portfolio | $ 4,052,455,858 |
| Kedudukan Semasa | 212 |
Pegangan Terkini, Prestasi, AUM (dari 13F, 13D)
Richard Bernstein Advisors LLC telah mendedahkan 212 jumlah pegangan dalam pemfailan SEC terkini mereka. Nilai portfolio terkini dikira sebagai $ 4,052,455,858 USD. Aset Sebenar Di Bawah Pengurusan (AUM) ialah nilai ini ditambah dengan tunai (yang tidak didedahkan). Pegangan teratas Richard Bernstein Advisors LLC ialah Janus Detroit Street Trust - Janus Henderson Mortgage-Backed Securities ETF (US:JMBS) , iShares Trust - iShares MSCI Intl Quality Factor ETF (US:IQLT) , Vanguard Index Funds - Vanguard Value ETF (US:VTV) , Fidelity Covington Trust - Fidelity MSCI Information Technology Index ETF (US:FTEC) , and SPDR Series Trust - SPDR Portfolio Intermediate Term Treasury ETF (US:SPTI) . Kedudukan baharu Richard Bernstein Advisors LLC termasuk SPDR Series Trust - SPDR Portfolio Intermediate Term Treasury ETF (US:SPTI) , Kenvue Inc. (US:KVUE) , Arch Capital Group Ltd. (US:ACGL) , Ralliant Corporation (US:RAL) , and .
Kenaikan Teratas Suku Tahun Ini
Kami menggunakan perubahan dalam peruntukan portfolio kerana ini adalah metrik yang paling bermakna. Perubahan boleh disebabkan oleh perdagangan atau perubahan dalam harga saham.
| Sekuriti | Saham (MM) |
Nilai (MM$) |
Portfolio % | ΔPortfolio % |
|---|---|---|---|---|
| 8.25 | 237.30 | 5.8557 | 5.8557 | |
| 9.13 | 394.78 | 9.7417 | 3.0184 | |
| 0.74 | 60.31 | 1.4882 | 1.4882 | |
| 0.56 | 45.53 | 1.1234 | 1.1234 | |
| 1.41 | 277.39 | 6.8450 | 1.0339 | |
| 10.27 | 462.89 | 11.4224 | 0.9511 | |
| 0.42 | 66.48 | 1.6405 | 0.4465 | |
| 0.71 | 77.17 | 1.9043 | 0.3041 | |
| 0.12 | 60.63 | 1.4960 | 0.2811 | |
| 1.35 | 116.15 | 2.8662 | 0.1808 |
Penurunan Teratas Suku Tahun Ini
Kami menggunakan perubahan dalam peruntukan portfolio kerana ini adalah metrik yang paling bermakna. Perubahan boleh disebabkan oleh perdagangan atau perubahan dalam harga saham.
| Sekuriti | Saham (MM) |
Nilai (MM$) |
Portfolio % | ΔPortfolio % |
|---|---|---|---|---|
| 7.28 | 213.31 | 5.2638 | -3.6285 | |
| 2.90 | 182.82 | 4.5114 | -2.4183 | |
| 0.01 | 0.31 | 0.0075 | -1.6575 | |
| 0.00 | 0.01 | 0.0002 | -1.4736 | |
| 2.09 | 109.57 | 2.7037 | -1.0632 | |
| 0.51 | 47.62 | 1.1751 | -0.7401 | |
| 0.44 | 72.76 | 1.7953 | -0.3975 | |
| 0.38 | 21.77 | 0.5373 | -0.3862 | |
| 0.43 | 23.89 | 0.5894 | -0.3769 | |
| 0.26 | 52.85 | 1.3042 | -0.2218 |
13F dan Pemfailan Dana
Borang ini telah difailkan pada 2025-08-06 untuk tempoh pelaporan 2025-06-30. Klik ikon pautan untuk melihat sejarah transaksi penuh.
Tingkatkan untuk membuka data premium dan eksport ke Excel ![]() .
.
| Sekuriti | Jenis | Purata Harga Saham | Saham (MM) |
ΔSaham (%) |
ΔSaham (%) |
Nilai ($MM) |
Portfolio (%) |
ΔPortfolio (%) |
|
|---|---|---|---|---|---|---|---|---|---|
| JMBS / Janus Detroit Street Trust - Janus Henderson Mortgage-Backed Securities ETF | 10.27 | 7.32 | 462.89 | 6.96 | 11.4224 | 0.9511 | |||
| IQLT / iShares Trust - iShares MSCI Intl Quality Factor ETF | 9.13 | 30.48 | 394.78 | 42.08 | 9.7417 | 3.0184 | |||
| VTV / Vanguard Index Funds - Vanguard Value ETF | 1.75 | -4.06 | 308.90 | -1.83 | 7.6227 | 0.0085 | |||
| FTEC / Fidelity Covington Trust - Fidelity MSCI Information Technology Index ETF | 1.41 | -5.55 | 277.39 | 15.50 | 6.8450 | 1.0339 | |||
| SPTI / SPDR Series Trust - SPDR Portfolio Intermediate Term Treasury ETF | 8.25 | 237.30 | 5.8557 | 5.8557 | |||||
| SPTS / SPDR Series Trust - SPDR Portfolio Short Term Treasury ETF | 7.28 | -42.05 | 213.31 | -41.95 | 5.2638 | -3.6285 | |||
| EMXC / iShares, Inc. - iShares MSCI Emerging Markets ex China ETF | 2.90 | -44.30 | 182.82 | -36.16 | 4.5114 | -2.4183 | |||
| TLH / iShares Trust - iShares 10-20 Year Treasury Bond ETF | 1.71 | -3.38 | 173.48 | -5.38 | 4.2809 | -0.1556 | |||
| SDY / SPDR Series Trust - SPDR S&P Dividend ETF | 1.08 | -7.21 | 145.96 | -7.17 | 3.6017 | -0.2030 | |||
| IXJ / iShares Trust - iShares Global Healthcare ETF | 1.35 | 10.87 | 116.15 | 4.66 | 2.8662 | 0.1808 | |||
| XLF / The Select Sector SPDR Trust - The Financial Select Sector SPDR Fund | 2.09 | -33.06 | 109.57 | -29.62 | 2.7037 | -1.0632 | |||
| BAR / GraniteShares Gold Trust | 2.70 | -7.92 | 88.24 | -2.54 | 2.1774 | -0.0134 | |||
| XLC / The Select Sector SPDR Trust - The Communication Services Select Sector SPDR Fund | 0.71 | 3.70 | 77.17 | 16.69 | 1.9043 | 0.3041 | |||
| EXI / iShares Trust - iShares Global Industrials ETF | 0.44 | -29.43 | 72.76 | -19.72 | 1.7953 | -0.3975 | |||
| NVDD / Direxion Shares ETF Trust - Direxion Daily NVDA Bear 1X Shares | 0.42 | -7.58 | 66.48 | 34.73 | 1.6405 | 0.4465 | |||
| MSFT / Microsoft Corporation | 0.12 | -8.88 | 60.63 | 20.74 | 1.4960 | 0.2811 | |||
| XLP / The Select Sector SPDR Trust - The Consumer Staples Select Sector SPDR Fund | 0.74 | 60.31 | 1.4882 | 1.4882 | |||||
| AAPL / Apple Inc. | 0.26 | -9.27 | 52.85 | -16.20 | 1.3042 | -0.2218 | |||
| FDIS / Fidelity Covington Trust - Fidelity MSCI Consumer Discretionary Index ETF | 0.51 | -45.95 | 47.62 | -39.84 | 1.1751 | -0.7401 | |||
| XLU / The Select Sector SPDR Trust - The Utilities Select Sector SPDR Fund | 0.56 | 45.53 | 1.1234 | 1.1234 | |||||
| AMZN / Amazon.com, Inc. | 0.16 | -8.20 | 35.29 | 5.85 | 0.8708 | 0.0641 | |||
| META / Meta Platforms, Inc. | 0.04 | -9.20 | 27.29 | 16.28 | 0.6733 | 0.1055 | |||
| INDA / iShares Trust - iShares MSCI India ETF | 0.43 | -44.70 | 23.89 | -40.18 | 0.5894 | -0.3769 | |||
| EWT / iShares, Inc. - iShares MSCI Taiwan ETF | 0.38 | -52.81 | 21.77 | -42.95 | 0.5373 | -0.3862 | |||
| AVGO / Broadcom Inc. | 0.08 | -8.99 | 20.81 | 49.83 | 0.5135 | 0.1775 | |||
| GOOGL / Alphabet Inc. | 0.10 | -8.96 | 17.19 | 3.76 | 0.4241 | 0.0233 | |||
| TSLA / Tesla, Inc. | 0.05 | -6.45 | 15.31 | 14.67 | 0.3778 | 0.0547 | |||
| GOOG / Alphabet Inc. | 0.08 | -9.71 | 14.66 | 2.52 | 0.3617 | 0.0157 | |||
| JPM / JPMorgan Chase & Co. | 0.05 | -16.67 | 13.66 | -1.51 | 0.3370 | 0.0015 | |||
| QUAL / iShares Trust - iShares MSCI USA Quality Factor ETF | 0.07 | -1.51 | 12.41 | 5.37 | 0.3062 | 0.0213 | |||
| EWY / iShares, Inc. - iShares MSCI South Korea ETF | 0.17 | -54.01 | 12.20 | -38.91 | 0.3011 | -0.1822 | |||
| LLY / Eli Lilly and Company | 0.02 | -4.48 | 11.73 | -9.84 | 0.2894 | -0.0254 | |||
| BRK.A / Berkshire Hathaway Inc. | 0.02 | -11.80 | 11.48 | -19.55 | 0.2833 | -0.0620 | |||
| WMT / Walmart Inc. | 0.11 | -0.07 | 11.23 | 11.30 | 0.2772 | 0.0330 | |||
| BSX / Boston Scientific Corporation | 0.09 | -4.27 | 10.08 | 1.92 | 0.2489 | 0.0094 | |||
| GE / General Electric Company | 0.03 | -8.48 | 8.57 | 17.70 | 0.2114 | 0.0353 | |||
| PM / Philip Morris International Inc. | 0.05 | 74.83 | 8.44 | 100.62 | 0.2082 | 0.1064 | |||
| SPGI / S&P Global Inc. | 0.02 | -5.16 | 8.38 | -1.57 | 0.2067 | 0.0008 | |||
| ABT / Abbott Laboratories | 0.06 | 0.00 | 7.69 | 2.53 | 0.1898 | 0.0083 | |||
| KO / The Coca-Cola Company | 0.11 | -8.38 | 7.69 | -9.50 | 0.1897 | -0.0158 | |||
| JNJ / Johnson & Johnson | 0.05 | 78.22 | 7.64 | 64.18 | 0.1886 | 0.0760 | |||
| CEG / Constellation Energy Corporation | 0.02 | 0.00 | 7.21 | 60.06 | 0.1780 | 0.0690 | |||
| MKL / Markel Group Inc. | 0.00 | 0.00 | 7.02 | 6.83 | 0.1732 | 0.0142 | |||
| ETN / Eaton Corporation plc | 0.02 | 0.00 | 6.92 | 31.32 | 0.1708 | 0.0433 | |||
| COR / Cencora, Inc. | 0.02 | -0.04 | 6.49 | 7.79 | 0.1602 | 0.0145 | |||
| VICI / VICI Properties Inc. | 0.20 | 0.00 | 6.39 | -0.06 | 0.1576 | 0.0030 | |||
| MO / Altria Group, Inc. | 0.11 | 6.38 | 0.1574 | 0.1574 | |||||
| AIG / American International Group, Inc. | 0.07 | -6.34 | 6.30 | -7.80 | 0.1554 | -0.0099 | |||
| UNH / UnitedHealth Group Incorporated | 0.02 | -0.07 | 6.29 | -40.48 | 0.1552 | -0.1005 | |||
| CL / Colgate-Palmolive Company | 0.07 | 6.16 | 0.1521 | 0.1521 | |||||
| ABBV / AbbVie Inc. | 0.03 | -0.11 | 6.06 | -11.50 | 0.1497 | -0.0162 | |||
| HWM / Howmet Aerospace Inc. | 0.03 | -23.65 | 5.82 | 9.54 | 0.1437 | 0.0151 | |||
| MCK / McKesson Corporation | 0.01 | 0.00 | 5.71 | 8.89 | 0.1408 | 0.0140 | |||
| BAC / Bank of America Corporation | 0.12 | -9.62 | 5.66 | 2.48 | 0.1396 | 0.0060 | |||
| PEP / PepsiCo, Inc. | 0.04 | 119.34 | 5.63 | 93.13 | 0.1389 | 0.0684 | |||
| GILD / Gilead Sciences, Inc. | 0.05 | 82.67 | 5.59 | 80.78 | 0.1379 | 0.0631 | |||
| WFC / Wells Fargo & Company | 0.07 | -0.10 | 5.54 | 11.49 | 0.1368 | 0.0165 | |||
| GD / General Dynamics Corporation | 0.02 | 0.00 | 5.52 | 6.99 | 0.1363 | 0.0114 | |||
| KMB / Kimberly-Clark Corporation | 0.04 | 5.47 | 0.1351 | 0.1351 | |||||
| UBER / Uber Technologies, Inc. | 0.06 | -8.65 | 5.41 | 16.98 | 0.1334 | 0.0216 | |||
| PG / The Procter & Gamble Company | 0.03 | 133.01 | 5.38 | 117.85 | 0.1328 | 0.0730 | |||
| CCEP / Coca-Cola Europacific Partners PLC | 0.06 | 5.36 | 0.1323 | 0.1323 | |||||
| MA / Mastercard Incorporated | 0.01 | 0.00 | 5.31 | 2.51 | 0.1310 | 0.0057 | |||
| EXC / Exelon Corporation | 0.12 | 0.00 | 5.28 | -5.78 | 0.1304 | -0.0053 | |||
| CAT / Caterpillar Inc. | 0.01 | -7.71 | 5.19 | 8.65 | 0.1281 | 0.0125 | |||
| IBM / International Business Machines Corporation | 0.02 | -9.70 | 5.18 | 7.05 | 0.1279 | 0.0107 | |||
| KVUE / Kenvue Inc. | 0.24 | 5.10 | 0.1257 | 0.1257 | |||||
| BKNG / Booking Holdings Inc. | 0.00 | -8.35 | 5.08 | 15.16 | 0.1254 | 0.0186 | |||
| ITA / iShares Trust - iShares U.S. Aerospace & Defense ETF | 0.03 | -44.50 | 4.94 | -31.62 | 0.1219 | -0.0529 | |||
| EQH / Equitable Holdings, Inc. | 0.09 | -8.93 | 4.90 | -1.92 | 0.1209 | 0.0000 | |||
| FE / FirstEnergy Corp. | 0.12 | 0.00 | 4.78 | -0.40 | 0.1180 | 0.0018 | |||
| PPL / PPL Corporation | 0.14 | 4.78 | 0.1180 | 0.1180 | |||||
| GEHC / GE HealthCare Technologies Inc. | 0.06 | 0.00 | 4.67 | -8.23 | 0.1153 | -0.0079 | |||
| MDLZ / Mondelez International, Inc. | 0.07 | 4.65 | 0.1147 | 0.1147 | |||||
| ISRG / Intuitive Surgical, Inc. | 0.01 | -11.13 | 4.63 | -2.49 | 0.1142 | -0.0006 | |||
| MDT / Medtronic plc | 0.05 | 0.00 | 4.60 | -3.00 | 0.1135 | -0.0012 | |||
| CARR / Carrier Global Corporation | 0.06 | 0.00 | 4.57 | 15.44 | 0.1127 | 0.0170 | |||
| STZ / Constellation Brands, Inc. | 0.03 | 4.45 | 0.1098 | 0.1098 | |||||
| CRBG / Corebridge Financial, Inc. | 0.12 | -7.67 | 4.42 | 3.83 | 0.1091 | 0.0061 | |||
| GEV / GE Vernova Inc. | 0.01 | -9.53 | 4.39 | 56.83 | 0.1082 | 0.0405 | |||
| PCG / PG&E Corporation | 0.31 | 0.00 | 4.37 | -18.86 | 0.1078 | -0.0225 | |||
| LIN / Linde plc | 0.01 | -0.12 | 4.35 | 0.62 | 0.1074 | 0.0028 | |||
| HCA / HCA Healthcare, Inc. | 0.01 | 0.00 | 4.34 | 10.85 | 0.1072 | 0.0124 | |||
| NOC / Northrop Grumman Corporation | 0.01 | 0.00 | 4.33 | -2.35 | 0.1068 | -0.0004 | |||
| AM / Antero Midstream Corporation | 0.23 | 0.00 | 4.30 | 5.26 | 0.1062 | 0.0073 | |||
| SYK / Stryker Corporation | 0.01 | 0.00 | 4.24 | 6.29 | 0.1047 | 0.0081 | |||
| HLI / Houlihan Lokey, Inc. | 0.02 | -8.26 | 4.19 | 2.22 | 0.1034 | 0.0042 | |||
| PCAR / PACCAR Inc | 0.04 | -9.50 | 4.11 | -11.65 | 0.1015 | -0.0112 | |||
| JCI / Johnson Controls International plc | 0.04 | -0.08 | 4.11 | 31.74 | 0.1013 | 0.0259 | |||
| CAH / Cardinal Health, Inc. | 0.02 | 0.00 | 4.10 | 21.95 | 0.1012 | 0.0198 | |||
| ETR / Entergy Corporation | 0.05 | 0.00 | 4.09 | -2.78 | 0.1010 | -0.0009 | |||
| T / AT&T Inc. | 0.14 | -7.92 | 4.08 | -5.78 | 0.1007 | -0.0041 | |||
| CNC / Centene Corporation | 0.08 | 0.00 | 4.07 | -10.60 | 0.1005 | -0.0097 | |||
| DE / Deere & Company | 0.01 | -9.11 | 3.94 | -1.53 | 0.0972 | 0.0004 | |||
| FOX / Fox Corporation | 0.08 | -11.29 | 3.92 | -13.11 | 0.0967 | -0.0124 | |||
| CTVA / Corteva, Inc. | 0.05 | 0.00 | 3.90 | 18.46 | 0.0961 | 0.0165 | |||
| CSCO / Cisco Systems, Inc. | 0.06 | 0.00 | 3.88 | 12.41 | 0.0957 | 0.0122 | |||
| HLNE / Hamilton Lane Incorporated | 0.03 | -7.66 | 3.87 | -11.74 | 0.0955 | -0.0106 | |||
| CVX / Chevron Corporation | 0.03 | 0.00 | 3.86 | -14.41 | 0.0953 | -0.0139 | |||
| C / Citigroup Inc. | 0.04 | -7.51 | 3.81 | 10.89 | 0.0940 | 0.0109 | |||
| VST / Vistra Corp. | 0.02 | 0.00 | 3.80 | 65.03 | 0.0939 | 0.0381 | |||
| AXP / American Express Company | 0.01 | -9.73 | 3.79 | 7.01 | 0.0934 | 0.0078 | |||
| WM / Waste Management, Inc. | 0.02 | -8.80 | 3.76 | -9.87 | 0.0929 | -0.0082 | |||
| HIG / The Hartford Insurance Group, Inc. | 0.03 | -9.27 | 3.74 | -6.96 | 0.0924 | -0.0050 | |||
| KKR / KKR & Co. Inc. | 0.03 | -8.16 | 3.73 | 5.66 | 0.0921 | 0.0066 | |||
| CME / CME Group Inc. | 0.01 | -0.08 | 3.72 | 3.82 | 0.0919 | 0.0051 | |||
| AMGN / Amgen Inc. | 0.01 | 0.00 | 3.72 | -10.38 | 0.0918 | -0.0086 | |||
| RTX / RTX Corporation | 0.03 | -0.18 | 3.69 | 10.04 | 0.0912 | 0.0099 | |||
| TT / Trane Technologies plc | 0.01 | 0.00 | 3.64 | 29.84 | 0.0899 | 0.0220 | |||
| FIS / Fidelity National Information Services, Inc. | 0.04 | 0.00 | 3.61 | 9.02 | 0.0892 | 0.0090 | |||
| CRM / Salesforce, Inc. | 0.01 | 0.00 | 3.60 | 1.64 | 0.0888 | 0.0031 | |||
| AMD / Advanced Micro Devices, Inc. | 0.03 | -21.13 | 3.58 | 8.93 | 0.0882 | 0.0088 | |||
| HD / The Home Depot, Inc. | 0.01 | -14.40 | 3.55 | -14.38 | 0.0876 | -0.0127 | |||
| XOM / Exxon Mobil Corporation | 0.03 | -0.17 | 3.54 | -9.52 | 0.0873 | -0.0073 | |||
| OTIS / Otis Worldwide Corporation | 0.04 | 0.00 | 3.50 | -4.06 | 0.0864 | -0.0019 | |||
| SO / The Southern Company | 0.04 | 3.48 | 0.0859 | 0.0859 | |||||
| APO / Apollo Global Management, Inc. | 0.02 | -10.00 | 3.47 | -6.77 | 0.0857 | -0.0044 | |||
| VRTX / Vertex Pharmaceuticals Incorporated | 0.01 | -9.93 | 3.45 | -17.31 | 0.0852 | -0.0158 | |||
| ANET / Arista Networks Inc | 0.03 | 0.00 | 3.39 | 32.09 | 0.0836 | 0.0215 | |||
| APG / APi Group Corporation | 0.07 | -36.38 | 3.39 | -9.17 | 0.0836 | -0.0067 | |||
| NWS / News Corporation | 0.10 | -10.76 | 3.36 | 0.81 | 0.0830 | 0.0023 | |||
| DUK / Duke Energy Corporation | 0.03 | 3.35 | 0.0827 | 0.0827 | |||||
| TW / Tradeweb Markets Inc. | 0.02 | -10.46 | 3.34 | -11.71 | 0.0825 | -0.0091 | |||
| ACT / Enact Holdings, Inc. | 0.09 | -49.21 | 3.34 | -45.71 | 0.0824 | -0.0664 | |||
| GSCE / GS Connect S&P GSCI Enhanced Commodity Total Return ETN | 0.00 | -6.04 | 3.25 | 21.72 | 0.0802 | 0.0156 | |||
| ALL / The Allstate Corporation | 0.02 | -0.11 | 3.24 | -2.90 | 0.0801 | -0.0008 | |||
| NVT / nVent Electric plc | 0.04 | 0.00 | 3.24 | 39.77 | 0.0801 | 0.0239 | |||
| COF / Capital One Financial Corporation | 0.02 | 0.00 | 3.23 | 18.68 | 0.0796 | 0.0138 | |||
| TPG / TPG Inc. | 0.06 | 0.00 | 3.22 | 10.60 | 0.0795 | 0.0090 | |||
| ITW / Illinois Tool Works Inc. | 0.01 | 0.00 | 3.21 | -0.31 | 0.0792 | 0.0013 | |||
| DAL / Delta Air Lines, Inc. | 0.07 | -7.57 | 3.20 | 4.23 | 0.0790 | 0.0047 | |||
| PYPL / PayPal Holdings, Inc. | 0.04 | -6.40 | 3.17 | 6.64 | 0.0781 | 0.0063 | |||
| V / Visa Inc. | 0.01 | -10.56 | 3.15 | -9.38 | 0.0777 | -0.0064 | |||
| BMY / Bristol-Myers Squibb Company | 0.07 | -11.54 | 3.09 | -32.87 | 0.0763 | -0.0351 | |||
| LMT / Lockheed Martin Corporation | 0.01 | -0.04 | 3.09 | 3.62 | 0.0763 | 0.0041 | |||
| MRK / Merck & Co., Inc. | 0.04 | 0.00 | 3.09 | -11.83 | 0.0762 | -0.0085 | |||
| ZBH / Zimmer Biomet Holdings, Inc. | 0.03 | 0.00 | 3.07 | -19.42 | 0.0759 | -0.0164 | |||
| ADP / Automatic Data Processing, Inc. | 0.01 | 0.00 | 3.05 | 0.96 | 0.0753 | 0.0022 | |||
| LHX / L3Harris Technologies, Inc. | 0.01 | 0.00 | 3.01 | 19.85 | 0.0744 | 0.0135 | |||
| XYZ / Block, Inc. | 0.04 | 0.00 | 3.01 | 25.00 | 0.0743 | 0.0160 | |||
| FTV / Fortive Corporation | 0.06 | 0.00 | 2.99 | -28.77 | 0.0738 | -0.0278 | |||
| D / Dominion Energy, Inc. | 0.05 | 2.98 | 0.0734 | 0.0734 | |||||
| URI / United Rentals, Inc. | 0.00 | 0.00 | 2.95 | 20.23 | 0.0729 | 0.0134 | |||
| HON / Honeywell International Inc. | 0.01 | -10.17 | 2.95 | -1.20 | 0.0729 | 0.0005 | |||
| MU / Micron Technology, Inc. | 0.02 | 0.00 | 2.92 | 41.87 | 0.0722 | 0.0223 | |||
| ARES / Ares Management Corporation | 0.02 | -11.45 | 2.92 | 4.62 | 0.0721 | 0.0045 | |||
| GLW / Corning Incorporated | 0.05 | 0.00 | 2.89 | 14.87 | 0.0713 | 0.0104 | |||
| PFE / Pfizer Inc. | 0.12 | 0.00 | 2.86 | -4.36 | 0.0705 | -0.0018 | |||
| EQIX / Equinix, Inc. | 0.00 | 0.00 | 2.79 | -2.45 | 0.0689 | -0.0004 | |||
| EIX / Edison International | 0.05 | 0.00 | 2.76 | -12.41 | 0.0681 | -0.0082 | |||
| SYY / Sysco Corporation | 0.04 | 2.73 | 0.0674 | 0.0674 | |||||
| UHALB / U-Haul Holding Company - Series N | 0.05 | 0.00 | 2.71 | -8.12 | 0.0670 | -0.0045 | |||
| TEAM / Atlassian Corporation | 0.01 | -6.50 | 2.71 | -10.52 | 0.0669 | -0.0064 | |||
| TRGP / Targa Resources Corp. | 0.02 | 0.00 | 2.70 | -13.19 | 0.0666 | -0.0086 | |||
| UNP / Union Pacific Corporation | 0.01 | 0.00 | 2.68 | -2.62 | 0.0661 | -0.0005 | |||
| PEG / Public Service Enterprise Group Incorporated | 0.03 | 2.67 | 0.0658 | 0.0658 | |||||
| CVS / CVS Health Corporation | 0.04 | 2.62 | 0.0646 | 0.0646 | |||||
| OWL / Blue Owl Capital Inc. | 0.14 | 0.00 | 2.61 | -4.12 | 0.0644 | -0.0015 | |||
| NEE / NextEra Energy, Inc. | 0.04 | 2.61 | 0.0643 | 0.0643 | |||||
| PRU / Prudential Financial, Inc. | 0.02 | -6.92 | 2.60 | -10.46 | 0.0642 | -0.0061 | |||
| TSN / Tyson Foods, Inc. | 0.05 | 2.55 | 0.0630 | 0.0630 | |||||
| CSX / CSX Corporation | 0.08 | -8.19 | 2.55 | 1.80 | 0.0628 | 0.0023 | |||
| SRE / Sempra | 0.03 | 2.54 | 0.0626 | 0.0626 | |||||
| DOW / Dow Inc. | 0.10 | 0.00 | 2.53 | -24.17 | 0.0625 | -0.0183 | |||
| CB / Chubb Limited | 0.01 | 2.53 | 0.0624 | 0.0624 | |||||
| ABNB / Airbnb, Inc. | 0.02 | 0.00 | 2.53 | 10.78 | 0.0624 | 0.0072 | |||
| F / Ford Motor Company | 0.23 | 0.00 | 2.52 | 8.15 | 0.0622 | 0.0058 | |||
| WDC / Western Digital Corporation | 0.04 | 0.00 | 2.51 | 58.31 | 0.0620 | 0.0236 | |||
| CI / The Cigna Group | 0.01 | 2.50 | 0.0618 | 0.0618 | |||||
| IR / Ingersoll Rand Inc. | 0.03 | -7.27 | 2.50 | -3.63 | 0.0617 | -0.0011 | |||
| KR / The Kroger Co. | 0.03 | 2.48 | 0.0613 | 0.0613 | |||||
| ACGL / Arch Capital Group Ltd. | 0.03 | 2.46 | 0.0606 | 0.0606 | |||||
| PGR / The Progressive Corporation | 0.01 | 2.41 | 0.0595 | 0.0595 | |||||
| MRVL / Marvell Technology, Inc. | 0.03 | -9.47 | 2.40 | 13.78 | 0.0593 | 0.0082 | |||
| CNP / CenterPoint Energy, Inc. | 0.06 | 2.38 | 0.0587 | 0.0587 | |||||
| SNDR / Schneider National, Inc. | 0.10 | 0.00 | 2.34 | 5.65 | 0.0577 | 0.0042 | |||
| BDX / Becton, Dickinson and Company | 0.01 | 0.00 | 2.27 | -24.81 | 0.0560 | -0.0170 | |||
| PLD / Prologis, Inc. | 0.02 | -0.11 | 2.12 | -6.04 | 0.0522 | -0.0023 | |||
| REGN / Regeneron Pharmaceuticals, Inc. | 0.00 | 0.00 | 1.98 | -17.23 | 0.0488 | -0.0090 | |||
| IQV / IQVIA Holdings Inc. | 0.01 | 0.00 | 1.93 | -10.61 | 0.0476 | -0.0046 | |||
| ADBE / Adobe Inc. | 0.00 | 0.00 | 1.91 | 0.85 | 0.0471 | 0.0013 | |||
| O / Realty Income Corporation | 0.03 | 0.00 | 1.87 | -0.64 | 0.0461 | 0.0006 | |||
| HPQ / HP Inc. | 0.07 | 0.00 | 1.73 | -11.67 | 0.0428 | -0.0047 | |||
| FDX / FedEx Corporation | 0.01 | 0.00 | 1.71 | -6.76 | 0.0422 | -0.0022 | |||
| GFS / GLOBALFOUNDRIES Inc. | 0.04 | -16.01 | 1.55 | -13.08 | 0.0382 | -0.0049 | |||
| UPS / United Parcel Service, Inc. | 0.01 | 0.00 | 1.43 | -8.29 | 0.0353 | -0.0024 | |||
| GLDM / World Gold Trust - SPDR Gold MiniShares Trust | 0.02 | -7.08 | 1.39 | -1.63 | 0.0342 | 0.0001 | |||
| AGG / iShares Trust - iShares Core U.S. Aggregate Bond ETF | 0.01 | 91.82 | 0.93 | 92.32 | 0.0229 | 0.0112 | |||
| RAL / Ralliant Corporation | 0.02 | 0.93 | 0.0229 | 0.0229 | |||||
| AOR / iShares Trust - iShares Core 60/40 Balanced Allocation ETF | 0.01 | -90.86 | 0.61 | -90.23 | 0.0151 | -0.1360 | |||
| VT / Vanguard International Equity Index Funds - Vanguard Total World Stock ETF | 0.00 | -82.17 | 0.58 | -80.26 | 0.0144 | -0.0570 | |||
| RSPT / Invesco Exchange-Traded Fund Trust - Invesco S&P 500 Equal Weight Technology ETF | 0.01 | -39.54 | 0.45 | -27.97 | 0.0111 | -0.0040 | |||
| SPSM / SPDR Series Trust - SPDR Portfolio S&P 600 Small Cap ETF | 0.01 | -99.58 | 0.31 | -99.56 | 0.0075 | -1.6575 | |||
| VGK / Vanguard International Equity Index Funds - Vanguard FTSE Europe ETF | 0.00 | -28.18 | 0.18 | -20.80 | 0.0044 | -0.0010 | |||
| EAOR / iShares Trust - iShares ESG Aware 60/40 Balanced Allocation ETF | 0.00 | 124.84 | 0.15 | 139.68 | 0.0037 | 0.0022 | |||
| EZU / iShares, Inc. - iShares MSCI Eurozone ETF | 0.00 | -64.00 | 0.14 | -59.88 | 0.0034 | -0.0049 | |||
| ACWI / iShares Trust - iShares MSCI ACWI ETF | 0.00 | 51.47 | 0.09 | 66.67 | 0.0021 | 0.0009 | |||
| MCHI / iShares Trust - iShares MSCI China ETF | 0.00 | -73.08 | 0.06 | -72.96 | 0.0016 | -0.0041 | |||
| KXI / iShares Trust - iShares Global Consumer Staples ETF | 0.00 | -60.39 | 0.05 | -59.69 | 0.0013 | -0.0018 | |||
| BBCA / J.P. Morgan Exchange-Traded Fund Trust - JPMorgan BetaBuilders Canada ETF | 0.00 | -62.48 | 0.05 | -57.63 | 0.0012 | -0.0016 | |||
| RSPD / Invesco Exchange-Traded Fund Trust - Invesco S&P 500 Equal Weight Consumer Discretionary ETF | 0.00 | -50.89 | 0.04 | -48.19 | 0.0011 | -0.0009 | |||
| XLK / The Select Sector SPDR Trust - The Technology Select Sector SPDR Fund | 0.00 | -42.55 | 0.02 | -31.03 | 0.0005 | -0.0002 | |||
| ACWV / iShares, Inc. - iShares MSCI Global Min Vol Factor ETF | 0.00 | 97.44 | 0.02 | 100.00 | 0.0005 | 0.0002 | |||
| BBJP / J.P. Morgan Exchange-Traded Fund Trust - JPMorgan BetaBuilders Japan ETF | 0.00 | -38.70 | 0.02 | -30.77 | 0.0004 | -0.0002 | |||
| JAAA / Janus Detroit Street Trust - Janus Henderson AAA CLO ETF | 0.00 | -91.68 | 0.01 | -92.05 | 0.0004 | -0.0039 | |||
| XLE / The Select Sector SPDR Trust - The Energy Select Sector SPDR Fund | 0.00 | -94.69 | 0.01 | -95.63 | 0.0002 | -0.0042 | |||
| IVOL / KraneShares Trust - Quadratic Interest Rate Volatility and Inflation Hedge ETF | 0.00 | -99.99 | 0.01 | -99.99 | 0.0002 | -1.4736 | |||
| AOM / iShares Trust - iShares Core 40/60 Moderate Allocation ETF | 0.00 | 1,325.00 | 0.00 | 0.0001 | 0.0001 | ||||
| BIL / SPDR Series Trust - SPDR Bloomberg 1-3 Month T-Bill ETF | 0.00 | -98.18 | 0.00 | -98.67 | 0.0000 | -0.0018 | |||
| MBB / iShares Trust - iShares MBS ETF | 0.00 | -9.09 | 0.00 | 0.00 | 0.0000 | 0.0000 | |||
| XLV / The Select Sector SPDR Trust - The Health Care Select Sector SPDR Fund | 0.00 | -87.50 | 0.00 | -100.00 | 0.0000 | -0.0002 | |||
| IXG / iShares Trust - iShares Global Financials ETF | 0.00 | 0.00 | 0.00 | 0.0000 | 0.0000 | ||||
| FHB / First Hawaiian, Inc. | 0.00 | -100.00 | 0.00 | 0.0000 | |||||
| FBK / FB Financial Corporation | 0.00 | -100.00 | 0.00 | 0.0000 | |||||
| RYAN / Ryan Specialty Holdings, Inc. | 0.00 | -100.00 | 0.00 | 0.0000 | |||||
| IBP / Installed Building Products, Inc. | 0.00 | -100.00 | 0.00 | 0.0000 | |||||
| TOST / Toast, Inc. | 0.00 | -100.00 | 0.00 | 0.0000 | |||||
| PJT / PJT Partners Inc. | 0.00 | -100.00 | 0.00 | 0.0000 | |||||
| EBC / Eastern Bankshares, Inc. | 0.00 | -100.00 | 0.00 | 0.0000 | |||||
| VCTR / Victory Capital Holdings, Inc. | 0.00 | -100.00 | 0.00 | 0.0000 | |||||
| REZI / Resideo Technologies, Inc. | 0.00 | -100.00 | 0.00 | 0.0000 | |||||
| ALRM / Alarm.com Holdings, Inc. | 0.00 | -100.00 | 0.00 | 0.0000 | |||||
| DTM / DT Midstream, Inc. | 0.00 | -100.00 | 0.00 | 0.0000 | |||||
| BHF / Brighthouse Financial, Inc. | 0.00 | -100.00 | 0.00 | 0.0000 | |||||
| ASIX / AdvanSix Inc. | 0.00 | -100.00 | 0.00 | 0.0000 | |||||
| JXN / Jackson Financial Inc. | 0.00 | -100.00 | 0.00 | 0.0000 | |||||
| SLM / SLM Corporation | 0.00 | -100.00 | 0.00 | 0.0000 | |||||
| SYF / Synchrony Financial | 0.00 | -100.00 | 0.00 | 0.0000 | |||||
| CSWI / CSW Industrials, Inc. | 0.00 | -100.00 | 0.00 | 0.0000 | |||||
| MGY / Magnolia Oil & Gas Corporation | 0.00 | -100.00 | 0.00 | 0.0000 | |||||
| MC / Moelis & Company | 0.00 | -100.00 | 0.00 | 0.0000 | |||||
| CFG / Citizens Financial Group, Inc. | 0.00 | -100.00 | 0.00 | 0.0000 | |||||
| VRRM / Verra Mobility Corporation | 0.00 | -100.00 | 0.00 | 0.0000 | |||||
| HPE / Hewlett Packard Enterprise Company | 0.00 | -100.00 | 0.00 | 0.0000 | |||||
| PSTG / Pure Storage, Inc. | 0.00 | -100.00 | 0.00 | 0.0000 | |||||
| GMS / GMS Inc. | 0.00 | -100.00 | 0.00 | 0.0000 | |||||
| NTAP / NetApp, Inc. | 0.00 | -100.00 | 0.00 | 0.0000 | |||||
| SAIC / Science Applications International Corporation | 0.00 | -100.00 | 0.00 | 0.0000 | |||||
| VIRT / Virtu Financial, Inc. | 0.00 | -100.00 | 0.00 | 0.0000 | |||||
| AXS / AXIS Capital Holdings Limited | 0.00 | -100.00 | 0.00 | 0.0000 | |||||
| FCPT / Four Corners Property Trust, Inc. | 0.00 | -100.00 | 0.00 | 0.0000 | |||||
| AAMI / Acadian Asset Management Inc. | 0.00 | -100.00 | 0.00 | 0.0000 | |||||
| JBBB / Janus Detroit Street Trust - Janus Henderson B-BBB CLO ETF | 0.00 | -100.00 | 0.00 | 0.0000 | |||||
| KN / Knowles Corporation | 0.00 | -100.00 | 0.00 | 0.0000 | |||||
| PSN / Parsons Corporation | 0.00 | -100.00 | 0.00 | 0.0000 | |||||
| TPH / Tri Pointe Homes, Inc. | 0.00 | -100.00 | 0.00 | 0.0000 | |||||
| VBTX / Veritex Holdings, Inc. | 0.00 | -100.00 | 0.00 | 0.0000 | |||||
| STEL / Stellar Bancorp, Inc. | 0.00 | -100.00 | 0.00 | -100.00 | -0.0764 | ||||
| JEF / Jefferies Financial Group Inc. | 0.00 | -100.00 | 0.00 | 0.0000 | |||||
| MCHP / Microchip Technology Incorporated | 0.00 | -100.00 | 0.00 | 0.0000 |