Statistik Asas
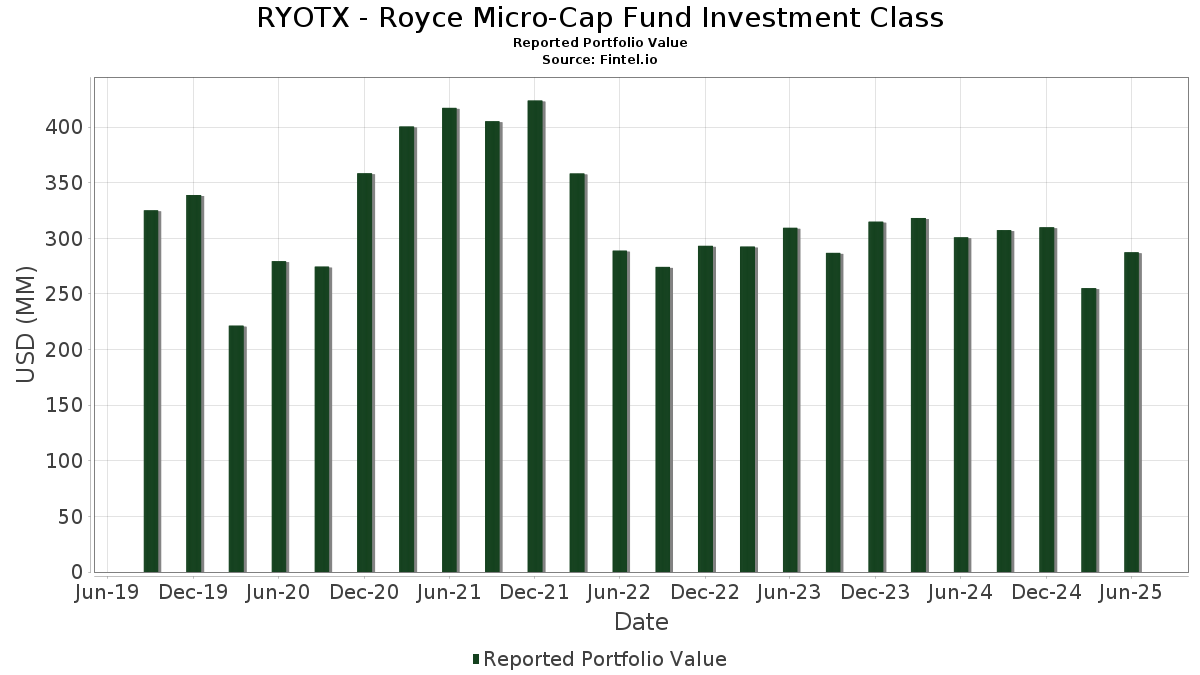
| Nilai Portfolio | $ 287,387,408 |
| Kedudukan Semasa | 154 |
Pegangan Terkini, Prestasi, AUM (dari 13F, 13D)
RYOTX - Royce Micro-Cap Fund Investment Class telah mendedahkan 154 jumlah pegangan dalam pemfailan SEC terkini mereka. Nilai portfolio terkini dikira sebagai $ 287,387,408 USD. Aset Sebenar Di Bawah Pengurusan (AUM) ialah nilai ini ditambah dengan tunai (yang tidak didedahkan). Pegangan teratas RYOTX - Royce Micro-Cap Fund Investment Class ialah Federated Hermes Money Market Obligations Trust - Federated Hermes Gov Oblig Fd Ser Shs USD (US:GOSXX) , Magnite, Inc. (US:MGNI) , Bel Fuse Inc. (US:BELFB) , American Superconductor Corporation (US:AMSC) , and Sprott Inc. (US:SII) . Kedudukan baharu RYOTX - Royce Micro-Cap Fund Investment Class termasuk Coastal Financial Corporation (US:CCB) , Cytek Biosciences, Inc. (US:CTKB) , Hingham Institution for Savings (US:HIFS) , Alpha and Omega Semiconductor Limited (US:AOSL) , and 5N Plus Inc. (US:FPLSF) .
Kenaikan Teratas Suku Tahun Ini
Kami menggunakan perubahan dalam peruntukan portfolio kerana ini adalah metrik yang paling bermakna. Perubahan boleh disebabkan oleh perdagangan atau perubahan dalam harga saham.
| Sekuriti | Saham (MM) |
Nilai (MM$) |
Portfolio % | ΔPortfolio % |
|---|---|---|---|---|
| 4.10 | 1.4550 | 1.4550 | ||
| 5.34 | 5.34 | 1.8955 | 1.2203 | |
| 0.02 | 1.86 | 0.6607 | 0.6607 | |
| 0.02 | 2.96 | 1.0514 | 0.6056 | |
| 0.16 | 3.90 | 1.3832 | 0.5920 | |
| 0.10 | 3.60 | 1.2788 | 0.5161 | |
| 0.38 | 1.29 | 0.4592 | 0.4592 | |
| 0.09 | 1.43 | 0.5090 | 0.4100 | |
| 0.12 | 2.62 | 0.9301 | 0.4089 | |
| 0.00 | 1.09 | 0.3880 | 0.3880 |
Penurunan Teratas Suku Tahun Ini
Kami menggunakan perubahan dalam peruntukan portfolio kerana ini adalah metrik yang paling bermakna. Perubahan boleh disebabkan oleh perdagangan atau perubahan dalam harga saham.
| Sekuriti | Saham (MM) |
Nilai (MM$) |
Portfolio % | ΔPortfolio % |
|---|---|---|---|---|
| 0.02 | 0.45 | 0.1581 | -0.7852 | |
| 0.02 | 1.60 | 0.5665 | -0.4440 | |
| 0.02 | 1.78 | 0.6311 | -0.4247 | |
| 0.01 | 0.11 | 0.0395 | -0.3980 | |
| 0.01 | 1.94 | 0.6875 | -0.3977 | |
| 0.10 | 2.20 | 0.7793 | -0.3934 | |
| 0.10 | 2.73 | 0.9694 | -0.3438 | |
| 0.09 | 2.10 | 0.7463 | -0.3161 | |
| 0.48 | 2.05 | 0.7278 | -0.3007 | |
| 0.10 | 2.29 | 0.8138 | -0.2940 |
13F dan Pemfailan Dana
Borang ini telah difailkan pada 2025-08-15 untuk tempoh pelaporan 2025-06-30. Klik ikon pautan untuk melihat sejarah transaksi penuh.
Tingkatkan untuk membuka data premium dan eksport ke Excel ![]() .
.
| Sekuriti | Jenis | Purata Harga Saham | Saham (MM) |
ΔSaham (%) |
ΔSaham (%) |
Nilai ($MM) |
Portfolio (%) |
ΔPortfolio (%) |
|
|---|---|---|---|---|---|---|---|---|---|
| GOSXX / Federated Hermes Money Market Obligations Trust - Federated Hermes Gov Oblig Fd Ser Shs USD | 5.34 | 212.39 | 5.34 | 212.52 | 1.8955 | 1.2203 | |||
| FIXED INC CLEARING CORP.REPO / RA (000000000) | 4.10 | 1.4550 | 1.4550 | ||||||
| MGNI / Magnite, Inc. | 0.16 | -7.97 | 3.90 | 94.56 | 1.3832 | 0.5920 | |||
| BELFB / Bel Fuse Inc. | 0.04 | -2.56 | 3.72 | 27.15 | 1.3201 | 0.1647 | |||
| AMSC / American Superconductor Corporation | 0.10 | -7.74 | 3.60 | 86.59 | 1.2788 | 0.5161 | |||
| SII / Sprott Inc. | 0.05 | -24.77 | 3.56 | 16.10 | 1.2620 | 0.0521 | |||
| GHM / Graham Corporation | 0.07 | -12.59 | 3.48 | 50.22 | 1.2336 | 0.3194 | |||
| NGS / Natural Gas Services Group, Inc. | 0.13 | -3.21 | 3.35 | 13.72 | 1.1884 | 0.0253 | |||
| DGII / Digi International Inc. | 0.09 | -2.08 | 3.28 | 22.63 | 1.1658 | 0.1080 | |||
| CECO / CECO Environmental Corp. | 0.11 | -10.38 | 3.20 | 11.28 | 1.1342 | -0.0001 | |||
| LINC / Lincoln Educational Services Corporation | 0.14 | -25.16 | 3.17 | 8.73 | 1.1232 | -0.0268 | |||
| NPKI / NPK International Inc. | 0.37 | -25.69 | 3.16 | 8.82 | 1.1207 | -0.0253 | |||
| CLFD / Clearfield, Inc. | 0.07 | 0.00 | 3.14 | 46.03 | 1.1161 | 0.2657 | |||
| HBT / HBT Financial, Inc. | 0.12 | -5.54 | 3.09 | 6.26 | 1.0964 | -0.0518 | |||
| NVMI / Nova Ltd. | 0.01 | -8.49 | 3.06 | 36.57 | 1.0870 | 0.2015 | |||
| PAR / PAR Technology Corporation | 0.04 | -2.10 | 3.03 | 10.70 | 1.0762 | -0.0056 | |||
| BCML / BayCom Corp | 0.11 | -2.69 | 3.01 | 7.13 | 1.0671 | -0.0414 | |||
| ESTA / Establishment Labs Holdings Inc. | 0.07 | 27.15 | 2.99 | 33.13 | 1.0612 | 0.1738 | |||
| LASR / nLIGHT, Inc. | 0.15 | -45.68 | 2.99 | 37.56 | 1.0597 | 0.2025 | |||
| LGCY / Legacy Education Inc. | 0.27 | -1.30 | 2.96 | 53.89 | 1.0521 | 0.2913 | |||
| LMB / Limbach Holdings, Inc. | 0.02 | 39.50 | 2.96 | 162.59 | 1.0514 | 0.6056 | |||
| ICHR / Ichor Holdings, Ltd. | 0.15 | 57.58 | 2.93 | 36.86 | 1.0411 | 0.1946 | |||
| CTRN / Citi Trends, Inc. | 0.09 | -30.79 | 2.90 | 4.42 | 1.0306 | -0.0679 | |||
| IESC / IES Holdings, Inc. | 0.01 | -5.28 | 2.90 | 69.91 | 1.0284 | 0.3549 | |||
| CCORF / Canaccord Genuity Group Inc. | 0.38 | -2.56 | 2.89 | 26.82 | 1.0274 | 0.1260 | |||
| ACU / Acme United Corporation | 0.07 | -4.10 | 2.85 | 0.35 | 1.0125 | -0.1104 | |||
| CRY / Artivion Inc | 0.09 | 0.00 | 2.85 | 26.54 | 1.0120 | 0.1219 | |||
| LIND / Lindblad Expeditions Holdings, Inc. | 0.24 | -9.08 | 2.83 | 14.46 | 1.0058 | 0.0279 | |||
| HTB / HomeTrust Bancshares, Inc. | 0.08 | -2.59 | 2.81 | 6.31 | 0.9989 | -0.0468 | |||
| SENEA / Seneca Foods Corporation | 0.03 | -15.41 | 2.80 | -3.64 | 0.9953 | -0.1542 | |||
| NWPX / NWPX Infrastructure, Inc. | 0.07 | 6.19 | 2.80 | 5.43 | 0.9932 | -0.0550 | |||
| ISTR / Investar Holding Corporation | 0.14 | -2.69 | 2.79 | 6.77 | 0.9914 | -0.0421 | |||
| IMAX / IMAX Corporation | 0.10 | -22.58 | 2.73 | -17.84 | 0.9694 | -0.3438 | |||
| ATRO / Astronics Corporation | 0.08 | -30.74 | 2.68 | -4.09 | 0.9496 | -0.1520 | |||
| STEL / Stellar Bancorp, Inc. | 0.10 | 0.00 | 2.67 | 1.14 | 0.9471 | -0.0949 | |||
| MJDLF / Major Drilling Group International Inc. | 0.41 | -15.85 | 2.66 | -1.73 | 0.9455 | -0.1255 | |||
| CUBI / Customers Bancorp, Inc. | 0.04 | 0.00 | 2.64 | 17.03 | 0.9366 | 0.0458 | |||
| WNEB / Western New England Bancorp, Inc. | 0.29 | 0.00 | 2.63 | -0.75 | 0.9337 | -0.1133 | |||
| MEG / Montrose Environmental Group, Inc. | 0.12 | 29.38 | 2.62 | 98.64 | 0.9301 | 0.4089 | |||
| IGIC / International General Insurance Holdings Ltd. | 0.11 | 89.41 | 2.60 | 72.95 | 0.9213 | 0.3284 | |||
| AOUT / American Outdoor Brands, Inc. | 0.25 | 0.00 | 2.58 | -14.07 | 0.9173 | -0.2706 | |||
| TRNS / Transcat, Inc. | 0.03 | -17.57 | 2.56 | -4.84 | 0.9073 | -0.1537 | |||
| AAOI / Applied Optoelectronics, Inc. | 0.10 | 9.44 | 2.49 | 83.16 | 0.8841 | 0.3469 | |||
| LPTH / LightPath Technologies, Inc. | 0.81 | 0.00 | 2.49 | 53.23 | 0.8837 | 0.2419 | |||
| LXFR / Luxfer Holdings PLC | 0.20 | 0.21 | 2.48 | 2.91 | 0.8787 | -0.0716 | |||
| SAMG / Silvercrest Asset Management Group Inc. | 0.16 | -2.58 | 2.46 | -5.53 | 0.8727 | -0.1557 | |||
| DSGR / Distribution Solutions Group, Inc. | 0.09 | 0.00 | 2.45 | -1.88 | 0.8697 | -0.1169 | |||
| NVEC / NVE Corporation | 0.03 | -5.56 | 2.37 | 9.05 | 0.8423 | -0.0172 | |||
| CDNA / CareDx, Inc | 0.12 | 0.00 | 2.36 | 10.08 | 0.8373 | -0.0092 | |||
| SHYF / The Shyft Group, Inc. | 0.19 | 0.00 | 2.35 | 54.98 | 0.8345 | 0.2354 | |||
| ARLO / Arlo Technologies, Inc. | 0.14 | -44.45 | 2.33 | -4.56 | 0.8253 | -0.1369 | |||
| LEGH / Legacy Housing Corporation | 0.10 | -9.01 | 2.29 | -18.25 | 0.8138 | -0.2940 | |||
| PKE / Park Aerospace Corp. | 0.15 | 0.00 | 2.27 | 9.81 | 0.8065 | -0.0108 | |||
| VPG / Vishay Precision Group, Inc. | 0.08 | -3.36 | 2.26 | 12.71 | 0.8026 | 0.0102 | |||
| QNST / QuinStreet, Inc. | 0.14 | -4.62 | 2.23 | -13.91 | 0.7908 | -0.2316 | |||
| KOPN / Kopin Corporation | 1.44 | 0.00 | 2.20 | 64.13 | 0.7814 | 0.2516 | |||
| BLFS / BioLife Solutions, Inc. | 0.10 | -21.58 | 2.20 | -26.04 | 0.7793 | -0.3934 | |||
| EZPW / EZCORP, Inc. | 0.16 | -4.09 | 2.18 | -9.58 | 0.7743 | -0.1785 | |||
| ATUSF / Altius Minerals Corporation | 0.11 | 0.00 | 2.13 | 16.87 | 0.7575 | 0.0361 | |||
| LQDT / Liquidity Services, Inc. | 0.09 | 2.77 | 2.10 | -21.79 | 0.7463 | -0.3161 | |||
| CVLG / Covenant Logistics Group, Inc. | 0.09 | 0.00 | 2.06 | 8.64 | 0.7322 | -0.0181 | |||
| RELL / Richardson Electronics, Ltd. | 0.21 | 22.59 | 2.06 | 6.02 | 0.7318 | -0.0365 | |||
| AIOT / PowerFleet, Inc. | 0.48 | 0.31 | 2.05 | -21.27 | 0.7278 | -0.3007 | |||
| HROW / Harrow, Inc. | 0.07 | 0.00 | 2.01 | 14.82 | 0.7125 | 0.0219 | |||
| CASS / Cass Information Systems, Inc. | 0.05 | -9.64 | 2.00 | -9.25 | 0.7103 | -0.1605 | |||
| NX / Quanex Building Products Corporation | 0.11 | -2.76 | 2.00 | -1.14 | 0.7086 | -0.0891 | |||
| AMN / AMN Healthcare Services, Inc. | 0.10 | 52.99 | 1.98 | 29.34 | 0.7043 | 0.0980 | |||
| CKNHF / Clarkson PLC | 0.04 | -16.90 | 1.97 | -15.38 | 0.6993 | -0.2203 | |||
| COHU / Cohu, Inc. | 0.10 | 23.10 | 1.95 | 60.97 | 0.6926 | 0.2139 | |||
| ADTN / ADTRAN Holdings, Inc. | 0.22 | 54.75 | 1.94 | 59.26 | 0.6897 | 0.2075 | |||
| VSEC / VSE Corporation | 0.01 | -35.41 | 1.94 | -29.49 | 0.6875 | -0.3977 | |||
| LNN / Lindsay Corporation | 0.01 | 9.46 | 1.89 | 64.55 | 0.6724 | 0.3312 | |||
| NBN / Northeast Bank | 0.02 | 32.70 | 1.89 | 28.98 | 0.6698 | 0.0920 | |||
| CCB / Coastal Financial Corporation | 0.02 | 1.86 | 0.6607 | 0.6607 | |||||
| CAMT / Camtek Ltd. | 0.02 | 0.00 | 1.85 | 44.17 | 0.6583 | 0.1503 | |||
| UCTT / Ultra Clean Holdings, Inc. | 0.08 | 11.46 | 1.85 | 17.50 | 0.6578 | 0.0348 | |||
| ALOT / AstroNova, Inc. | 0.16 | 0.00 | 1.83 | 26.12 | 0.6497 | 0.0764 | |||
| OPY / Oppenheimer Holdings Inc. | 0.03 | 15.14 | 1.83 | 27.01 | 0.6492 | 0.0803 | |||
| CLMB / Climb Global Solutions, Inc. | 0.02 | 0.00 | 1.83 | -3.49 | 0.6483 | -0.0992 | |||
| SNEX / StoneX Group Inc. | 0.02 | -44.25 | 1.78 | -33.48 | 0.6311 | -0.4247 | |||
| PVARF / Porvair plc | 0.17 | 0.00 | 1.69 | 12.24 | 0.5988 | 0.0051 | |||
| HLIT / Harmonic Inc. | 0.18 | -2.73 | 1.68 | -3.99 | 0.5980 | -0.0949 | |||
| INTT / inTEST Corporation | 0.22 | 0.00 | 1.61 | 4.15 | 0.5699 | -0.0391 | |||
| BBCP / Concrete Pumping Holdings, Inc. | 0.26 | 0.00 | 1.60 | 12.62 | 0.5670 | 0.0068 | |||
| MLAB / Mesa Laboratories, Inc. | 0.02 | -21.42 | 1.60 | -37.61 | 0.5665 | -0.4440 | |||
| MOD / Modine Manufacturing Company | 0.02 | 0.00 | 1.57 | 28.29 | 0.5572 | 0.0740 | |||
| PSYTF / Pason Systems Inc. | 0.17 | -25.22 | 1.56 | 69.87 | 0.5523 | 0.2164 | |||
| KFRC / Kforce Inc. | 0.04 | 0.00 | 1.56 | -15.90 | 0.5521 | -0.1782 | |||
| RNGR / Ranger Energy Services, Inc. | 0.13 | -5.04 | 1.55 | -20.12 | 0.5511 | -0.2164 | |||
| GSM / Ferroglobe PLC | 0.41 | 0.00 | 1.51 | -1.11 | 0.5376 | -0.0672 | |||
| MCFT / MasterCraft Boat Holdings, Inc. | 0.08 | 0.00 | 1.50 | 7.94 | 0.5306 | -0.0167 | |||
| FRPH / FRP Holdings, Inc. | 0.05 | 0.00 | 1.45 | -5.90 | 0.5156 | -0.0941 | |||
| AMRC / Ameresco, Inc. | 0.09 | 354.63 | 1.43 | 473.60 | 0.5090 | 0.4100 | |||
| VMEO / Vimeo, Inc. | 0.35 | 23.93 | 1.43 | -4.80 | 0.5069 | -0.0858 | |||
| BYON / Beyond, Inc. | 0.21 | 19.27 | 1.42 | 41.45 | 0.5053 | 0.1078 | |||
| TITN / Titan Machinery Inc. | 0.07 | 25.62 | 1.41 | 46.11 | 0.5004 | 0.1191 | |||
| HOV / Hovnanian Enterprises, Inc. | 0.01 | 0.00 | 1.40 | -0.14 | 0.4977 | -0.0570 | |||
| PRO / PROS Holdings, Inc. | 0.09 | 20.37 | 1.40 | -0.92 | 0.4956 | -0.0612 | |||
| ONEW / OneWater Marine Inc. | 0.10 | 2.23 | 1.39 | -15.40 | 0.4933 | -0.1556 | |||
| PROF / Profound Medical Corp. | 0.23 | 0.00 | 1.39 | 4.28 | 0.4928 | -0.0332 | |||
| WNC / Wabash National Corporation | 0.13 | 0.00 | 1.38 | -3.83 | 0.4904 | -0.0769 | |||
| SLP / Simulations Plus, Inc. | 0.08 | 4.34 | 1.35 | -25.72 | 0.4788 | -0.2388 | |||
| TWI / Titan International, Inc. | 0.13 | 15.53 | 1.35 | 41.49 | 0.4782 | 0.1019 | |||
| APYX / Apyx Medical Corporation | 0.59 | 0.00 | 1.33 | 64.32 | 0.4724 | 0.1523 | |||
| EVI / EVI Industries, Inc. | 0.06 | 26.32 | 1.30 | 64.39 | 0.4624 | 0.1493 | |||
| CMT / Core Molding Technologies, Inc. | 0.08 | 0.00 | 1.30 | 9.15 | 0.4616 | -0.0091 | |||
| CTKB / Cytek Biosciences, Inc. | 0.38 | 1.29 | 0.4592 | 0.4592 | |||||
| PENG / Penguin Solutions, Inc. | 0.06 | 52.40 | 1.28 | 73.85 | 0.4554 | 0.1638 | |||
| MMI / Marcus & Millichap, Inc. | 0.04 | 218.37 | 1.28 | 183.81 | 0.4545 | 0.2763 | |||
| RPAY / Repay Holdings Corporation | 0.27 | 22.56 | 1.28 | 6.05 | 0.4542 | -0.0224 | |||
| JBI / Janus International Group, Inc. | 0.16 | 335.73 | 1.27 | 393.39 | 0.4503 | 0.3485 | |||
| SRI / Stoneridge, Inc. | 0.18 | 0.00 | 1.25 | 53.44 | 0.4434 | 0.1217 | |||
| TBI / TrueBlue, Inc. | 0.19 | 3.44 | 1.24 | 26.22 | 0.4411 | 0.0522 | |||
| SCVL / Shoe Carnival, Inc. | 0.06 | 0.00 | 1.15 | -14.86 | 0.4088 | -0.1259 | |||
| RGP / Resources Connection, Inc. | 0.21 | -2.86 | 1.14 | -20.21 | 0.4035 | -0.1595 | |||
| LAKE / Lakeland Industries, Inc. | 0.08 | 52.84 | 1.14 | 2.34 | 0.4031 | -0.0349 | |||
| CVU / CPI Aerostructures, Inc. | 0.32 | 0.00 | 1.11 | 0.82 | 0.3952 | -0.0408 | |||
| HIFS / Hingham Institution for Savings | 0.00 | 1.09 | 0.3880 | 0.3880 | |||||
| ABSI / Absci Corporation | 0.42 | 98.17 | 1.07 | 102.84 | 0.3811 | 0.1721 | |||
| SD / SandRidge Energy, Inc. | 0.10 | 0.00 | 1.06 | -5.29 | 0.3750 | -0.0655 | |||
| INGN / Inogen, Inc. | 0.15 | 56.62 | 1.03 | 54.60 | 0.3638 | 0.1016 | |||
| REAL / The RealReal, Inc. | 0.21 | 109.45 | 1.00 | 86.25 | 0.3558 | 0.1431 | |||
| AEHR / Aehr Test Systems, Inc. | 0.08 | -35.43 | 1.00 | 14.56 | 0.3545 | 0.0100 | |||
| AOSL / Alpha and Omega Semiconductor Limited | 0.04 | 0.98 | 0.3477 | 0.3477 | |||||
| DHX / DHI Group, Inc. | 0.33 | 0.00 | 0.98 | 113.79 | 0.3468 | 0.1662 | |||
| FORR / Forrester Research, Inc. | 0.10 | -12.83 | 0.95 | -6.65 | 0.3389 | -0.0649 | |||
| RLGT / Radiant Logistics, Inc. | 0.16 | 15.35 | 0.95 | 14.05 | 0.3373 | 0.0081 | |||
| FPLSF / 5N Plus Inc. | 0.14 | 0.93 | 0.3317 | 0.3317 | |||||
| ALTG / Alta Equipment Group Inc. | 0.15 | 26.78 | 0.93 | 70.96 | 0.3303 | 0.1151 | |||
| CNTY / Century Casinos, Inc. | 0.43 | 0.00 | 0.91 | 25.17 | 0.3231 | 0.0358 | |||
| HMDPF / Hammond Power Solutions Inc. | 0.01 | 0.91 | 0.3231 | 0.3231 | |||||
| WTTR / Select Water Solutions, Inc. | 0.11 | 281.61 | 0.91 | 214.19 | 0.3225 | 0.2082 | |||
| MRVI / Maravai LifeSciences Holdings, Inc. | 0.37 | 0.00 | 0.89 | 8.94 | 0.3162 | -0.0065 | |||
| ESQ / Esquire Financial Holdings, Inc. | 0.01 | 0.87 | 0.3083 | 0.3083 | |||||
| ASUR / Asure Software, Inc. | 0.09 | 4.61 | 0.84 | 6.97 | 0.2996 | -0.0123 | |||
| RBBN / Ribbon Communications Inc. | 0.21 | 418.54 | 0.83 | 432.69 | 0.2952 | 0.2332 | |||
| CBNA / Chain Bridge Bancorp, Inc. | 0.03 | 0.77 | 0.2743 | 0.2743 | |||||
| LGIH / LGI Homes, Inc. | 0.01 | 0.75 | 0.2659 | 0.2659 | |||||
| FFWM / First Foundation Inc. | 0.14 | 17.23 | 0.73 | 15.12 | 0.2598 | 0.0088 | |||
| LAB / Standard BioTools Inc. | 0.57 | 90.83 | 0.69 | 112.04 | 0.2441 | 0.1160 | |||
| TVTX / Travere Therapeutics, Inc. | 0.04 | 0.66 | 0.2325 | 0.2325 | |||||
| DENN / Denny's Corporation | 0.16 | 134.68 | 0.65 | 162.50 | 0.2311 | 0.1330 | |||
| THRY / Thryv Holdings, Inc. | 0.05 | -26.66 | 0.65 | -30.37 | 0.2310 | -0.1383 | |||
| VRA / Vera Bradley, Inc. | 0.29 | 0.00 | 0.65 | -1.82 | 0.2301 | -0.0306 | |||
| PWP / Perella Weinberg Partners | 0.03 | 0.54 | 0.1922 | 0.1922 | |||||
| PLAB / Photronics, Inc. | 0.02 | -79.43 | 0.45 | -81.37 | 0.1581 | -0.7852 | |||
| LUNA / Luna Innovations Incorporated | 0.45 | 0.00 | 0.39 | 30.03 | 0.1400 | 0.0203 | |||
| RDW / Redwire Corporation | 0.02 | 0.39 | 0.1377 | 0.1377 | |||||
| ORIC / ORIC Pharmaceuticals, Inc. | 0.03 | 0.30 | 0.1071 | 0.1071 | |||||
| MXCT / MaxCyte, Inc. | 0.12 | -20.25 | 0.27 | -36.36 | 0.0947 | -0.0708 | |||
| SLQT / SelectQuote, Inc. | 0.11 | 0.26 | 0.0924 | 0.0924 | |||||
| TTEC / TTEC Holdings, Inc. | 0.05 | -2.92 | 0.25 | 41.90 | 0.0903 | 0.0195 | |||
| SPRY / ARS Pharmaceuticals, Inc. | 0.01 | -92.76 | 0.11 | -89.97 | 0.0395 | -0.3980 | |||
| 21L / Alphamin Resources Corp. | 0.10 | 0.00 | 0.06 | 85.29 | 0.0224 | 0.0090 | |||
| MIDWAY INVESTMENTS LTD / EC (000000000) | 1.86 | 0.00 | 0.0000 | 0.0000 |