Statistik Asas
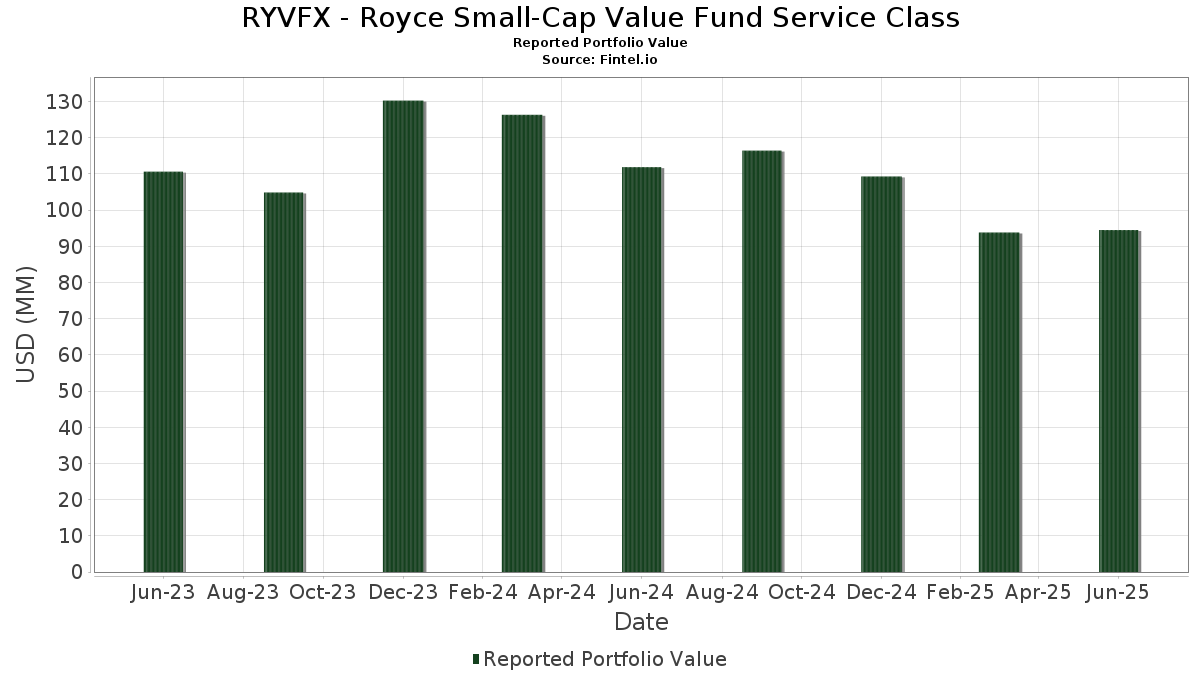
| Nilai Portfolio | $ 94,501,693 |
| Kedudukan Semasa | 81 |
Pegangan Terkini, Prestasi, AUM (dari 13F, 13D)
RYVFX - Royce Small-Cap Value Fund Service Class telah mendedahkan 81 jumlah pegangan dalam pemfailan SEC terkini mereka. Nilai portfolio terkini dikira sebagai $ 94,501,693 USD. Aset Sebenar Di Bawah Pengurusan (AUM) ialah nilai ini ditambah dengan tunai (yang tidak didedahkan). Pegangan teratas RYVFX - Royce Small-Cap Value Fund Service Class ialah Diebold Nixdorf, Incorporated (US:DBD) , IBEX Limited (US:IBEX) , The Buckle, Inc. (US:BKE) , Sanmina Corporation (US:SANM) , and Jabil Inc. (US:JBL) . Kedudukan baharu RYVFX - Royce Small-Cap Value Fund Service Class termasuk Steelcase Inc. (US:SCS) , Gentex Corporation (US:GNTX) , Blue Bird Corporation (US:BLBD) , Cabot Corporation (US:CBT) , and Entrada Therapeutics, Inc. (US:TRDA) .
Kenaikan Teratas Suku Tahun Ini
Kami menggunakan perubahan dalam peruntukan portfolio kerana ini adalah metrik yang paling bermakna. Perubahan boleh disebabkan oleh perdagangan atau perubahan dalam harga saham.
| Sekuriti | Saham (MM) |
Nilai (MM$) |
Portfolio % | ΔPortfolio % |
|---|---|---|---|---|
| 0.97 | 1.0282 | 1.0282 | ||
| 0.02 | 0.95 | 1.0096 | 0.8356 | |
| 0.09 | 1.21 | 1.2800 | 0.8022 | |
| 0.07 | 0.75 | 0.7919 | 0.7919 | |
| 0.03 | 0.72 | 0.7582 | 0.7582 | |
| 0.02 | 0.71 | 0.7536 | 0.7536 | |
| 0.01 | 0.71 | 0.7495 | 0.7495 | |
| 0.01 | 1.82 | 1.9245 | 0.6423 | |
| 0.07 | 0.47 | 0.4971 | 0.4971 | |
| 0.01 | 1.37 | 1.4470 | 0.4310 |
Penurunan Teratas Suku Tahun Ini
Kami menggunakan perubahan dalam peruntukan portfolio kerana ini adalah metrik yang paling bermakna. Perubahan boleh disebabkan oleh perdagangan atau perubahan dalam harga saham.
| Sekuriti | Saham (MM) |
Nilai (MM$) |
Portfolio % | ΔPortfolio % |
|---|---|---|---|---|
| 0.02 | 0.60 | 0.6323 | -0.9249 | |
| 0.03 | 0.37 | 0.3949 | -0.9060 | |
| 0.03 | 0.23 | 0.2392 | -0.7115 | |
| 0.06 | 0.62 | 0.6545 | -0.6362 | |
| 0.05 | 0.78 | 0.8269 | -0.4475 | |
| 0.00 | 1.47 | 1.5598 | -0.4448 | |
| 0.04 | 0.80 | 0.8466 | -0.3614 | |
| 0.05 | 1.16 | 1.2273 | -0.3477 | |
| 0.03 | 0.77 | 0.8195 | -0.3424 | |
| 0.09 | 1.53 | 1.6255 | -0.2993 |
13F dan Pemfailan Dana
Borang ini telah difailkan pada 2025-08-15 untuk tempoh pelaporan 2025-06-30. Klik ikon pautan untuk melihat sejarah transaksi penuh.
Tingkatkan untuk membuka data premium dan eksport ke Excel ![]() .
.
| Sekuriti | Jenis | Purata Harga Saham | Saham (MM) |
ΔSaham (%) |
ΔSaham (%) |
Nilai ($MM) |
Portfolio (%) |
ΔPortfolio (%) |
|
|---|---|---|---|---|---|---|---|---|---|
| DBD / Diebold Nixdorf, Incorporated | 0.03 | -18.40 | 1.92 | 3.39 | 2.0382 | 0.0534 | |||
| IBEX / IBEX Limited | 0.06 | -12.63 | 1.86 | 4.44 | 1.9686 | 0.0703 | |||
| BKE / The Buckle, Inc. | 0.04 | 2.47 | 1.86 | 21.23 | 1.9673 | 0.3339 | |||
| SANM / Sanmina Corporation | 0.02 | -19.82 | 1.84 | 2.96 | 1.9515 | 0.0432 | |||
| JBL / Jabil Inc. | 0.01 | -20.67 | 1.84 | 27.14 | 1.9508 | 0.4060 | |||
| FLEX / Flex Ltd. | 0.04 | -25.08 | 1.82 | 13.11 | 1.9286 | 0.2111 | |||
| EVR / Evercore Inc. | 0.01 | 11.78 | 1.82 | 51.21 | 1.9245 | 0.6423 | |||
| VLGEA / Village Super Market, Inc. | 0.05 | -12.23 | 1.78 | -11.12 | 1.8816 | -0.2495 | |||
| VC / Visteon Corporation | 0.02 | -5.78 | 1.76 | 13.32 | 1.8658 | 0.2071 | |||
| TIPT / Tiptree Inc. | 0.07 | -4.88 | 1.73 | -6.86 | 1.8280 | -0.1488 | |||
| UNTY / Unity Bancorp, Inc. | 0.04 | 0.00 | 1.72 | 15.63 | 1.8274 | 0.2368 | |||
| LEA / Lear Corporation | 0.02 | -9.61 | 1.65 | -2.65 | 1.7517 | -0.0606 | |||
| SNX / TD SYNNEX Corporation | 0.01 | -11.61 | 1.64 | 15.34 | 1.7375 | 0.2213 | |||
| PHM / PulteGroup, Inc. | 0.02 | 0.00 | 1.64 | 2.57 | 1.7340 | 0.0321 | |||
| ALSN / Allison Transmission Holdings, Inc. | 0.02 | -9.97 | 1.63 | -10.65 | 1.7256 | -0.2181 | |||
| TGNA / TEGNA Inc. | 0.09 | -7.56 | 1.53 | -14.97 | 1.6255 | -0.2993 | |||
| TSBK / Timberland Bancorp, Inc. | 0.05 | 0.00 | 1.53 | 3.53 | 1.6172 | 0.0437 | |||
| TPH / Tri Pointe Homes, Inc. | 0.05 | -5.87 | 1.50 | -5.77 | 1.5921 | -0.1093 | |||
| MOH / Molina Healthcare, Inc. | 0.00 | -13.37 | 1.47 | -21.66 | 1.5598 | -0.4448 | |||
| MHO / M/I Homes, Inc. | 0.01 | -5.71 | 1.47 | -7.37 | 1.5587 | -0.1364 | |||
| ARCB / ArcBest Corporation | 0.02 | 19.41 | 1.44 | 30.23 | 1.5298 | 0.3475 | |||
| MTDR / Matador Resources Company | 0.03 | 8.65 | 1.44 | 1.55 | 1.5289 | 0.0120 | |||
| FRBA / First Bank | 0.09 | 17.91 | 1.43 | 23.17 | 1.5160 | 0.2766 | |||
| NEU / NewMarket Corporation | 0.00 | 0.00 | 1.43 | 21.90 | 1.5108 | 0.2636 | |||
| BHRB / Burke & Herbert Financial Services Corp. | 0.02 | -3.76 | 1.42 | 2.38 | 1.5023 | 0.0259 | |||
| MTH / Meritage Homes Corporation | 0.02 | -3.95 | 1.42 | -9.29 | 1.5000 | -0.1643 | |||
| CHRD / Chord Energy Corporation | 0.01 | 40.30 | 1.41 | 20.58 | 1.4905 | 0.2455 | |||
| CPRX / Catalyst Pharmaceuticals, Inc. | 0.06 | -1.50 | 1.40 | -11.89 | 1.4850 | -0.2113 | |||
| STRL / Sterling Infrastructure, Inc. | 0.01 | -29.64 | 1.37 | 43.38 | 1.4470 | 0.4310 | |||
| TNK / Teekay Tankers Ltd. | 0.03 | -10.97 | 1.36 | -2.93 | 1.4401 | -0.0539 | |||
| GNK / Genco Shipping & Trading Limited | 0.10 | 9.53 | 1.36 | 7.11 | 1.4366 | 0.0867 | |||
| AMKR / Amkor Technology, Inc. | 0.06 | 2.98 | 1.35 | 19.65 | 1.4335 | 0.2276 | |||
| HFWA / Heritage Financial Corporation | 0.06 | 0.00 | 1.33 | -1.99 | 1.4060 | -0.0388 | |||
| UVSP / Univest Financial Corporation | 0.04 | 0.00 | 1.32 | 5.87 | 1.3950 | 0.0690 | |||
| BBSI / Barrett Business Services, Inc. | 0.03 | -2.73 | 1.30 | -1.44 | 1.3799 | -0.0299 | |||
| PLUS / ePlus inc. | 0.02 | 0.00 | 1.29 | 18.21 | 1.3691 | 0.2022 | |||
| KFY / Korn Ferry | 0.02 | 0.00 | 1.28 | 8.11 | 1.3565 | 0.0931 | |||
| ACT / Enact Holdings, Inc. | 0.03 | 0.00 | 1.26 | 6.88 | 1.3345 | 0.0776 | |||
| FTDR / Frontdoor, Inc. | 0.02 | -17.86 | 1.22 | 26.06 | 1.2969 | 0.2606 | |||
| ADEA / Adeia Inc. | 0.09 | 152.21 | 1.21 | 170.25 | 1.2800 | 0.8022 | |||
| MPB / Mid Penn Bancorp, Inc. | 0.04 | -3.71 | 1.20 | 4.82 | 1.2664 | 0.0498 | |||
| OCFC / OceanFirst Financial Corp. | 0.07 | 30.89 | 1.17 | 35.58 | 1.2361 | 0.3176 | |||
| CCNE / CNB Financial Corporation | 0.05 | -2.90 | 1.17 | -0.26 | 1.2353 | -0.0114 | |||
| SM / SM Energy Company | 0.05 | -4.90 | 1.16 | -21.54 | 1.2273 | -0.3477 | |||
| TILE / Interface, Inc. | 0.06 | 45.86 | 1.15 | 53.94 | 1.2217 | 0.4223 | |||
| IMXI / International Money Express, Inc. | 0.11 | 19.00 | 1.15 | -4.81 | 1.2164 | -0.0709 | |||
| SIG / Signet Jewelers Limited | 0.01 | -30.02 | 1.13 | -4.06 | 1.2017 | -0.0602 | |||
| COLL / Collegium Pharmaceutical, Inc. | 0.04 | -7.36 | 1.13 | -8.20 | 1.1987 | -0.1165 | |||
| DCOM / Dime Community Bancshares, Inc. | 0.04 | 0.00 | 1.08 | -3.41 | 1.1418 | -0.0480 | |||
| BELFB / Bel Fuse Inc. | 0.01 | -24.55 | 0.98 | -1.60 | 1.0424 | -0.0236 | |||
| FIXED INC CLEARING CORP.REPO / RA (000000000) | 0.97 | 1.0282 | 1.0282 | ||||||
| ASO / Academy Sports and Outdoors, Inc. | 0.02 | -11.91 | 0.96 | -13.42 | 1.0184 | -0.1665 | |||
| FSBW / FS Bancorp, Inc. | 0.02 | 463.77 | 0.95 | 484.05 | 1.0096 | 0.8356 | |||
| WSBC / WesBanco, Inc. | 0.03 | 0.00 | 0.92 | 2.22 | 0.9760 | 0.0141 | |||
| MLR / Miller Industries, Inc. | 0.02 | -5.01 | 0.88 | -0.34 | 0.9300 | -0.0094 | |||
| KTB / Kontoor Brands, Inc. | 0.01 | -10.44 | 0.85 | -7.89 | 0.9034 | -0.0839 | |||
| TRST / TrustCo Bank Corp NY | 0.03 | -5.53 | 0.85 | 3.68 | 0.8964 | 0.0251 | |||
| WS / Worthington Steel, Inc. | 0.03 | 0.00 | 0.85 | 17.85 | 0.8957 | 0.1299 | |||
| ETD / Ethan Allen Interiors Inc. | 0.03 | -18.03 | 0.83 | -17.51 | 0.8784 | -0.1947 | |||
| SCVL / Shoe Carnival, Inc. | 0.04 | -17.07 | 0.80 | -29.42 | 0.8466 | -0.3614 | |||
| JILL / J.Jill, Inc. | 0.05 | -12.85 | 0.78 | -34.67 | 0.8269 | -0.4475 | |||
| REPX / Riley Exploration Permian, Inc. | 0.03 | -21.03 | 0.77 | -29.02 | 0.8195 | -0.3424 | |||
| CNXN / PC Connection, Inc. | 0.01 | -8.04 | 0.77 | -3.16 | 0.8114 | -0.0316 | |||
| WSM / Williams-Sonoma, Inc. | 0.00 | -5.23 | 0.76 | -2.07 | 0.8025 | -0.0226 | |||
| SCS / Steelcase Inc. | 0.07 | 0.75 | 0.7919 | 0.7919 | |||||
| WNEB / Western New England Bancorp, Inc. | 0.08 | -2.61 | 0.74 | -3.38 | 0.7877 | -0.0329 | |||
| GNTX / Gentex Corporation | 0.03 | 0.72 | 0.7582 | 0.7582 | |||||
| BLBD / Blue Bird Corporation | 0.02 | 0.71 | 0.7536 | 0.7536 | |||||
| CBT / Cabot Corporation | 0.01 | 0.71 | 0.7495 | 0.7495 | |||||
| SLVM / Sylvamo Corporation | 0.01 | 27.68 | 0.70 | -4.61 | 0.7462 | -0.0415 | |||
| AMPH / Amphastar Pharmaceuticals, Inc. | 0.03 | -6.90 | 0.70 | -26.23 | 0.7449 | -0.2723 | |||
| BPRN / Princeton Bancorp, Inc. | 0.02 | 26.72 | 0.68 | 26.63 | 0.7208 | 0.1479 | |||
| UFPI / UFP Industries, Inc. | 0.01 | -4.13 | 0.63 | -11.00 | 0.6692 | -0.0880 | |||
| MBC / MasterBrand, Inc. | 0.06 | -38.99 | 0.62 | -48.97 | 0.6545 | -0.6362 | |||
| CIVI / Civitas Resources, Inc. | 0.02 | -48.17 | 0.60 | -59.15 | 0.6323 | -0.9249 | |||
| SIGA / SIGA Technologies, Inc. | 0.08 | -25.67 | 0.55 | -11.54 | 0.5856 | -0.0811 | |||
| DMLP / Dorchester Minerals, L.P. - Limited Partnership | 0.02 | -17.31 | 0.55 | -23.39 | 0.5798 | -0.1825 | |||
| CZWI / Citizens Community Bancorp, Inc. | 0.04 | -8.64 | 0.49 | -12.41 | 0.5167 | -0.0767 | |||
| TRDA / Entrada Therapeutics, Inc. | 0.07 | 0.47 | 0.4971 | 0.4971 | |||||
| CAL / Caleres, Inc. | 0.03 | -56.90 | 0.37 | -69.48 | 0.3949 | -0.9060 | |||
| CRGY / Crescent Energy Company | 0.03 | -66.89 | 0.23 | -74.75 | 0.2392 | -0.7115 | |||
| SNDR / Schneider National, Inc. | 0.00 | -100.00 | 0.00 | -100.00 | -0.2706 |