Statistik Asas
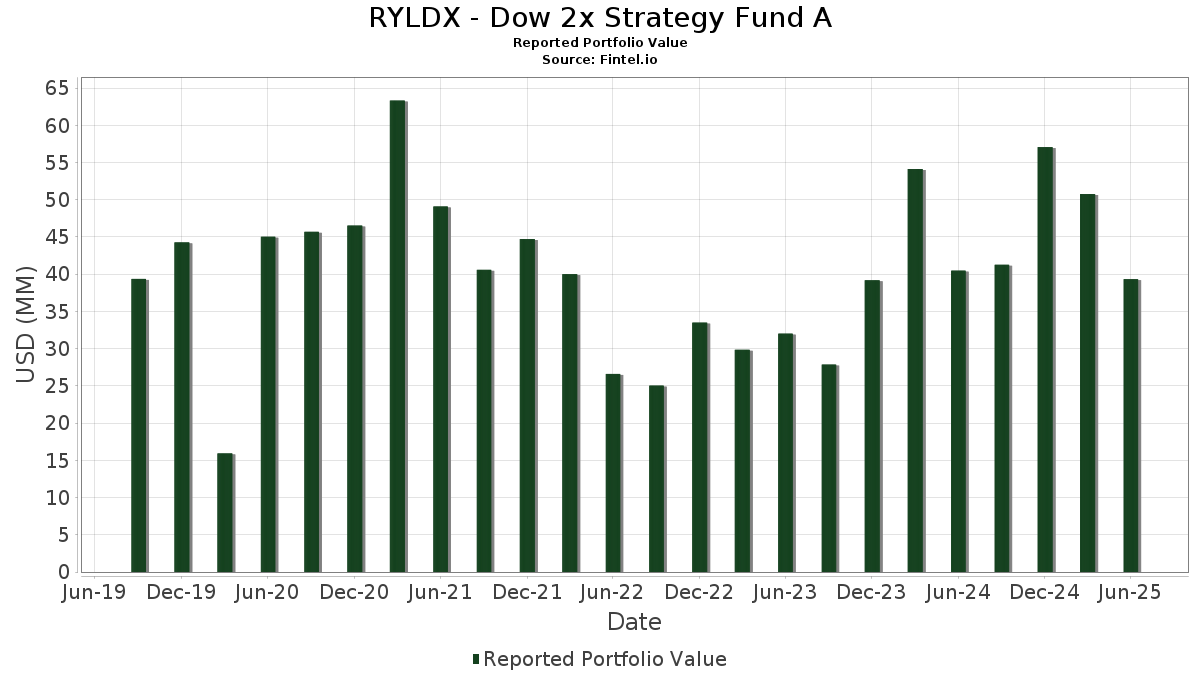
| Nilai Portfolio | $ 39,333,552 |
| Kedudukan Semasa | 38 |
Pegangan Terkini, Prestasi, AUM (dari 13F, 13D)
RYLDX - Dow 2x Strategy Fund A telah mendedahkan 38 jumlah pegangan dalam pemfailan SEC terkini mereka. Nilai portfolio terkini dikira sebagai $ 39,333,552 USD. Aset Sebenar Di Bawah Pengurusan (AUM) ialah nilai ini ditambah dengan tunai (yang tidak didedahkan). Pegangan teratas RYLDX - Dow 2x Strategy Fund A ialah The Goldman Sachs Group, Inc. (US:GS) , Microsoft Corporation (US:MSFT) , Caterpillar Inc. (US:CAT) , The Home Depot, Inc. (US:HD) , and Visa Inc. (US:V) .
Kenaikan Teratas Suku Tahun Ini
Kami menggunakan perubahan dalam peruntukan portfolio kerana ini adalah metrik yang paling bermakna. Perubahan boleh disebabkan oleh perdagangan atau perubahan dalam harga saham.
| Sekuriti | Saham (MM) |
Nilai (MM$) |
Portfolio % | ΔPortfolio % |
|---|---|---|---|---|
| 1.95 | 5.4413 | 5.4413 | ||
| 1.78 | 4.9674 | 4.9674 | ||
| 1.01 | 2.7999 | 2.7999 | ||
| 0.84 | 2.3479 | 2.3479 | ||
| 0.81 | 2.2672 | 2.2672 | ||
| 0.00 | 3.14 | 8.7451 | 1.7916 | |
| 0.52 | 1.4442 | 1.4442 | ||
| 0.00 | 2.21 | 6.1461 | 1.3679 | |
| 0.45 | 1.2460 | 1.2460 | ||
| 0.00 | 1.72 | 4.7968 | 0.5989 |
Penurunan Teratas Suku Tahun Ini
Kami menggunakan perubahan dalam peruntukan portfolio kerana ini adalah metrik yang paling bermakna. Perubahan boleh disebabkan oleh perdagangan atau perubahan dalam harga saham.
| Sekuriti | Saham (MM) |
Nilai (MM$) |
Portfolio % | ΔPortfolio % |
|---|---|---|---|---|
| 0.00 | 1.38 | 3.8548 | -2.8118 | |
| 0.00 | 1.24 | 3.4500 | -0.5156 | |
| 0.00 | 1.30 | 3.6101 | -0.3659 | |
| 0.00 | 0.64 | 1.7693 | -0.3601 | |
| 0.00 | 0.91 | 2.5351 | -0.2923 | |
| 0.00 | 0.68 | 1.8874 | -0.2235 | |
| 0.00 | 1.52 | 4.2426 | -0.2021 | |
| 0.00 | 0.71 | 1.9686 | -0.2006 | |
| 0.00 | 0.35 | 0.9781 | -0.1644 | |
| 0.00 | 1.63 | 4.5303 | -0.1346 |
13F dan Pemfailan Dana
Borang ini telah difailkan pada 2025-08-27 untuk tempoh pelaporan 2025-06-30. Klik ikon pautan untuk melihat sejarah transaksi penuh.
Tingkatkan untuk membuka data premium dan eksport ke Excel ![]() .
.
| Sekuriti | Jenis | Purata Harga Saham | Saham (MM) |
ΔSaham (%) |
ΔSaham (%) |
Nilai ($MM) |
Portfolio (%) |
ΔPortfolio (%) |
|
|---|---|---|---|---|---|---|---|---|---|
| GS / The Goldman Sachs Group, Inc. | 0.00 | -31.79 | 3.14 | -11.63 | 8.7451 | 1.7916 | |||
| MSFT / Microsoft Corporation | 0.00 | -31.79 | 2.21 | -9.63 | 6.1461 | 1.3679 | |||
| DE000C4SA6R6 / EURO STOXX 50 Index | 1.95 | 5.4413 | 5.4413 | ||||||
| U.S. Treasury Bills / DBT (US912797PX98) | 1.78 | 4.9674 | 4.9674 | ||||||
| CAT / Caterpillar Inc. | 0.00 | -31.79 | 1.72 | -19.68 | 4.7968 | 0.5989 | |||
| HD / The Home Depot, Inc. | 0.00 | -31.79 | 1.63 | -31.77 | 4.5303 | -0.1346 | |||
| V / Visa Inc. | 0.00 | -31.79 | 1.58 | -30.89 | 4.3871 | -0.0738 | |||
| SHW / The Sherwin-Williams Company | 0.00 | -31.79 | 1.52 | -32.91 | 4.2426 | -0.2021 | |||
| AXP / American Express Company | 0.00 | -31.79 | 1.41 | -19.15 | 3.9414 | 0.5168 | |||
| UNH / UnitedHealth Group Incorporated | 0.00 | -31.79 | 1.38 | -59.38 | 3.8548 | -2.8118 | |||
| IBM / International Business Machines Corporation | 0.00 | -31.79 | 1.31 | -19.17 | 3.6424 | 0.4773 | |||
| MCD / McDonald's Corporation | 0.00 | -31.79 | 1.30 | -36.19 | 3.6101 | -0.3659 | |||
| JPM / JPMorgan Chase & Co. | 0.00 | -31.79 | 1.29 | -19.37 | 3.5822 | 0.4599 | |||
| AMGN / Amgen Inc. | 0.00 | -31.79 | 1.24 | -38.89 | 3.4500 | -0.5156 | |||
| CRM / Salesforce, Inc. | 0.00 | -31.79 | 1.21 | -30.72 | 3.3694 | -0.0464 | |||
| TRV / The Travelers Companies, Inc. | 0.00 | -31.79 | 1.19 | -31.01 | 3.3058 | -0.0604 | |||
| HON / Honeywell International Inc. | 0.00 | -31.79 | 1.03 | -24.98 | 2.8775 | 0.1822 | |||
| U.S. Treasury Bills / DBT (US912797PZ47) | 1.01 | 2.7999 | 2.7999 | ||||||
| AMZN / Amazon.com, Inc. | 0.00 | -31.79 | 0.97 | -21.34 | 2.7108 | 0.2891 | |||
| BA / The Boeing Company | 0.00 | -31.79 | 0.93 | -16.23 | 2.5890 | 0.4181 | |||
| AAPL / Apple Inc. | 0.00 | -31.79 | 0.91 | -36.98 | 2.5351 | -0.2923 | |||
| Barclays Capital, Inc. / RA (N/A) | 0.84 | 2.3479 | 2.3479 | ||||||
| BofA Securities, Inc. / RA (N/A) | 0.81 | 2.2672 | 2.2672 | ||||||
| PG / The Procter & Gamble Company | 0.00 | -31.79 | 0.71 | -36.28 | 1.9686 | -0.2006 | |||
| NVDA / NVIDIA Corporation | 0.00 | -31.79 | 0.70 | -0.57 | 1.9522 | 0.5726 | |||
| JNJ / Johnson & Johnson | 0.00 | -31.79 | 0.68 | -37.20 | 1.8874 | -0.2235 | |||
| MMM / 3M Company | 0.00 | -31.79 | 0.68 | -29.32 | 1.8811 | 0.0118 | |||
| CVX / Chevron Corporation | 0.00 | -31.79 | 0.64 | -41.58 | 1.7693 | -0.3601 | |||
| DIS / The Walt Disney Company | 0.00 | -31.79 | 0.55 | -14.20 | 1.5323 | 0.2760 | |||
| Dow Jones Industrial Average Index Mini Futures Contracts / DE (N/A) | 0.52 | 1.4442 | 1.4442 | ||||||
| US06747W8495 / Barclays Bank plc into Metlife, Inc. | 0.45 | 1.2460 | 1.2460 | ||||||
| WMT / Walmart Inc. | 0.00 | -31.79 | 0.43 | -24.04 | 1.2082 | 0.0907 | |||
| MRK / Merck & Co., Inc. | 0.00 | -31.79 | 0.35 | -39.79 | 0.9781 | -0.1644 | |||
| NKE / NIKE, Inc. | 0.00 | -31.79 | 0.32 | -23.54 | 0.8778 | 0.0698 | |||
| KO / The Coca-Cola Company | 0.00 | -31.79 | 0.31 | -32.69 | 0.8742 | -0.0374 | |||
| CSCO / Cisco Systems, Inc. | 0.00 | -31.79 | 0.31 | -23.44 | 0.8573 | 0.0718 | |||
| VZ / Verizon Communications Inc. | 0.00 | -31.79 | 0.19 | -35.03 | 0.5347 | -0.0427 | |||
| BNP / BNP Paribas SA | 0.15 | 0.4099 | 0.4099 |