Statistik Asas
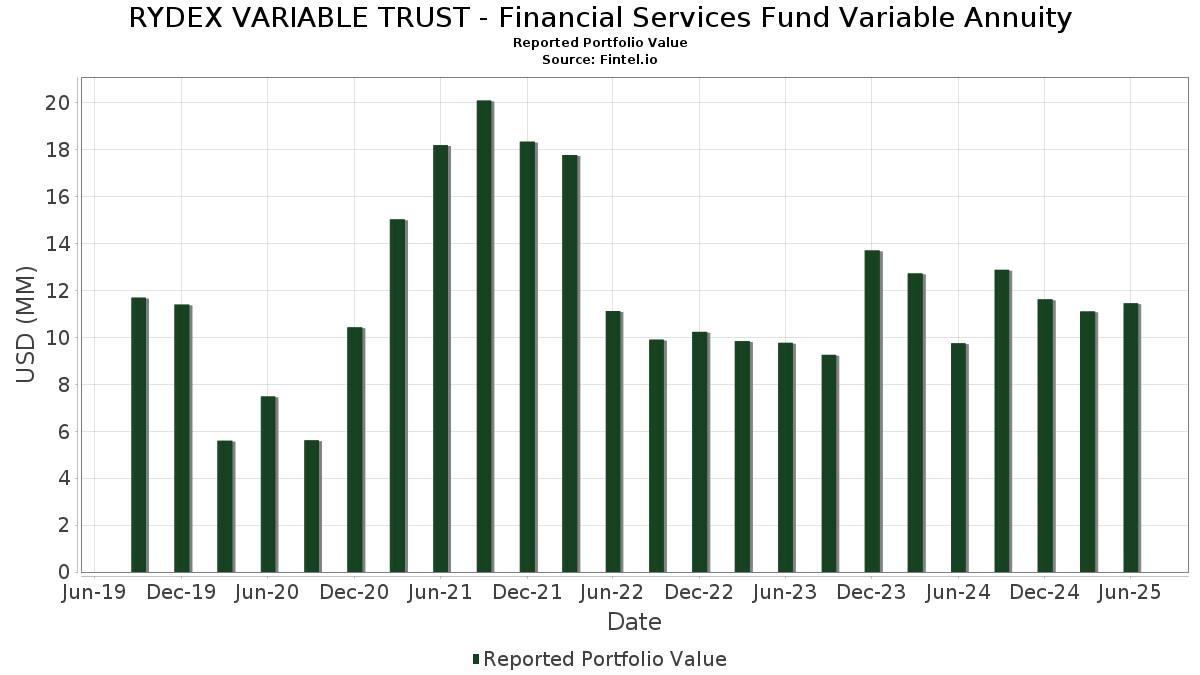
| Nilai Portfolio | $ 11,457,835 |
| Kedudukan Semasa | 160 |
Pegangan Terkini, Prestasi, AUM (dari 13F, 13D)
RYDEX VARIABLE TRUST - Financial Services Fund Variable Annuity telah mendedahkan 160 jumlah pegangan dalam pemfailan SEC terkini mereka. Nilai portfolio terkini dikira sebagai $ 11,457,835 USD. Aset Sebenar Di Bawah Pengurusan (AUM) ialah nilai ini ditambah dengan tunai (yang tidak didedahkan). Pegangan teratas RYDEX VARIABLE TRUST - Financial Services Fund Variable Annuity ialah Berkshire Hathaway Inc. (US:BRK.B) , JPMorgan Chase & Co. (US:JPM) , Visa Inc. (US:V) , Mastercard Incorporated (US:MA) , and Bank of America Corporation (US:BAC) . Kedudukan baharu RYDEX VARIABLE TRUST - Financial Services Fund Variable Annuity termasuk Mr. Cooper Group Inc. (US:COOP) , .
Kenaikan Teratas Suku Tahun Ini
Kami menggunakan perubahan dalam peruntukan portfolio kerana ini adalah metrik yang paling bermakna. Perubahan boleh disebabkan oleh perdagangan atau perubahan dalam harga saham.
| Sekuriti | Saham (MM) |
Nilai (MM$) |
Portfolio % | ΔPortfolio % |
|---|---|---|---|---|
| 0.09 | 0.09 | 0.7976 | 0.7976 | |
| 0.00 | 0.12 | 1.0998 | 0.4569 | |
| 0.04 | 0.3959 | 0.3959 | ||
| 0.00 | 0.13 | 1.1702 | 0.3288 | |
| 0.00 | 0.11 | 0.9838 | 0.3258 | |
| 0.00 | 0.03 | 0.2828 | 0.2828 | |
| 0.00 | 0.18 | 1.5534 | 0.2022 | |
| 0.00 | 0.33 | 2.8672 | 0.1736 | |
| 0.02 | 0.1708 | 0.1708 | ||
| 0.02 | 0.1649 | 0.1649 |
Penurunan Teratas Suku Tahun Ini
Kami menggunakan perubahan dalam peruntukan portfolio kerana ini adalah metrik yang paling bermakna. Perubahan boleh disebabkan oleh perdagangan atau perubahan dalam harga saham.
| Sekuriti | Saham (MM) |
Nilai (MM$) |
Portfolio % | ΔPortfolio % |
|---|---|---|---|---|
| 0.00 | 0.35 | 3.1214 | -0.2899 | |
| 0.00 | 0.29 | 2.5256 | -0.1701 | |
| 0.00 | 0.11 | 0.9635 | -0.1629 | |
| 0.00 | 0.11 | 1.0060 | -0.1127 | |
| 0.00 | 0.23 | 2.0457 | -0.1046 | |
| 0.00 | 0.09 | 0.7849 | -0.1030 | |
| 0.00 | 0.07 | 0.5981 | -0.0839 | |
| 0.00 | 0.10 | 0.8747 | -0.0824 | |
| 0.00 | 0.02 | 0.1535 | -0.0779 | |
| 0.00 | 0.14 | 1.2114 | -0.0732 |
13F dan Pemfailan Dana
Borang ini telah difailkan pada 2025-08-27 untuk tempoh pelaporan 2025-06-30. Klik ikon pautan untuk melihat sejarah transaksi penuh.
Tingkatkan untuk membuka data premium dan eksport ke Excel ![]() .
.
| Sekuriti | Jenis | Purata Harga Saham | Saham (MM) |
ΔSaham (%) |
ΔSaham (%) |
Nilai ($MM) |
Portfolio (%) |
ΔPortfolio (%) |
|
|---|---|---|---|---|---|---|---|---|---|
| BRK.B / Berkshire Hathaway Inc. | 0.00 | 3.11 | 0.35 | -5.85 | 3.1214 | -0.2899 | |||
| JPM / JPMorgan Chase & Co. | 0.00 | -7.43 | 0.33 | 9.43 | 2.8672 | 0.1736 | |||
| V / Visa Inc. | 0.00 | -4.95 | 0.29 | -3.70 | 2.5256 | -0.1701 | |||
| MA / Mastercard Incorporated | 0.00 | -4.62 | 0.23 | -2.11 | 2.0457 | -0.1046 | |||
| BAC / Bank of America Corporation | 0.00 | -5.10 | 0.21 | 7.33 | 1.8144 | 0.0813 | |||
| WFC / Wells Fargo & Company | 0.00 | -2.17 | 0.19 | 9.36 | 1.6547 | 0.0969 | |||
| GS / The Goldman Sachs Group, Inc. | 0.00 | -8.79 | 0.18 | 18.12 | 1.5534 | 0.2022 | |||
| BX / Blackstone Inc. | 0.00 | -2.10 | 0.15 | 4.79 | 1.3554 | 0.0257 | |||
| MS / Morgan Stanley | 0.00 | -7.57 | 0.15 | 11.19 | 1.3186 | 0.1041 | |||
| SPGI / S&P Global Inc. | 0.00 | -1.78 | 0.15 | 2.11 | 1.2828 | -0.0107 | |||
| C / Citigroup Inc. | 0.00 | -5.79 | 0.15 | 13.28 | 1.2807 | 0.1153 | |||
| AXP / American Express Company | 0.00 | -6.57 | 0.15 | 10.69 | 1.2793 | 0.0922 | |||
| SCHW / The Charles Schwab Corporation | 0.00 | -7.31 | 0.14 | 8.40 | 1.2546 | 0.0610 | |||
| BLK / BlackRock, Inc. | 0.00 | -4.35 | 0.14 | 6.15 | 1.2208 | 0.0375 | |||
| PGR / The Progressive Corporation | 0.00 | 2.79 | 0.14 | -2.84 | 1.2114 | -0.0732 | |||
| COF / Capital One Financial Corporation | 0.00 | 20.46 | 0.13 | 43.48 | 1.1702 | 0.3288 | |||
| COIN / Coinbase Global, Inc. | 0.00 | -13.59 | 0.12 | 77.14 | 1.0998 | 0.4569 | |||
| MMC / Marsh & McLennan Companies, Inc. | 0.00 | 3.16 | 0.11 | -7.32 | 1.0060 | -0.1127 | |||
| ICE / Intercontinental Exchange, Inc. | 0.00 | -1.90 | 0.11 | 3.67 | 1.0043 | 0.0150 | |||
| AMT / American Tower Corporation | 0.00 | -1.91 | 0.11 | 0.00 | 0.9994 | -0.0316 | |||
| HOOD / Robinhood Markets, Inc. | 0.00 | -31.69 | 0.11 | 54.17 | 0.9838 | 0.3258 | |||
| WELL / Welltower Inc. | 0.00 | -0.82 | 0.11 | 0.00 | 0.9797 | -0.0322 | |||
| CME / CME Group Inc. | 0.00 | -1.71 | 0.11 | 2.78 | 0.9791 | -0.0064 | |||
| IBKR / Interactive Brokers Group, Inc. | 0.00 | 248.85 | 0.11 | 17.20 | 0.9661 | 0.1154 | |||
| FI / Fiserv, Inc. | 0.00 | 12.61 | 0.11 | -12.10 | 0.9635 | -0.1629 | |||
| PLD / Prologis, Inc. | 0.00 | 3.09 | 0.11 | -3.57 | 0.9581 | -0.0578 | |||
| KKR / KKR & Co. Inc. | 0.00 | -7.18 | 0.11 | 6.93 | 0.9557 | 0.0360 | |||
| M1Z / Nu Holdings Ltd. | 0.01 | -8.54 | 0.10 | 22.22 | 0.8792 | 0.1417 | |||
| AJG / Arthur J. Gallagher & Co. | 0.00 | 1.31 | 0.10 | -5.71 | 0.8747 | -0.0824 | |||
| MCO / Moody's Corporation | 0.00 | -4.39 | 0.10 | 3.16 | 0.8666 | 0.0017 | |||
| PNC / The PNC Financial Services Group, Inc. | 0.00 | -1.33 | 0.10 | 4.35 | 0.8545 | 0.0152 | |||
| WTY / Willis Towers Watson Public Limited Company | 0.00 | 8.39 | 0.10 | -1.04 | 0.8375 | -0.0382 | |||
| USB / U.S. Bancorp | 0.00 | -2.55 | 0.09 | 4.49 | 0.8244 | 0.0131 | |||
| PYPL / PayPal Holdings, Inc. | 0.00 | -5.37 | 0.09 | 6.98 | 0.8189 | 0.0379 | |||
| EQIX / Equinix, Inc. | 0.00 | -3.36 | 0.09 | -6.19 | 0.8063 | -0.0727 | |||
| First American Government Obligations Fund - Class X / STIV (N/A) | 0.09 | 0.09 | 0.7976 | 0.7976 | |||||
| BK / The Bank of New York Mellon Corporation | 0.00 | -5.01 | 0.09 | 2.30 | 0.7918 | 0.0031 | |||
| RSK / Arch Capital Group Ltd. | 0.00 | -4.02 | 0.09 | -9.18 | 0.7849 | -0.1030 | |||
| TFC / Truist Financial Corporation | 0.00 | 1.21 | 0.09 | 6.17 | 0.7594 | 0.0212 | |||
| CB / Chubb Limited | 0.00 | 2.77 | 0.09 | -1.15 | 0.7585 | -0.0322 | |||
| TRV / The Travelers Companies, Inc. | 0.00 | -0.93 | 0.09 | 0.00 | 0.7546 | -0.0193 | |||
| 4VK / Aon plc | 0.00 | 18.41 | 0.08 | 5.00 | 0.7484 | 0.0217 | |||
| APO / Apollo Global Management, Inc. | 0.00 | -2.93 | 0.08 | 0.00 | 0.7453 | -0.0165 | |||
| AFL / Aflac Incorporated | 0.00 | 2.17 | 0.08 | -2.33 | 0.7427 | -0.0450 | |||
| DLR / Digital Realty Trust, Inc. | 0.00 | -8.35 | 0.08 | 12.00 | 0.7422 | 0.0580 | |||
| ARES / Ares Management Corporation | 0.00 | -9.21 | 0.08 | 6.58 | 0.7221 | 0.0301 | |||
| ALL / The Allstate Corporation | 0.00 | 1.02 | 0.08 | -2.47 | 0.7027 | -0.0327 | |||
| O / Realty Income Corporation | 0.00 | 0.00 | 0.08 | 0.00 | 0.7003 | -0.0245 | |||
| AMP / Ameriprise Financial, Inc. | 0.00 | -5.13 | 0.08 | 4.00 | 0.6963 | 0.0121 | |||
| SPG / Simon Property Group, Inc. | 0.00 | 1.24 | 0.08 | -2.50 | 0.6958 | -0.0340 | |||
| AIG / American International Group, Inc. | 0.00 | -2.90 | 0.08 | -3.75 | 0.6812 | -0.0513 | |||
| CCI / Crown Castle Inc. | 0.00 | -2.15 | 0.07 | -3.90 | 0.6601 | -0.0434 | |||
| MET / MetLife, Inc. | 0.00 | 0.65 | 0.07 | 0.00 | 0.6599 | -0.0129 | |||
| PSA / Public Storage | 0.00 | -0.39 | 0.07 | -2.63 | 0.6595 | -0.0346 | |||
| MSCI / MSCI Inc. | 0.00 | 0.00 | 0.07 | 2.78 | 0.6558 | -0.0051 | |||
| NDAQ / Nasdaq, Inc. | 0.00 | -6.68 | 0.07 | 10.61 | 0.6495 | 0.0426 | |||
| FIS / Fidelity National Information Services, Inc. | 0.00 | -4.72 | 0.07 | 4.35 | 0.6379 | 0.0067 | |||
| XYZ / Block, Inc. | 0.00 | -9.22 | 0.07 | 14.29 | 0.6365 | 0.0601 | |||
| XP9 / XP Inc. | 0.00 | -28.82 | 0.07 | 4.35 | 0.6364 | 0.0109 | |||
| 0Q0 / StoneCo Ltd. | 0.00 | -34.15 | 0.07 | 1.41 | 0.6354 | -0.0126 | |||
| IBN / ICICI Bank Limited - Depositary Receipt (Common Stock) | 0.00 | -13.95 | 0.07 | -8.00 | 0.6129 | -0.0730 | |||
| PRU / Prudential Financial, Inc. | 0.00 | 1.90 | 0.07 | -1.43 | 0.6089 | -0.0295 | |||
| HDB / HDFC Bank Limited - Depositary Receipt (Common Stock) | 0.00 | -21.89 | 0.07 | -10.67 | 0.5981 | -0.0839 | |||
| TD / The Toronto-Dominion Bank | 0.00 | -20.93 | 0.07 | -2.90 | 0.5943 | -0.0361 | |||
| BPOP / Popular, Inc. | 0.00 | -18.83 | 0.07 | -2.90 | 0.5906 | -0.0362 | |||
| BN / Brookfield Corporation | 0.00 | -17.95 | 0.07 | -4.35 | 0.5904 | -0.0363 | |||
| HIG / The Hartford Insurance Group, Inc. | 0.00 | -2.79 | 0.07 | 0.00 | 0.5849 | -0.0182 | |||
| RY / Royal Bank of Canada | 0.00 | -15.76 | 0.07 | -1.52 | 0.5763 | -0.0262 | |||
| VICI / VICI Properties Inc. | 0.00 | 0.91 | 0.06 | 0.00 | 0.5721 | -0.0110 | |||
| BNS / The Bank of Nova Scotia | 0.00 | -14.43 | 0.06 | 0.00 | 0.5661 | -0.0174 | |||
| ITUB / Itaú Unibanco Holding S.A. - Depositary Receipt (Common Stock) | 0.01 | -22.14 | 0.06 | -4.55 | 0.5606 | -0.0389 | |||
| TW / Tradeweb Markets Inc. | 0.00 | -2.04 | 0.06 | -3.08 | 0.5588 | -0.0357 | |||
| MTB / M&T Bank Corporation | 0.00 | -2.69 | 0.06 | 6.78 | 0.5574 | 0.0149 | |||
| BRO / Brown & Brown, Inc. | 0.00 | 14.29 | 0.06 | 3.33 | 0.5473 | -0.0050 | |||
| ERE / Everest Group, Ltd. | 0.00 | -2.15 | 0.06 | -8.96 | 0.5452 | -0.0671 | |||
| STT / State Street Corporation | 0.00 | -6.90 | 0.06 | 10.91 | 0.5436 | 0.0383 | |||
| EXR / Extra Space Storage Inc. | 0.00 | -0.72 | 0.06 | -1.64 | 0.5367 | -0.0229 | |||
| IRM / Iron Mountain Incorporated | 0.00 | -8.70 | 0.06 | 9.09 | 0.5316 | 0.0296 | |||
| OWL / Blue Owl Capital Inc. | 0.00 | -0.73 | 0.06 | -4.84 | 0.5283 | -0.0423 | |||
| FITB / Fifth Third Bancorp | 0.00 | -0.28 | 0.06 | 5.36 | 0.5239 | 0.0093 | |||
| RJF / Raymond James Financial, Inc. | 0.00 | -3.27 | 0.06 | 7.27 | 0.5205 | 0.0196 | |||
| VTR / Ventas, Inc. | 0.00 | 4.74 | 0.06 | -3.33 | 0.5171 | -0.0355 | |||
| AVB / AvalonBay Communities, Inc. | 0.00 | 1.06 | 0.06 | -3.33 | 0.5148 | -0.0374 | |||
| SYF / Synchrony Financial | 0.00 | -9.02 | 0.06 | 14.00 | 0.5100 | 0.0529 | |||
| NTRS / Northern Trust Corporation | 0.00 | -6.00 | 0.06 | 21.28 | 0.5074 | 0.0757 | |||
| SBAC / SBA Communications Corporation | 0.00 | -2.44 | 0.06 | 3.70 | 0.4968 | 0.0065 | |||
| TOST / Toast, Inc. | 0.00 | -11.90 | 0.06 | 19.15 | 0.4942 | 0.0624 | |||
| HBAN / Huntington Bancshares Incorporated | 0.00 | -4.38 | 0.06 | 5.77 | 0.4908 | 0.0183 | |||
| CBOE / Cboe Global Markets, Inc. | 0.00 | -2.48 | 0.06 | 1.85 | 0.4851 | -0.0110 | |||
| EQR / Equity Residential | 0.00 | -0.25 | 0.05 | -7.02 | 0.4753 | -0.0441 | |||
| CINF / Cincinnati Financial Corporation | 0.00 | -1.39 | 0.05 | 0.00 | 0.4673 | -0.0158 | |||
| SOFI / SoFi Technologies, Inc. | 0.00 | -11.53 | 0.05 | 36.84 | 0.4668 | 0.1204 | |||
| RF / Regions Financial Corporation | 0.00 | -1.37 | 0.05 | 6.12 | 0.4638 | 0.0173 | |||
| AFRM / Affirm Holdings, Inc. | 0.00 | -12.21 | 0.05 | 36.84 | 0.4601 | 0.1080 | |||
| CPAY / Corpay, Inc. | 0.00 | -0.65 | 0.05 | -5.56 | 0.4504 | -0.0393 | |||
| TROW / T. Rowe Price Group, Inc. | 0.00 | -0.38 | 0.05 | 4.17 | 0.4491 | 0.0080 | |||
| LPLA / LPL Financial Holdings Inc. | 0.00 | -10.00 | 0.05 | 2.04 | 0.4462 | 0.0016 | |||
| WRB / W. R. Berkley Corporation | 0.00 | -6.92 | 0.05 | -3.85 | 0.4443 | -0.0309 | |||
| KEY / KeyCorp | 0.00 | -2.04 | 0.05 | 6.38 | 0.4428 | 0.0163 | |||
| GPN / Global Payments Inc. | 0.00 | 10.34 | 0.05 | -9.26 | 0.4367 | -0.0610 | |||
| CFG / Citizens Financial Group, Inc. | 0.00 | -0.45 | 0.05 | 8.89 | 0.4359 | 0.0239 | |||
| EQH / Equitable Holdings, Inc. | 0.00 | -2.55 | 0.05 | 4.44 | 0.4164 | 0.0086 | |||
| PFG / Principal Financial Group, Inc. | 0.00 | 3.85 | 0.05 | -2.08 | 0.4159 | -0.0213 | |||
| INVH / Invitation Homes Inc. | 0.00 | -0.83 | 0.05 | -8.00 | 0.4137 | -0.0419 | |||
| TPG / TPG Inc. | 0.00 | -4.72 | 0.05 | 4.55 | 0.4110 | 0.0101 | |||
| WY / Weyerhaeuser Company | 0.00 | 4.22 | 0.05 | -8.00 | 0.4078 | -0.0506 | |||
| MAA / Mid-America Apartment Communities, Inc. | 0.00 | 3.72 | 0.05 | -8.16 | 0.4005 | -0.0489 | |||
| DE000C4SA6R6 / EURO STOXX 50 Index | 0.04 | 0.3959 | 0.3959 | ||||||
| SUI / Sun Communities, Inc. | 0.00 | 0.86 | 0.04 | 0.00 | 0.3902 | -0.0142 | |||
| ARCC / Ares Capital Corporation | 0.00 | 0.88 | 0.04 | 0.00 | 0.3778 | -0.0106 | |||
| EWBC / East West Bancorp, Inc. | 0.00 | -4.09 | 0.04 | 7.69 | 0.3756 | 0.0178 | |||
| CG / The Carlyle Group Inc. | 0.00 | -8.37 | 0.04 | 7.89 | 0.3670 | 0.0179 | |||
| KIM / Kimco Realty Corporation | 0.00 | -0.36 | 0.04 | 0.00 | 0.3628 | -0.0154 | |||
| REG / Regency Centers Corporation | 0.00 | 1.07 | 0.04 | -2.44 | 0.3547 | -0.0188 | |||
| UDR / UDR, Inc. | 0.00 | 1.87 | 0.04 | -6.98 | 0.3527 | -0.0410 | |||
| JKHY / Jack Henry & Associates, Inc. | 0.00 | 0.00 | 0.04 | -2.50 | 0.3526 | -0.0147 | |||
| ARE / Alexandria Real Estate Equities, Inc. | 0.00 | 17.07 | 0.04 | -9.52 | 0.3425 | -0.0405 | |||
| LAMR / Lamar Advertising Company | 0.00 | -3.32 | 0.04 | 2.70 | 0.3423 | 0.0011 | |||
| DOC / Healthpeak Properties, Inc. | 0.00 | 8.52 | 0.04 | -7.32 | 0.3402 | -0.0319 | |||
| GLPI / Gaming and Leisure Properties, Inc. | 0.00 | 3.26 | 0.04 | -5.00 | 0.3390 | -0.0290 | |||
| ALLY / Ally Financial Inc. | 0.00 | -4.38 | 0.04 | 2.78 | 0.3299 | -0.0021 | |||
| FHN / First Horizon Corporation | 0.00 | -3.40 | 0.04 | 5.71 | 0.3294 | 0.0084 | |||
| CPT / Camden Property Trust | 0.00 | 0.00 | 0.04 | -7.50 | 0.3278 | -0.0379 | |||
| AMH / American Homes 4 Rent | 0.00 | -2.01 | 0.04 | -7.69 | 0.3259 | -0.0324 | |||
| NLY / Annaly Capital Management, Inc. | 0.00 | 8.27 | 0.04 | 0.00 | 0.3213 | -0.0079 | |||
| SEIC / SEI Investments Company | 0.00 | -7.74 | 0.04 | 5.88 | 0.3208 | 0.0120 | |||
| ELS / Equity LifeStyle Properties, Inc. | 0.00 | 3.76 | 0.04 | -5.41 | 0.3147 | -0.0225 | |||
| HST / Host Hotels & Resorts, Inc. | 0.00 | -2.41 | 0.04 | 6.06 | 0.3129 | 0.0080 | |||
| BXP / Boston Properties, Inc. | 0.00 | -1.54 | 0.03 | -2.86 | 0.3051 | -0.0121 | |||
| US21871X1090 / Corebridge Financial, Inc. | 0.00 | -1.64 | 0.03 | 13.33 | 0.3007 | 0.0213 | |||
| AGNC / AGNC Investment Corp. | 0.00 | 10.33 | 0.03 | 6.45 | 0.2923 | 0.0084 | |||
| FOUR / Shift4 Payments, Inc. | 0.00 | -8.74 | 0.03 | 13.79 | 0.2918 | 0.0208 | |||
| WAL / Western Alliance Bancorporation | 0.00 | 2.94 | 0.03 | 3.23 | 0.2887 | 0.0047 | |||
| COOP / Mr. Cooper Group Inc. | 0.00 | 0.03 | 0.2828 | 0.2828 | |||||
| JEF / Jefferies Financial Group Inc. | 0.00 | 0.35 | 0.03 | 3.33 | 0.2796 | -0.0009 | |||
| CMA / Comerica Incorporated | 0.00 | 1.72 | 0.03 | 3.33 | 0.2792 | -0.0001 | |||
| ZION / Zions Bancorporation, National Association | 0.00 | -0.33 | 0.03 | 3.33 | 0.2774 | 0.0028 | |||
| CBSH / Commerce Bancshares, Inc. | 0.00 | -0.98 | 0.03 | 0.00 | 0.2767 | -0.0108 | |||
| REXR / Rexford Industrial Realty, Inc. | 0.00 | 6.14 | 0.03 | -3.12 | 0.2762 | -0.0182 | |||
| BEN / Franklin Resources, Inc. | 0.00 | -8.16 | 0.03 | 11.11 | 0.2722 | 0.0263 | |||
| MKTX / MarketAxess Holdings Inc. | 0.00 | -3.50 | 0.03 | 0.00 | 0.2717 | -0.0086 | |||
| UMBF / UMB Financial Corporation | 0.00 | 2.51 | 0.03 | 7.14 | 0.2651 | 0.0096 | |||
| 3IW / Invesco Ltd. | 0.00 | 4.67 | 0.03 | 11.11 | 0.2651 | 0.0147 | |||
| ONB / Old National Bancorp | 0.00 | 0.36 | 0.03 | 0.00 | 0.2590 | -0.0044 | |||
| VIRT / Virtu Financial, Inc. | 0.00 | -8.82 | 0.03 | 7.41 | 0.2570 | 0.0104 | |||
| SLM / SLM Corporation | 0.00 | -4.17 | 0.03 | 7.69 | 0.2523 | 0.0099 | |||
| UPST / Upstart Holdings, Inc. | 0.00 | -6.56 | 0.03 | 28.57 | 0.2434 | 0.0529 | |||
| HLNE / Hamilton Lane Incorporated | 0.00 | 27.27 | 0.03 | 19.05 | 0.2280 | 0.0354 | |||
| OZK / Bank OZK | 0.00 | -1.47 | 0.03 | 8.70 | 0.2228 | 0.0082 | |||
| COLB / Columbia Banking System, Inc. | 0.00 | 3.85 | 0.02 | -4.00 | 0.2170 | -0.0121 | |||
| SBRA / Sabra Health Care REIT, Inc. | 0.00 | -2.88 | 0.02 | 4.55 | 0.2030 | -0.0005 | |||
| VLY / Valley National Bancorp | 0.00 | -0.27 | 0.02 | 0.00 | 0.2024 | -0.0053 | |||
| ERIE / Erie Indemnity Company | 0.00 | 34.78 | 0.02 | 10.53 | 0.1895 | 0.0149 | |||
| PNFP / Pinnacle Financial Partners, Inc. | 0.00 | -5.42 | 0.02 | 0.00 | 0.1869 | -0.0082 | |||
| FCNCA / First Citizens BancShares, Inc. | 0.00 | -16.67 | 0.02 | -13.64 | 0.1725 | -0.0291 | |||
| Barclays Capital, Inc. / RA (N/A) | 0.02 | 0.1708 | 0.1708 | ||||||
| LINE / Lineage, Inc. | 0.00 | 23.86 | 0.02 | -10.00 | 0.1673 | -0.0197 | |||
| WTFC / Wintrust Financial Corporation | 0.00 | -17.30 | 0.02 | -10.00 | 0.1672 | -0.0213 | |||
| BofA Securities, Inc. / RA (N/A) | 0.02 | 0.1649 | 0.1649 | ||||||
| SIGI / Selective Insurance Group, Inc. | 0.00 | -27.96 | 0.02 | -32.00 | 0.1535 | -0.0779 |