Statistik Asas
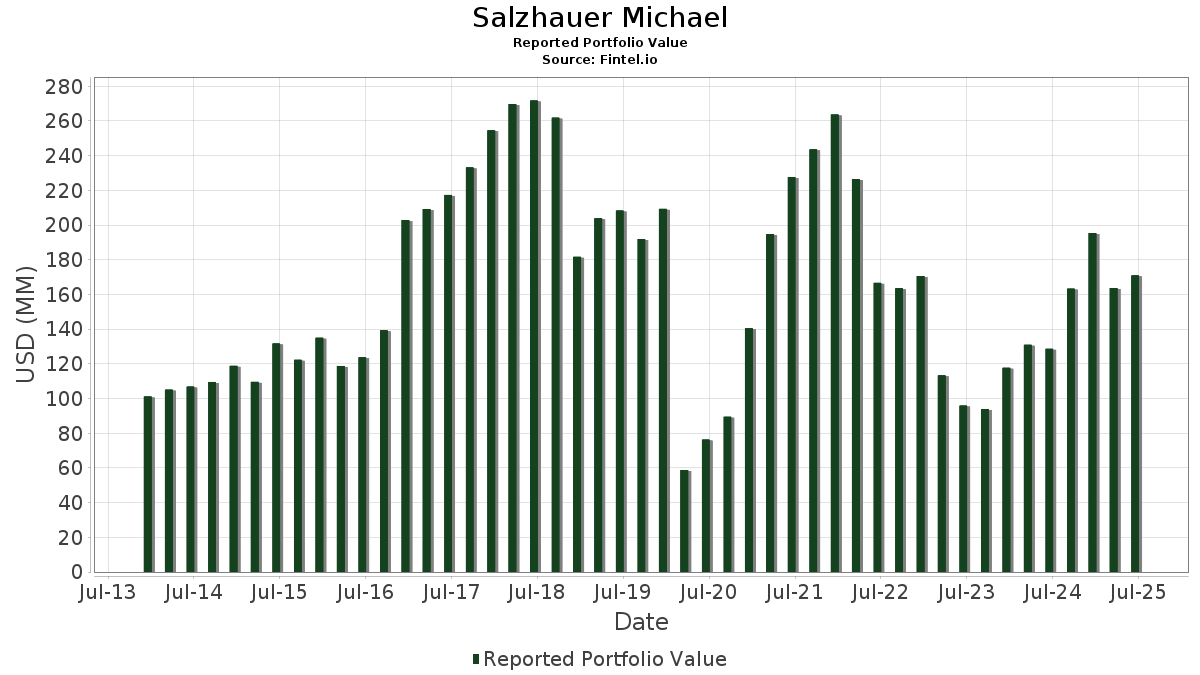
| Nilai Portfolio | $ 170,931,869 |
| Kedudukan Semasa | 80 |
Pegangan Terkini, Prestasi, AUM (dari 13F, 13D)
Salzhauer Michael telah mendedahkan 80 jumlah pegangan dalam pemfailan SEC terkini mereka. Nilai portfolio terkini dikira sebagai $ 170,931,869 USD. Aset Sebenar Di Bawah Pengurusan (AUM) ialah nilai ini ditambah dengan tunai (yang tidak didedahkan). Pegangan teratas Salzhauer Michael ialah Bank of America Corporation (US:BAC) , Wells Fargo & Company (US:WFC) , Primis Financial Corp. (US:FRST) , Synovus Financial Corp. (US:SNV) , and SmartFinancial, Inc. (US:SMBK) . Kedudukan baharu Salzhauer Michael termasuk UWM Holdings Corporation (US:UWMC) , Verizon Communications Inc. (US:VZ) , Carter Bankshares, Inc. (US:CARE) , UWM Holdings Corporation (US:UWMC) , and Cue Biopharma, Inc. (US:CUE) .
Kenaikan Teratas Suku Tahun Ini
Kami menggunakan perubahan dalam peruntukan portfolio kerana ini adalah metrik yang paling bermakna. Perubahan boleh disebabkan oleh perdagangan atau perubahan dalam harga saham.
| Sekuriti | Saham (MM) |
Nilai (MM$) |
Portfolio % | ΔPortfolio % |
|---|---|---|---|---|
| 0.50 | 5.90 | 3.4530 | 3.4530 | |
| 0.70 | 4.44 | 2.5972 | 2.5972 | |
| 0.04 | 3.48 | 2.0376 | 1.0196 | |
| 0.01 | 2.83 | 1.6560 | 0.8083 | |
| 0.08 | 0.92 | 0.5366 | 0.5366 | |
| 0.09 | 3.01 | 1.7596 | 0.5052 | |
| 0.22 | 0.58 | 0.3411 | 0.3411 | |
| 0.76 | 8.23 | 4.8169 | 0.2941 | |
| 0.05 | 0.35 | 0.2029 | 0.2029 | |
| 0.02 | 0.28 | 0.1616 | 0.1616 |
Penurunan Teratas Suku Tahun Ini
Kami menggunakan perubahan dalam peruntukan portfolio kerana ini adalah metrik yang paling bermakna. Perubahan boleh disebabkan oleh perdagangan atau perubahan dalam harga saham.
| Sekuriti | Saham (MM) |
Nilai (MM$) |
Portfolio % | ΔPortfolio % |
|---|---|---|---|---|
| 0.78 | 36.77 | 21.5119 | -1.6598 | |
| 0.10 | 8.39 | 4.9079 | -1.0631 | |
| 0.03 | 1.83 | 1.0678 | -0.7407 | |
| 0.04 | 4.07 | 2.3794 | -0.6859 | |
| 0.07 | 6.29 | 3.6801 | -0.6849 | |
| 0.01 | 0.60 | 0.3534 | -0.6168 | |
| 0.46 | 6.44 | 3.7690 | -0.4800 | |
| 0.14 | 4.02 | 2.3489 | -0.4580 | |
| 0.06 | 2.46 | 1.4418 | -0.3777 | |
| 0.05 | 1.12 | 0.6576 | -0.2856 |
13F dan Pemfailan Dana
Borang ini telah difailkan pada 2025-08-14 untuk tempoh pelaporan 2025-06-30. Klik ikon pautan untuk melihat sejarah transaksi penuh.
Tingkatkan untuk membuka data premium dan eksport ke Excel ![]() .
.
| Sekuriti | Jenis | Purata Harga Saham | Saham (MM) |
ΔSaham (%) |
ΔSaham (%) |
Nilai ($MM) |
Portfolio (%) |
ΔPortfolio (%) |
|
|---|---|---|---|---|---|---|---|---|---|
| BAC / Bank of America Corporation | 0.78 | -53.92 | 36.77 | -3.07 | 21.5119 | -1.6598 | |||
| WFC / Wells Fargo & Company | 0.10 | -19.60 | 8.39 | -14.17 | 4.9079 | -1.0631 | |||
| FRST / Primis Financial Corp. | 0.76 | 0.13 | 8.23 | 11.20 | 4.8169 | 0.2941 | |||
| SNV / Synovus Financial Corp. | 0.16 | -6.89 | 8.13 | 3.09 | 4.7571 | -0.0612 | |||
| SMBK / SmartFinancial, Inc. | 0.23 | -5.53 | 7.63 | 2.68 | 4.4644 | -0.0757 | |||
| BANC / Banc of California, Inc. | 0.46 | -6.46 | 6.44 | -7.38 | 3.7690 | -0.4800 | |||
| C / Citigroup Inc. | 0.07 | -42.13 | 6.29 | -11.97 | 3.6801 | -0.6849 | |||
| C / Citigroup Inc. | Call | 0.50 | 5.90 | 3.4530 | 3.4530 | ||||
| SBCF / Seacoast Banking Corporation of Florida | 0.19 | 0.57 | 5.13 | 7.96 | 3.0001 | 0.0985 | |||
| BAC / Bank of America Corporation | Call | 0.70 | 4.44 | 2.5972 | 2.5972 | ||||
| PNFP / Pinnacle Financial Partners, Inc. | 0.04 | -22.16 | 4.07 | -18.95 | 2.3794 | -0.6859 | |||
| PGC / Peapack-Gladstone Financial Corporation | 0.14 | -12.16 | 4.02 | -12.62 | 2.3489 | -0.4580 | |||
| WAL / Western Alliance Bancorporation | 0.04 | 105.92 | 3.48 | 109.00 | 2.0376 | 1.0196 | |||
| FSUN / FirstSun Capital Bancorp | 0.09 | 52.37 | 3.01 | 46.47 | 1.7596 | 0.5052 | |||
| SSB / SouthState Corporation | 0.03 | -4.04 | 2.91 | -4.85 | 1.7003 | -0.1657 | |||
| MCB / Metropolitan Bank Holding Corp. | 0.04 | -10.19 | 2.84 | 12.26 | 1.6613 | 0.1164 | |||
| COF / Capital One Financial Corporation | 0.01 | 71.91 | 2.83 | 104.04 | 1.6560 | 0.8083 | |||
| FBK / FB Financial Corporation | 0.06 | -4.59 | 2.66 | -6.80 | 1.5555 | -0.1867 | |||
| TFC / Truist Financial Corporation | 0.06 | -20.80 | 2.46 | -17.26 | 1.4418 | -0.3777 | |||
| PNC / The PNC Financial Services Group, Inc. | 0.01 | -16.11 | 2.27 | -11.00 | 1.3257 | -0.2300 | |||
| WBS / Webster Financial Corporation | 0.04 | -3.44 | 2.20 | 2.28 | 1.2869 | -0.0269 | |||
| HTB / HomeTrust Bancshares, Inc. | 0.05 | 11.63 | 1.91 | 21.88 | 1.1181 | 0.1598 | |||
| CMA / Comerica Incorporated | 0.03 | -27.78 | 1.83 | -38.34 | 1.0678 | -0.7407 | |||
| VBTX / Veritex Holdings, Inc. | 0.07 | 9.77 | 1.70 | 14.71 | 0.9950 | 0.0895 | |||
| DCOM / Dime Community Bancshares, Inc. | 0.06 | -14.05 | 1.68 | -16.96 | 0.9803 | -0.2521 | |||
| RF / Regions Financial Corporation | 0.07 | -4.07 | 1.60 | 3.83 | 0.9350 | -0.0052 | |||
| CNOB / ConnectOne Bancorp, Inc. | 0.07 | -13.04 | 1.54 | -17.17 | 0.9037 | -0.2352 | |||
| VABK / Virginia National Bankshares Corporation | 0.04 | -0.05 | 1.52 | 2.50 | 0.8882 | -0.0166 | |||
| JPM / JPMorgan Chase & Co. | 0.00 | -9.67 | 1.35 | 6.79 | 0.7917 | 0.0173 | |||
| HWC / Hancock Whitney Corporation | 0.02 | -4.40 | 1.33 | 4.57 | 0.7768 | 0.0016 | |||
| TCBX / Third Coast Bancshares, Inc. | 0.04 | 0.00 | 1.23 | -2.15 | 0.7201 | -0.0479 | |||
| SHBI / Shore Bancshares, Inc. | 0.07 | 0.00 | 1.13 | 16.10 | 0.6627 | 0.0667 | |||
| PFS / Provident Financial Services, Inc. | 0.06 | -8.19 | 1.13 | -6.31 | 0.6610 | -0.0753 | |||
| HAFC / Hanmi Financial Corporation | 0.05 | -33.16 | 1.12 | -27.20 | 0.6576 | -0.2856 | |||
| WSFS / WSFS Financial Corporation | 0.02 | -9.29 | 1.06 | -3.80 | 0.6219 | -0.0532 | |||
| SSBI / Summit State Bank | 0.09 | -3.69 | 1.00 | 13.09 | 0.5866 | 0.0451 | |||
| TOWN / TowneBank | 0.03 | -4.79 | 0.99 | -4.79 | 0.5813 | -0.0564 | |||
| KEY / KeyCorp | 0.06 | -49.76 | 0.97 | 6.49 | 0.5668 | 0.0110 | |||
| FHN / First Horizon Corporation | 0.04 | 15.02 | 0.95 | -20.52 | 0.5581 | -0.1748 | |||
| WFC / Wells Fargo & Company | Call | 0.08 | 0.92 | 0.5366 | 0.5366 | ||||
| CFG / Citizens Financial Group, Inc. | 0.02 | -3.68 | 0.83 | 5.19 | 0.4867 | 0.0037 | |||
| AAPL / Apple Inc. | 0.00 | 0.00 | 0.70 | -7.64 | 0.4103 | -0.0535 | |||
| SPFI / South Plains Financial, Inc. | 0.02 | 0.00 | 0.67 | 8.89 | 0.3944 | 0.0160 | |||
| CFBK / CF Bankshares Inc. | 0.03 | 0.00 | 0.64 | 8.83 | 0.3753 | 0.0150 | |||
| BPOP / Popular, Inc. | 0.01 | -68.12 | 0.60 | -61.96 | 0.3534 | -0.6168 | |||
| BAFN / BayFirst Financial Corp. | 0.04 | -5.57 | 0.59 | -20.91 | 0.3475 | -0.1117 | |||
| FHN / First Horizon Corporation | Call | 0.22 | 0.58 | 0.3411 | 0.3411 | ||||
| MS / Morgan Stanley | 0.00 | -2.22 | 0.58 | 18.09 | 0.3404 | 0.0393 | |||
| MET / MetLife, Inc. | 0.01 | 0.00 | 0.55 | 0.18 | 0.3240 | -0.0137 | |||
| CBFV / CB Financial Services, Inc. | 0.02 | 0.00 | 0.55 | 0.18 | 0.3202 | -0.0135 | |||
| COLB / Columbia Banking System, Inc. | 0.02 | 0.00 | 0.53 | -6.19 | 0.3103 | -0.0353 | |||
| USCB / USCB Financial Holdings, Inc. | 0.03 | 8.40 | 0.52 | -3.50 | 0.3070 | -0.0248 | |||
| AUB / Atlantic Union Bankshares Corporation | 0.02 | -27.01 | 0.52 | -26.73 | 0.3034 | -0.1287 | |||
| UCB / United Community Banks, Inc. | 0.02 | 0.00 | 0.51 | 5.85 | 0.2968 | 0.0042 | |||
| XOM / Exxon Mobil Corporation | 0.00 | 0.00 | 0.49 | -9.35 | 0.2838 | -0.0431 | |||
| ABCB / Ameris Bancorp | 0.01 | -40.40 | 0.48 | -33.01 | 0.2792 | -0.1560 | |||
| CIVB / Civista Bancshares, Inc. | 0.02 | 0.00 | 0.45 | 18.73 | 0.2636 | 0.0318 | |||
| ORRF / Orrstown Financial Services, Inc. | 0.01 | -8.44 | 0.44 | -2.89 | 0.2557 | -0.0192 | |||
| QCRH / QCR Holdings, Inc. | 0.01 | 0.00 | 0.44 | -4.80 | 0.2553 | -0.0247 | |||
| T / AT&T Inc. | 0.01 | 20.97 | 0.43 | 24.00 | 0.2539 | 0.0398 | |||
| CMA / Comerica Incorporated | Call | 0.05 | 0.35 | 0.2029 | 0.2029 | ||||
| HBAN / Huntington Bancshares Incorporated | 0.02 | 32.78 | 0.32 | 48.37 | 0.1867 | 0.0552 | |||
| UWMC / UWM Holdings Corporation | 0.07 | 0.29 | 127.56 | 0.1695 | 0.0917 | ||||
| HIG / The Hartford Insurance Group, Inc. | 0.00 | 0.00 | 0.28 | 2.53 | 0.1667 | -0.0030 | |||
| V / Visa Inc. | 0.00 | 0.00 | 0.28 | 1.43 | 0.1662 | -0.0051 | |||
| BMY / Bristol-Myers Squibb Company | 0.01 | 0.00 | 0.28 | -24.13 | 0.1657 | -0.0622 | |||
| AFBI / Affinity Bancshares, Inc. | 0.02 | 0.28 | 0.1616 | 0.1616 | |||||
| ZION / Zions Bancorporation, National Association | 0.01 | 0.00 | 0.27 | 4.25 | 0.1580 | -0.0004 | |||
| BOTJ / Bank of the James Financial Group, Inc. | 0.02 | 0.00 | 0.26 | -5.07 | 0.1537 | -0.0150 | |||
| MSGS / Madison Square Garden Sports Corp. | 0.00 | 0.26 | 0.1520 | 0.1520 | |||||
| ALL / The Allstate Corporation | 0.00 | 0.00 | 0.26 | -2.63 | 0.1516 | -0.0112 | |||
| VZ / Verizon Communications Inc. | 0.01 | 0.24 | 0.1425 | 0.1425 | |||||
| CB / Chubb Limited | 0.00 | 0.00 | 0.24 | -4.03 | 0.1397 | -0.0123 | |||
| INDB / Independent Bank Corp. | 0.00 | 0.00 | 0.22 | 0.00 | 0.1298 | -0.0052 | |||
| OPBK / OP Bancorp | 0.02 | -17.17 | 0.20 | -10.55 | 0.1146 | -0.0191 | |||
| VBNK / VersaBank | 0.02 | 68.43 | 0.19 | 86.41 | 0.1126 | 0.0497 | |||
| CARE / Carter Bankshares, Inc. | 0.01 | 0.19 | 0.1090 | 0.1090 | |||||
| UWMC / UWM Holdings Corporation | Call | 0.33 | 0.17 | 0.0965 | 0.0965 | ||||
| UBFO / United Security Bancshares | 0.02 | 0.00 | 0.16 | -3.09 | 0.0920 | -0.0075 | |||
| CUE / Cue Biopharma, Inc. | 0.02 | 0.01 | 0.0064 | 0.0064 | |||||
| FDL / First Trust Exchange-Traded Fund - First Trust Morningstar Dividend Leaders Index Fund | 0.00 | -100.00 | 0.00 | 0.0000 | |||||
| AR / Antero Resources Corporation | 0.00 | -100.00 | 0.00 | 0.0000 | |||||
| ONB / Old National Bancorp | 0.00 | -100.00 | 0.00 | 0.0000 | |||||
| CBNK / Capital Bancorp, Inc. | 0.00 | -100.00 | 0.00 | 0.0000 | |||||
| MNSB / MainStreet Bancshares, Inc. | 0.00 | -100.00 | 0.00 | 0.0000 | |||||
| DVN / Devon Energy Corporation | 0.00 | -100.00 | 0.00 | 0.0000 | |||||
| QS / QuantumScape Corporation | 0.00 | -100.00 | 0.00 | 0.0000 | |||||
| AMTB / Amerant Bancorp Inc. | 0.00 | -100.00 | 0.00 | 0.0000 | |||||
| FVCB / FVCBankcorp, Inc. | 0.00 | -100.00 | 0.00 | 0.0000 |