Statistik Asas
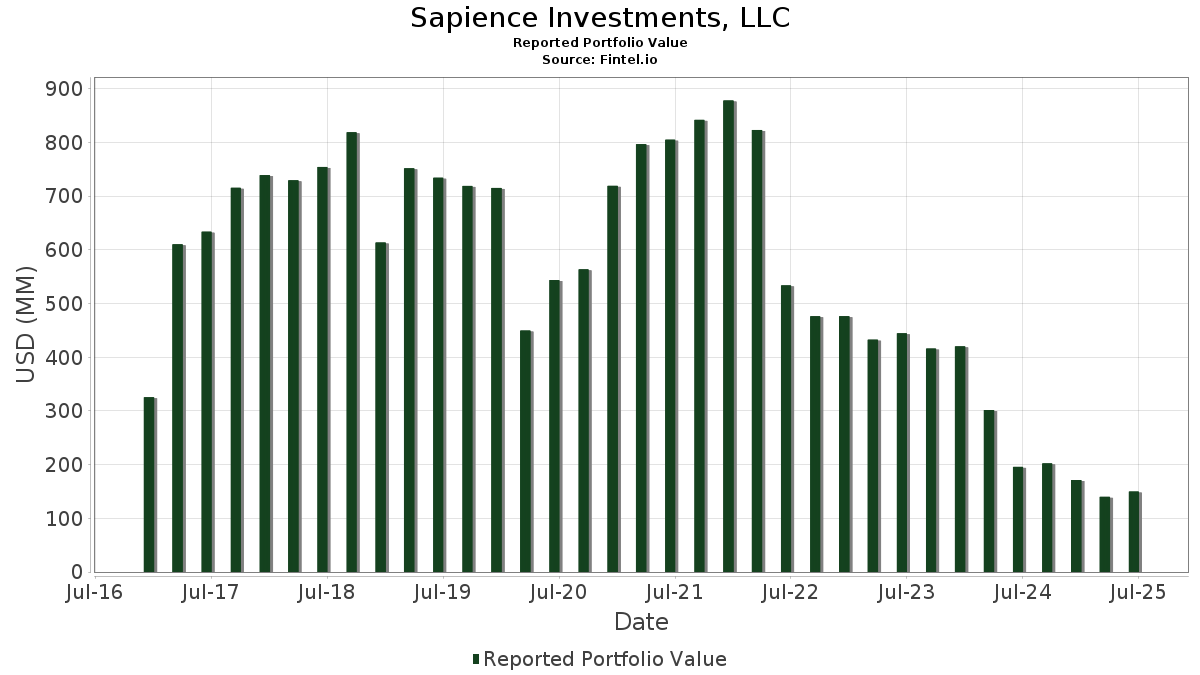
| Nilai Portfolio | $ 149,707,359 |
| Kedudukan Semasa | 89 |
Pegangan Terkini, Prestasi, AUM (dari 13F, 13D)
Sapience Investments, LLC telah mendedahkan 89 jumlah pegangan dalam pemfailan SEC terkini mereka. Nilai portfolio terkini dikira sebagai $ 149,707,359 USD. Aset Sebenar Di Bawah Pengurusan (AUM) ialah nilai ini ditambah dengan tunai (yang tidak didedahkan). Pegangan teratas Sapience Investments, LLC ialah Webster Financial Corporation (US:WBS) , Wintrust Financial Corporation (US:WTFC) , Six Flags Entertainment Corporation (US:FUN) , Papa John's International, Inc. (US:PZZA) , and Popular, Inc. (US:BPOP) . Kedudukan baharu Sapience Investments, LLC termasuk Semtech Corporation (US:SMTC) , FormFactor, Inc. (US:FORM) , Huntsman Corporation (US:HUN) , Chart Industries, Inc. (US:GTLS) , and .
Kenaikan Teratas Suku Tahun Ini
Kami menggunakan perubahan dalam peruntukan portfolio kerana ini adalah metrik yang paling bermakna. Perubahan boleh disebabkan oleh perdagangan atau perubahan dalam harga saham.
| Sekuriti | Saham (MM) |
Nilai (MM$) |
Portfolio % | ΔPortfolio % |
|---|---|---|---|---|
| 0.04 | 1.81 | 1.2112 | 1.2112 | |
| 0.05 | 1.62 | 1.0815 | 1.0815 | |
| 0.11 | 1.11 | 0.7387 | 0.7387 | |
| 0.05 | 2.25 | 1.5003 | 0.5552 | |
| 0.11 | 2.78 | 1.8557 | 0.5253 | |
| 0.09 | 2.77 | 1.8522 | 0.5098 | |
| 0.02 | 2.08 | 1.3921 | 0.4837 | |
| 0.02 | 2.93 | 1.9590 | 0.4719 | |
| 0.14 | 2.63 | 1.7575 | 0.3913 | |
| 0.19 | 2.74 | 1.8316 | 0.3236 |
Penurunan Teratas Suku Tahun Ini
Kami menggunakan perubahan dalam peruntukan portfolio kerana ini adalah metrik yang paling bermakna. Perubahan boleh disebabkan oleh perdagangan atau perubahan dalam harga saham.
| Sekuriti | Saham (MM) |
Nilai (MM$) |
Portfolio % | ΔPortfolio % |
|---|---|---|---|---|
| 0.02 | 2.74 | 1.8306 | -0.6633 | |
| 0.02 | 1.98 | 1.3216 | -0.5315 | |
| 0.22 | 2.69 | 1.7949 | -0.4493 | |
| 0.04 | 2.21 | 1.4749 | -0.3066 | |
| 0.18 | 2.90 | 1.9363 | -0.2963 | |
| 0.05 | 1.69 | 1.1302 | -0.2873 | |
| 0.30 | 1.52 | 1.0126 | -0.2867 | |
| 0.03 | 1.35 | 0.9015 | -0.2536 | |
| 0.10 | 2.22 | 1.4843 | -0.2466 | |
| 0.03 | 1.74 | 1.1644 | -0.2391 |
13F dan Pemfailan Dana
Borang ini telah difailkan pada 2025-08-14 untuk tempoh pelaporan 2025-06-30. Klik ikon pautan untuk melihat sejarah transaksi penuh.
Tingkatkan untuk membuka data premium dan eksport ke Excel ![]() .
.
| Sekuriti | Jenis | Purata Harga Saham | Saham (MM) |
ΔSaham (%) |
ΔSaham (%) |
Nilai ($MM) |
Portfolio (%) |
ΔPortfolio (%) |
|
|---|---|---|---|---|---|---|---|---|---|
| WBS / Webster Financial Corporation | 0.07 | -2.91 | 3.96 | 2.83 | 2.6458 | -0.1064 | |||
| WTFC / Wintrust Financial Corporation | 0.03 | -2.89 | 3.36 | 7.05 | 2.2420 | 0.0016 | |||
| FUN / Six Flags Entertainment Corporation | 0.10 | 35.96 | 3.08 | 15.99 | 2.0594 | 0.1600 | |||
| PZZA / Papa John's International, Inc. | 0.06 | -14.18 | 3.04 | 2.26 | 2.0282 | -0.0939 | |||
| BPOP / Popular, Inc. | 0.03 | -2.85 | 2.96 | 15.89 | 1.9784 | 0.1526 | |||
| ATI / ATI Inc. | 0.03 | -26.29 | 2.94 | 22.31 | 1.9633 | 0.2462 | |||
| ELF / e.l.f. Beauty, Inc. | 0.02 | -28.90 | 2.93 | 40.89 | 1.9590 | 0.4719 | |||
| HR / Healthcare Realty Trust Incorporated | 0.18 | -1.14 | 2.90 | -7.23 | 1.9363 | -0.2963 | |||
| GBCI / Glacier Bancorp, Inc. | 0.07 | 8.55 | 2.86 | 5.73 | 1.9123 | -0.0222 | |||
| KAR / OPENLANE, Inc. | 0.11 | 17.66 | 2.78 | 49.27 | 1.8557 | 0.5253 | |||
| PLAY / Dave & Buster's Entertainment, Inc. | 0.09 | -13.79 | 2.77 | 47.60 | 1.8522 | 0.5098 | |||
| ELAN / Elanco Animal Health Incorporated | 0.19 | -4.46 | 2.74 | 29.95 | 1.8316 | 0.3236 | |||
| ACHC / Acadia Healthcare Company, Inc. | 0.12 | 42.09 | 2.74 | 6.32 | 1.8316 | -0.0110 | |||
| IDA / IDACORP, Inc. | 0.02 | -20.95 | 2.74 | -21.49 | 1.8306 | -0.6633 | |||
| KEX / Kirby Corporation | 0.02 | -10.58 | 2.74 | 0.37 | 1.8282 | -0.1198 | |||
| IART / Integra LifeSciences Holdings Corporation | 0.22 | 53.33 | 2.69 | -14.43 | 1.7949 | -0.4493 | |||
| VSCO / Victoria's Secret & Co. | 0.14 | 38.06 | 2.63 | 37.68 | 1.7575 | 0.3913 | |||
| RDNT / RadNet, Inc. | 0.05 | -2.95 | 2.63 | 11.12 | 1.7562 | 0.0649 | |||
| LECO / Lincoln Electric Holdings, Inc. | 0.01 | 4.69 | 2.60 | 14.75 | 1.7356 | 0.1174 | |||
| VITL / Vital Farms, Inc. | 0.07 | -2.93 | 2.55 | 22.68 | 1.7060 | 0.2188 | |||
| ABCB / Ameris Bancorp | 0.04 | -3.47 | 2.47 | 8.49 | 1.6479 | 0.0229 | |||
| BANR / Banner Corporation | 0.04 | -3.46 | 2.45 | -2.89 | 1.6386 | -0.1664 | |||
| ESAB / ESAB Corporation | 0.02 | -3.46 | 2.28 | -0.13 | 1.5209 | -0.1077 | |||
| CDP / COPT Defense Properties | 0.08 | 10.68 | 2.26 | 11.95 | 1.5078 | 0.0668 | |||
| WHD / Cactus, Inc. | 0.05 | 78.01 | 2.25 | 69.89 | 1.5003 | 0.5552 | |||
| NPO / Enpro Inc. | 0.01 | -3.49 | 2.23 | 14.25 | 1.4891 | 0.0950 | |||
| EYE / National Vision Holdings, Inc. | 0.10 | -49.05 | 2.22 | -8.26 | 1.4843 | -0.2466 | |||
| BRBR / BellRing Brands, Inc. | 0.04 | 13.84 | 2.21 | -11.43 | 1.4749 | -0.3066 | |||
| VRNS / Varonis Systems, Inc. | 0.04 | -9.55 | 2.17 | 13.51 | 1.4478 | 0.0831 | |||
| NTB / The Bank of N.T. Butterfield & Son Limited | 0.05 | -3.47 | 2.14 | 9.80 | 1.4293 | 0.0371 | |||
| FRSH / Freshworks Inc. | 0.14 | 11.75 | 2.13 | 18.05 | 1.4206 | 0.1337 | |||
| FOUR / Shift4 Payments, Inc. | 0.02 | 35.16 | 2.08 | 63.97 | 1.3921 | 0.4837 | |||
| VNOM / Viper Energy, Inc. | 0.05 | 36.13 | 2.06 | 14.92 | 1.3747 | 0.0955 | |||
| HWC / Hancock Whitney Corporation | 0.04 | -3.48 | 2.04 | 5.65 | 1.3623 | -0.0174 | |||
| LITE / Lumentum Holdings Inc. | 0.02 | -13.63 | 2.03 | 31.67 | 1.3586 | 0.2551 | |||
| POST / Post Holdings, Inc. | 0.02 | -18.58 | 1.98 | -23.72 | 1.3216 | -0.5315 | |||
| CRK / Comstock Resources, Inc. | 0.07 | -10.47 | 1.95 | 21.80 | 1.3029 | 0.1586 | |||
| EVTC / EVERTEC, Inc. | 0.05 | -3.48 | 1.93 | -5.34 | 1.2913 | -0.1684 | |||
| NOG / Northern Oil and Gas, Inc. | 0.07 | 44.65 | 1.90 | 35.72 | 1.2665 | 0.2678 | |||
| BRC / Brady Corporation | 0.03 | -3.49 | 1.89 | -7.11 | 1.2646 | -0.1921 | |||
| ZWS / Zurn Elkay Water Solutions Corporation | 0.05 | 25.40 | 1.85 | 39.07 | 1.2365 | 0.2853 | |||
| AHCO / AdaptHealth Corp. | 0.20 | 7.71 | 1.84 | -6.31 | 1.2307 | -0.1744 | |||
| ESNT / Essent Group Ltd. | 0.03 | -2.72 | 1.84 | 2.33 | 1.2300 | -0.0555 | |||
| SMTC / Semtech Corporation | 0.04 | 1.81 | 1.2112 | 1.2112 | |||||
| AGO / Assured Guaranty Ltd. | 0.02 | -3.47 | 1.80 | -4.57 | 1.1998 | -0.1451 | |||
| NGVT / Ingevity Corporation | 0.04 | -3.47 | 1.79 | 5.06 | 1.1932 | -0.0218 | |||
| CWK / Cushman & Wakefield plc | 0.16 | -3.47 | 1.76 | 4.59 | 1.1730 | -0.0271 | |||
| FHB / First Hawaiian, Inc. | 0.07 | -3.47 | 1.75 | -1.41 | 1.1702 | -0.0996 | |||
| SKWD / Skyward Specialty Insurance Group, Inc. | 0.03 | -18.73 | 1.74 | -11.25 | 1.1644 | -0.2391 | |||
| KRC / Kilroy Realty Corporation | 0.05 | -18.56 | 1.69 | -14.67 | 1.1302 | -0.2873 | |||
| CXT / Crane NXT, Co. | 0.03 | -3.46 | 1.66 | 1.22 | 1.1065 | -0.0627 | |||
| FORM / FormFactor, Inc. | 0.05 | 1.62 | 1.0815 | 1.0815 | |||||
| BDC / Belden Inc. | 0.01 | -3.50 | 1.60 | 11.43 | 1.0685 | 0.0431 | |||
| OZK / Bank OZK | 0.03 | -3.48 | 1.55 | 4.51 | 1.0370 | -0.0242 | |||
| ATMU / Atmus Filtration Technologies Inc. | 0.04 | -3.47 | 1.53 | -4.31 | 1.0233 | -0.1204 | |||
| BIGC / Commerce.com, Inc. | 0.30 | -3.96 | 1.52 | -16.67 | 1.0126 | -0.2867 | |||
| TEX / Terex Corporation | 0.03 | 24.43 | 1.44 | 53.84 | 0.9644 | 0.2935 | |||
| POR / Portland General Electric Company | 0.03 | -3.48 | 1.35 | -12.09 | 0.9042 | -0.1958 | |||
| WFRD / Weatherford International plc | 0.03 | -11.13 | 1.35 | -16.52 | 0.9015 | -0.2536 | |||
| HAYW / Hayward Holdings, Inc. | 0.10 | -3.46 | 1.31 | -4.30 | 0.8768 | -0.1033 | |||
| BUSE / First Busey Corporation | 0.05 | -3.48 | 1.20 | 2.22 | 0.8007 | -0.0369 | |||
| PLYM / Plymouth Industrial REIT, Inc. | 0.07 | -3.46 | 1.14 | -4.92 | 0.7628 | -0.0951 | |||
| HUN / Huntsman Corporation | 0.11 | 1.11 | 0.7387 | 0.7387 | |||||
| RRX / Regal Rexnord Corporation | 0.00 | -0.02 | 0.67 | 27.32 | 0.4482 | 0.0716 | |||
| HAS / Hasbro, Inc. | 0.01 | -0.43 | 0.64 | 19.52 | 0.4299 | 0.0452 | |||
| JLL / Jones Lang LaSalle Incorporated | 0.00 | 48.02 | 0.62 | 52.71 | 0.4145 | 0.1241 | |||
| EWBC / East West Bancorp, Inc. | 0.01 | -0.26 | 0.61 | 12.15 | 0.4073 | 0.0190 | |||
| PR / Permian Resources Corporation | 0.04 | 6.63 | 0.61 | 4.84 | 0.4056 | -0.0082 | |||
| AME / AMETEK, Inc. | 0.00 | 0.00 | 0.59 | 5.17 | 0.3945 | -0.0069 | |||
| COHR / Coherent Corp. | 0.01 | -10.77 | 0.55 | 22.67 | 0.3691 | 0.0470 | |||
| AIT / Applied Industrial Technologies, Inc. | 0.00 | 0.00 | 0.52 | 3.19 | 0.3461 | -0.0128 | |||
| RNR / RenaissanceRe Holdings Ltd. | 0.00 | -0.43 | 0.51 | 0.79 | 0.3417 | -0.0210 | |||
| NCLH / Norwegian Cruise Line Holdings Ltd. | 0.03 | 19.77 | 0.51 | 27.89 | 0.3406 | 0.0562 | |||
| SW / Smurfit Westrock Plc | 0.01 | -0.03 | 0.51 | -4.32 | 0.3404 | -0.0400 | |||
| ESTC / Elastic N.V. | 0.01 | 36.21 | 0.50 | 29.12 | 0.3348 | 0.0570 | |||
| CPAY / Corpay, Inc. | 0.00 | 9.51 | 0.50 | 4.17 | 0.3342 | -0.0089 | |||
| WAB / Westinghouse Air Brake Technologies Corporation | 0.00 | -7.45 | 0.50 | 6.85 | 0.3334 | -0.0004 | |||
| AVTR / Avantor, Inc. | 0.04 | 49.63 | 0.49 | 24.23 | 0.3254 | 0.0452 | |||
| EQT / EQT Corporation | 0.01 | -0.02 | 0.48 | 9.03 | 0.3232 | 0.0064 | |||
| BRX / Brixmor Property Group Inc. | 0.02 | -0.02 | 0.48 | -2.03 | 0.3230 | -0.0294 | |||
| FLEX / Flex Ltd. | 0.01 | -11.70 | 0.48 | 33.43 | 0.3201 | 0.0631 | |||
| SLGN / Silgan Holdings Inc. | 0.01 | -16.23 | 0.48 | -11.17 | 0.3188 | -0.0653 | |||
| TWLO / Twilio Inc. | 0.00 | 0.47 | 0.3124 | 0.3124 | |||||
| AL / Air Lease Corporation | 0.01 | -17.52 | 0.47 | 0.00 | 0.3120 | -0.0222 | |||
| EHC / Encompass Health Corporation | 0.00 | -22.75 | 0.47 | -6.43 | 0.3115 | -0.0448 | |||
| S / SentinelOne, Inc. | 0.02 | 3.70 | 0.44 | 4.26 | 0.2948 | -0.0076 | |||
| OKTA / Okta, Inc. | 0.00 | 2.00 | 0.40 | -3.13 | 0.2690 | -0.0279 | |||
| NDSN / Nordson Corporation | 0.00 | -0.06 | 0.37 | 5.97 | 0.2497 | -0.0018 | |||
| GTLS / Chart Industries, Inc. | 0.00 | 0.27 | 0.1808 | 0.1808 | |||||
| LBRT / Liberty Energy Inc. | 0.00 | -100.00 | 0.00 | 0.0000 | |||||
| CHX / ChampionX Corporation | 0.00 | -100.00 | 0.00 | 0.0000 | |||||
| HLIO / Helios Technologies, Inc. | 0.00 | -100.00 | 0.00 | 0.0000 | |||||
| UCTT / Ultra Clean Holdings, Inc. | 0.00 | -100.00 | 0.00 | 0.0000 |