Statistik Asas
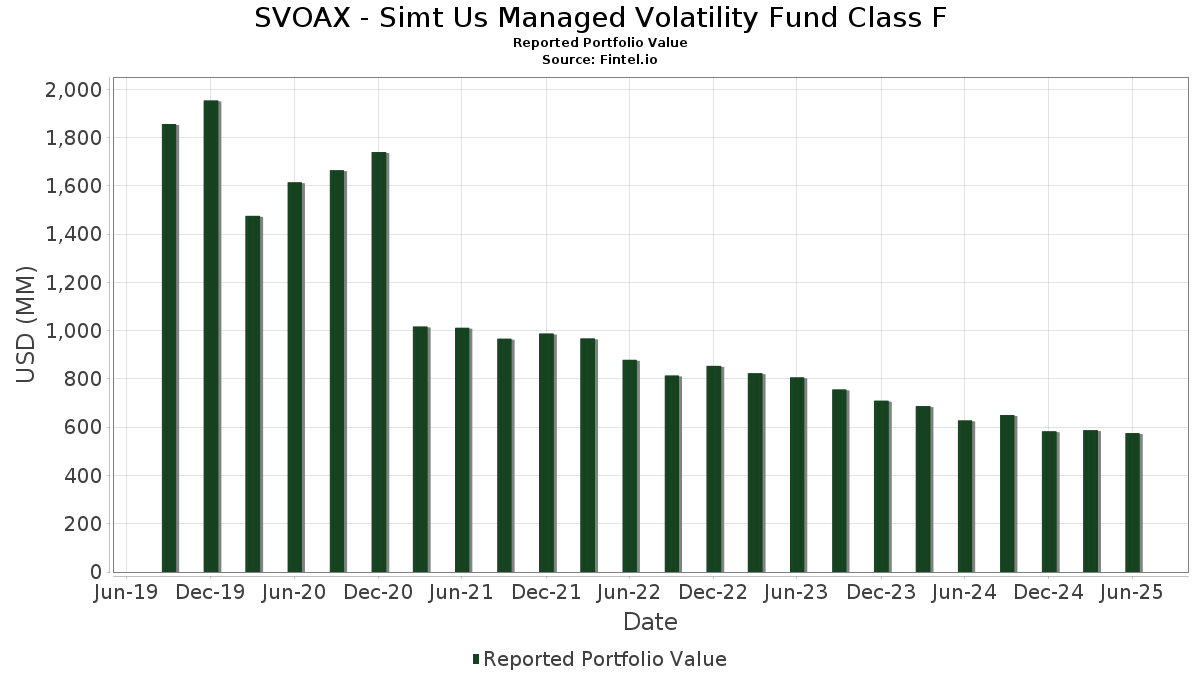
| Nilai Portfolio | $ 575,336,537 |
| Kedudukan Semasa | 268 |
Pegangan Terkini, Prestasi, AUM (dari 13F, 13D)
SVOAX - Simt Us Managed Volatility Fund Class F telah mendedahkan 268 jumlah pegangan dalam pemfailan SEC terkini mereka. Nilai portfolio terkini dikira sebagai $ 575,336,537 USD. Aset Sebenar Di Bawah Pengurusan (AUM) ialah nilai ini ditambah dengan tunai (yang tidak didedahkan). Pegangan teratas SVOAX - Simt Us Managed Volatility Fund Class F ialah AT&T Inc. (US:T) , Cisco Systems, Inc. (US:CSCO) , Verizon Communications Inc. (US:VZ) , Gilead Sciences, Inc. (US:GILD) , and Johnson & Johnson (US:JNJ) . Kedudukan baharu SVOAX - Simt Us Managed Volatility Fund Class F termasuk Zoetis Inc. (US:ZTS) , S&P Global Inc. (US:SPGI) , Moody's Corporation (US:MCO) , State Street Corporation (US:STT) , and Veeva Systems Inc. (US:VEEV) .
Kenaikan Teratas Suku Tahun Ini
Kami menggunakan perubahan dalam peruntukan portfolio kerana ini adalah metrik yang paling bermakna. Perubahan boleh disebabkan oleh perdagangan atau perubahan dalam harga saham.
| Sekuriti | Saham (MM) |
Nilai (MM$) |
Portfolio % | ΔPortfolio % |
|---|---|---|---|---|
| 0.02 | 9.28 | 1.6166 | 1.5004 | |
| 0.01 | 7.03 | 1.2253 | 0.9970 | |
| 0.05 | 7.58 | 1.3200 | 0.9064 | |
| 0.02 | 7.54 | 1.3133 | 0.8253 | |
| 0.06 | 9.31 | 1.6226 | 0.7504 | |
| 0.01 | 6.86 | 1.1956 | 0.7476 | |
| 0.07 | 6.81 | 1.1875 | 0.6539 | |
| 0.02 | 6.64 | 1.1575 | 0.6209 | |
| 0.18 | 4.44 | 0.7736 | 0.5998 | |
| 0.02 | 5.83 | 1.0165 | 0.5434 |
Penurunan Teratas Suku Tahun Ini
Kami menggunakan perubahan dalam peruntukan portfolio kerana ini adalah metrik yang paling bermakna. Perubahan boleh disebabkan oleh perdagangan atau perubahan dalam harga saham.
| Sekuriti | Saham (MM) |
Nilai (MM$) |
Portfolio % | ΔPortfolio % |
|---|---|---|---|---|
| 0.04 | 3.80 | 0.6619 | -0.7347 | |
| 0.02 | 1.14 | 0.1983 | -0.5802 | |
| 6.88 | 6.88 | 1.1984 | -0.5712 | |
| 0.00 | 0.75 | 0.1313 | -0.5627 | |
| 0.16 | 7.42 | 1.2936 | -0.5342 | |
| 0.01 | 1.57 | 0.2731 | -0.4917 | |
| 0.03 | 2.66 | 0.4639 | -0.4678 | |
| 0.00 | 0.46 | 0.0797 | -0.4349 | |
| 0.14 | 3.70 | 0.6444 | -0.4266 | |
| 0.01 | 4.79 | 0.8345 | -0.4194 |
13F dan Pemfailan Dana
Borang ini telah difailkan pada 2025-08-28 untuk tempoh pelaporan 2025-06-30. Klik ikon pautan untuk melihat sejarah transaksi penuh.
Tingkatkan untuk membuka data premium dan eksport ke Excel ![]() .
.
| Sekuriti | Jenis | Purata Harga Saham | Saham (MM) |
ΔSaham (%) |
ΔSaham (%) |
Nilai ($MM) |
Portfolio (%) |
ΔPortfolio (%) |
|
|---|---|---|---|---|---|---|---|---|---|
| T / AT&T Inc. | 0.44 | -5.29 | 12.66 | -3.09 | 2.2057 | -0.0276 | |||
| CSCO / Cisco Systems, Inc. | 0.17 | -6.65 | 12.14 | 4.96 | 2.1150 | 0.1375 | |||
| VZ / Verizon Communications Inc. | 0.26 | -4.61 | 11.33 | -9.01 | 1.9743 | -0.1548 | |||
| GILD / Gilead Sciences, Inc. | 0.09 | -18.57 | 9.60 | -19.43 | 1.6722 | -0.3643 | |||
| JNJ / Johnson & Johnson | 0.06 | 98.21 | 9.31 | 82.57 | 1.6226 | 0.7504 | |||
| MSFT / Microsoft Corporation | 0.02 | 930.44 | 9.28 | 1,266.27 | 1.6166 | 1.5004 | |||
| MO / Altria Group, Inc. | 0.16 | 15.81 | 9.19 | 13.13 | 1.6021 | 0.2124 | |||
| CMCSA / Comcast Corporation | 0.24 | 22.25 | 8.74 | 18.24 | 1.5236 | 0.2592 | |||
| EBAY / eBay Inc. | 0.10 | 40.32 | 7.78 | 54.29 | 1.3551 | 0.4931 | |||
| EA / Electronic Arts Inc. | 0.05 | 183.37 | 7.58 | 213.15 | 1.3200 | 0.9064 | |||
| V / Visa Inc. | 0.02 | 160.68 | 7.54 | 164.14 | 1.3133 | 0.8253 | |||
| BMY / Bristol-Myers Squibb Company | 0.16 | -8.49 | 7.42 | -30.55 | 1.2936 | -0.5342 | |||
| MSI / Motorola Solutions, Inc. | 0.02 | 53.32 | 7.15 | 47.26 | 1.2467 | 0.4158 | |||
| IBM / International Business Machines Corporation | 0.02 | -29.69 | 7.12 | -16.65 | 1.2410 | -0.2201 | |||
| ROP / Roper Technologies, Inc. | 0.01 | 447.68 | 7.03 | 426.67 | 1.2253 | 0.9970 | |||
| PM / Philip Morris International Inc. | 0.04 | 43.92 | 6.99 | 65.15 | 1.2179 | 0.4942 | |||
| US7839655930 / SEI DAILY INCOME TRUST GOVERNMENT FUND (#36) | 6.88 | -33.55 | 6.88 | -33.54 | 1.1984 | -0.5712 | |||
| MA / Mastercard Incorporated | 0.01 | 155.44 | 6.86 | 161.87 | 1.1956 | 0.7476 | |||
| CL / Colgate-Palmolive Company | 0.07 | 125.10 | 6.81 | 118.40 | 1.1875 | 0.6539 | |||
| FFIV / F5, Inc. | 0.02 | 91.50 | 6.64 | 111.73 | 1.1575 | 0.6209 | |||
| MRK / Merck & Co., Inc. | 0.08 | 23.51 | 6.17 | 8.92 | 1.0748 | 0.1065 | |||
| CAH / Cardinal Health, Inc. | 0.04 | -36.78 | 6.03 | -22.90 | 1.0511 | -0.2868 | |||
| DOX / Amdocs Limited | 0.07 | -29.66 | 6.03 | -29.87 | 1.0506 | -0.4192 | |||
| VRSN / VeriSign, Inc. | 0.02 | 85.35 | 5.83 | 110.88 | 1.0165 | 0.5434 | |||
| GEN / Gen Digital Inc. | 0.20 | 66.49 | 5.77 | 84.42 | 1.0047 | 0.4701 | |||
| BKNG / Booking Holdings Inc. | 0.00 | 54.95 | 5.44 | 94.77 | 0.9473 | 0.4699 | |||
| INGR / Ingredion Incorporated | 0.04 | 37.69 | 5.37 | 38.10 | 0.9350 | 0.2707 | |||
| WMT / Walmart Inc. | 0.05 | 5.61 | 5.32 | 17.62 | 0.9271 | 0.1537 | |||
| MCK / McKesson Corporation | 0.01 | -19.14 | 5.26 | -11.95 | 0.9167 | -0.1050 | |||
| FOXA / Fox Corporation | 0.09 | 7.17 | 5.11 | 6.10 | 0.8910 | 0.0670 | |||
| CVX / Chevron Corporation | 0.03 | -1.14 | 4.99 | -15.38 | 0.8694 | -0.1389 | |||
| XOM / Exxon Mobil Corporation | 0.04 | -1.12 | 4.82 | -10.37 | 0.8407 | -0.0797 | |||
| LMT / Lockheed Martin Corporation | 0.01 | -37.01 | 4.79 | -34.70 | 0.8345 | -0.4194 | |||
| AAPL / Apple Inc. | 0.02 | 43.90 | 4.72 | 32.94 | 0.8229 | 0.2154 | |||
| ABBV / AbbVie Inc. | 0.02 | 22.20 | 4.59 | 8.28 | 0.8000 | 0.0749 | |||
| CTSH / Cognizant Technology Solutions Corporation | 0.06 | -20.22 | 4.51 | -18.61 | 0.7864 | -0.1619 | |||
| KR / The Kroger Co. | 0.06 | -29.48 | 4.51 | -25.27 | 0.7858 | -0.2461 | |||
| PFE / Pfizer Inc. | 0.18 | 356.59 | 4.44 | 336.91 | 0.7736 | 0.5998 | |||
| COR / Cencora, Inc. | 0.01 | -12.71 | 4.33 | -5.89 | 0.7549 | -0.0322 | |||
| PAYX / Paychex, Inc. | 0.03 | 105.63 | 4.13 | 93.90 | 0.7204 | 0.3558 | |||
| GIS / General Mills, Inc. | 0.08 | 38.61 | 4.00 | 20.14 | 0.6976 | 0.1277 | |||
| CI / The Cigna Group | 0.01 | 1.99 | 3.97 | 2.50 | 0.6922 | 0.0294 | |||
| CTAS / Cintas Corporation | 0.02 | 69.53 | 3.88 | 83.85 | 0.6767 | 0.3155 | |||
| HIG / The Hartford Insurance Group, Inc. | 0.03 | -39.48 | 3.87 | -37.95 | 0.6751 | -0.3925 | |||
| BK / The Bank of New York Mellon Corporation | 0.04 | -57.19 | 3.80 | -53.50 | 0.6619 | -0.7347 | |||
| TMUS / T-Mobile US, Inc. | 0.02 | 59.39 | 3.70 | 42.42 | 0.6454 | 0.2006 | |||
| KHC / The Kraft Heinz Company | 0.14 | -30.42 | 3.70 | -40.96 | 0.6444 | -0.4266 | |||
| MDT / Medtronic plc | 0.04 | 76.94 | 3.54 | 71.66 | 0.6176 | 0.2645 | |||
| NFG / National Fuel Gas Company | 0.04 | -40.32 | 3.44 | -36.17 | 0.5998 | -0.3221 | |||
| ADBE / Adobe Inc. | 0.01 | 1,027.77 | 3.43 | 756.25 | 0.5968 | 0.5431 | |||
| AFL / Aflac Incorporated | 0.03 | -0.31 | 3.40 | -5.44 | 0.5933 | -0.0225 | |||
| TAP / Molson Coors Beverage Company | 0.07 | -0.36 | 3.40 | -21.27 | 0.5928 | -0.1462 | |||
| META / Meta Platforms, Inc. | 0.00 | 223.64 | 3.38 | 314.62 | 0.5882 | 0.4489 | |||
| AMZN / Amazon.com, Inc. | 0.02 | 51.13 | 3.36 | 74.30 | 0.5852 | 0.2556 | |||
| GOOGL / Alphabet Inc. | 0.02 | 243.94 | 3.31 | 292.07 | 0.5774 | 0.4329 | |||
| HRB / H&R Block, Inc. | 0.06 | -11.66 | 3.28 | -11.69 | 0.5711 | -0.0635 | |||
| ALSN / Allison Transmission Holdings, Inc. | 0.03 | -1.54 | 3.24 | -2.23 | 0.5648 | -0.0021 | |||
| HPQ / HP Inc. | 0.13 | -25.66 | 3.08 | -34.34 | 0.5362 | -0.2651 | |||
| ORI / Old Republic International Corporation | 0.08 | 0.18 | 3.06 | -1.83 | 0.5340 | 0.0003 | |||
| TJX / The TJX Companies, Inc. | 0.02 | 17.06 | 2.99 | 18.67 | 0.5206 | 0.0902 | |||
| NEU / NewMarket Corporation | 0.00 | 0.09 | 2.98 | 22.07 | 0.5188 | 0.1018 | |||
| ADM / Archer-Daniels-Midland Company | 0.06 | -24.11 | 2.94 | -16.57 | 0.5125 | -0.0903 | |||
| EXEL / Exelixis, Inc. | 0.06 | -15.34 | 2.83 | 1.07 | 0.4933 | 0.0143 | |||
| INCY / Incyte Corporation | 0.04 | 75.51 | 2.80 | 97.53 | 0.4874 | 0.2451 | |||
| NTAP / NetApp, Inc. | 0.03 | 34.40 | 2.79 | 63.06 | 0.4853 | 0.1932 | |||
| ARW / Arrow Electronics, Inc. | 0.02 | -23.33 | 2.78 | -5.90 | 0.4838 | -0.0207 | |||
| AZO / AutoZone, Inc. | 0.00 | -0.94 | 2.75 | -3.54 | 0.4793 | -0.0083 | |||
| BRK.B / Berkshire Hathaway Inc. | 0.01 | 67.72 | 2.67 | 53.01 | 0.4654 | 0.1669 | |||
| ORLY / O'Reilly Automotive, Inc. | 0.03 | 676.62 | 2.66 | -51.16 | 0.4639 | -0.4678 | |||
| AMGN / Amgen Inc. | 0.01 | 125.90 | 2.65 | 95.79 | 0.4616 | 0.2530 | |||
| EVRG / Evergy, Inc. | 0.04 | 0.39 | 2.62 | 0.34 | 0.4570 | 0.0101 | |||
| BSX / Boston Scientific Corporation | 0.02 | -0.81 | 2.62 | 5.60 | 0.4569 | 0.0324 | |||
| GWW / W.W. Grainger, Inc. | 0.00 | 0.00 | 2.57 | 5.32 | 0.4485 | 0.0306 | |||
| APH / Amphenol Corporation | 0.03 | -17.33 | 2.55 | 24.52 | 0.4442 | 0.0940 | |||
| HPE / Hewlett Packard Enterprise Company | 0.12 | -49.70 | 2.55 | -33.33 | 0.4440 | -0.2095 | |||
| DLB / Dolby Laboratories, Inc. | 0.03 | 110.60 | 2.54 | 94.71 | 0.4426 | 0.2196 | |||
| YELP / Yelp Inc. | 0.07 | 4,743.21 | 2.53 | 4,419.64 | 0.4411 | 0.4314 | |||
| S&P500 EMINI FUT SEP25 PHYSICAL INDEX FUTURE. / DE (N/A) | 2.50 | 0.4359 | 0.4359 | ||||||
| COST / Costco Wholesale Corporation | 0.00 | 447.07 | 2.50 | 511.76 | 0.4351 | 0.3721 | |||
| VRSK / Verisk Analytics, Inc. | 0.01 | 330.66 | 2.43 | 351.30 | 0.4231 | 0.3310 | |||
| KO / The Coca-Cola Company | 0.03 | 693.18 | 2.41 | 685.02 | 0.4201 | 0.3675 | |||
| GOOG / Alphabet Inc. | 0.01 | -26.74 | 2.40 | -16.81 | 0.4183 | -0.0752 | |||
| PG / The Procter & Gamble Company | 0.01 | 3,927.84 | 2.37 | 3,668.25 | 0.4138 | 0.4030 | |||
| FAST / Fastenal Company | 0.05 | 98.19 | 2.30 | 7.34 | 0.4002 | 0.0343 | |||
| AXS / AXIS Capital Holdings Limited | 0.02 | 0.14 | 2.27 | 3.71 | 0.3949 | 0.0213 | |||
| ITW / Illinois Tool Works Inc. | 0.01 | 20.42 | 2.27 | 20.03 | 0.3948 | 0.0721 | |||
| SNA / Snap-on Incorporated | 0.01 | -22.02 | 2.24 | -27.99 | 0.3900 | -0.1415 | |||
| SYK / Stryker Corporation | 0.01 | 7.19 | 2.22 | 13.93 | 0.3863 | 0.0536 | |||
| AVT / Avnet, Inc. | 0.04 | -23.92 | 2.21 | -16.02 | 0.3855 | -0.0650 | |||
| YUM / Yum! Brands, Inc. | 0.01 | -0.68 | 2.17 | -6.46 | 0.3783 | -0.0186 | |||
| GRMN / Garmin Ltd. | 0.01 | -1.00 | 2.07 | -4.84 | 0.3600 | -0.0112 | |||
| SNX / TD SYNNEX Corporation | 0.02 | -45.82 | 2.06 | -29.29 | 0.3594 | -0.1393 | |||
| DBX / Dropbox, Inc. | 0.07 | -48.39 | 2.03 | -44.76 | 0.3530 | -0.2739 | |||
| OTIS / Otis Worldwide Corporation | 0.02 | -0.98 | 2.01 | -4.98 | 0.3494 | -0.0115 | |||
| ABT / Abbott Laboratories | 0.01 | 15.70 | 2.00 | 18.62 | 0.3486 | 0.0602 | |||
| ACI / Albertsons Companies, Inc. | 0.09 | -3.88 | 1.94 | -5.96 | 0.3383 | -0.0148 | |||
| IT / Gartner, Inc. | 0.00 | -47.12 | 1.89 | -49.09 | 0.3298 | -0.3057 | |||
| ZTS / Zoetis Inc. | 0.01 | 1.89 | 0.3287 | 0.3287 | |||||
| PEP / PepsiCo, Inc. | 0.01 | 786.30 | 1.88 | 682.92 | 0.3275 | 0.2863 | |||
| NYT / The New York Times Company | 0.03 | 66.93 | 1.86 | 88.45 | 0.3243 | 0.1554 | |||
| CHD / Church & Dwight Co., Inc. | 0.02 | 204.37 | 1.86 | 165.95 | 0.3240 | 0.2043 | |||
| SPGI / S&P Global Inc. | 0.00 | 1.85 | 0.3229 | 0.3229 | |||||
| CHE / Chemed Corporation | 0.00 | -31.60 | 1.84 | -37.48 | 0.3207 | 0.1510 | |||
| ES / Eversource Energy | 0.03 | 0.37 | 1.81 | 2.85 | 0.3149 | 0.0143 | |||
| EXC / Exelon Corporation | 0.04 | 166.64 | 1.80 | 151.19 | 0.3139 | 0.1913 | |||
| SAIC / Science Applications International Corporation | 0.02 | 515.75 | 1.79 | 517.99 | 0.3114 | 0.2619 | |||
| CSGS / CSG Systems International, Inc. | 0.03 | -34.27 | 1.78 | -29.00 | 0.3102 | -0.1186 | |||
| ICE / Intercontinental Exchange, Inc. | 0.01 | -55.53 | 1.74 | -9.70 | 0.3033 | 0.0617 | |||
| EXPD / Expeditors International of Washington, Inc. | 0.01 | 28.28 | 1.70 | 21.86 | 0.2964 | 0.0578 | |||
| ADP / Automatic Data Processing, Inc. | 0.01 | -14.33 | 1.68 | 16.82 | 0.2930 | 0.1126 | |||
| OMC / Omnicom Group Inc. | 0.02 | 9.83 | 1.68 | -4.71 | 0.2927 | -0.0087 | |||
| TT / Trane Technologies plc | 0.00 | 0.00 | 1.67 | 29.84 | 0.2913 | 0.0711 | |||
| MCO / Moody's Corporation | 0.00 | 1.65 | 0.2874 | 0.2874 | |||||
| STT / State Street Corporation | 0.02 | 1.64 | 0.2854 | 0.2854 | |||||
| MDLZ / Mondelez International, Inc. | 0.02 | 427.31 | 1.64 | 443.52 | 0.2852 | 0.2372 | |||
| DOV / Dover Corporation | 0.01 | -1.11 | 1.63 | 3.17 | 0.2839 | 0.0138 | |||
| GDDY / GoDaddy Inc. | 0.01 | -55.55 | 1.63 | -55.56 | 0.2839 | -0.3430 | |||
| WU / The Western Union Company | 0.19 | -42.51 | 1.62 | -54.26 | 0.2829 | -0.3239 | |||
| ROST / Ross Stores, Inc. | 0.01 | -0.78 | 1.62 | -0.92 | 0.2829 | 0.0026 | |||
| WM / Waste Management, Inc. | 0.01 | 112.03 | 1.62 | 109.70 | 0.2826 | 0.1503 | |||
| MMC / Marsh & McLennan Companies, Inc. | 0.01 | -44.85 | 1.62 | -35.89 | 0.2815 | -0.0357 | |||
| TXT / Textron Inc. | 0.02 | -20.23 | 1.58 | -11.37 | 0.2758 | -0.0295 | |||
| VEEV / Veeva Systems Inc. | 0.01 | 1.58 | 0.2749 | 0.2749 | |||||
| HCA / HCA Healthcare, Inc. | 0.00 | 1.57 | 0.2737 | 0.2737 | |||||
| JAZZ / Jazz Pharmaceuticals plc | 0.01 | -48.98 | 1.57 | -56.39 | 0.2735 | -0.3419 | |||
| CBOE / Cboe Global Markets, Inc. | 0.01 | -66.00 | 1.57 | -64.96 | 0.2731 | -0.4917 | |||
| SYY / Sysco Corporation | 0.02 | -24.43 | 1.56 | -23.77 | 0.2724 | -0.0780 | |||
| REGN / Regeneron Pharmaceuticals, Inc. | 0.00 | 1.55 | 0.2699 | 0.2699 | |||||
| CAG / Conagra Brands, Inc. | 0.08 | -31.78 | 1.54 | -47.63 | 0.2680 | -0.2343 | |||
| TGNA / TEGNA Inc. | 0.09 | -23.73 | 1.54 | -29.84 | 0.2676 | -0.1067 | |||
| SJM / The J. M. Smucker Company | 0.02 | -0.31 | 1.53 | -17.33 | 0.2661 | -0.0498 | |||
| RSG / Republic Services, Inc. | 0.01 | 88.85 | 1.52 | 92.53 | 0.2651 | 0.1298 | |||
| SCI / Service Corporation International | 0.02 | 102.76 | 1.52 | 105.84 | 0.2641 | 0.1382 | |||
| C / Citigroup Inc. | 0.02 | -40.40 | 1.51 | -28.56 | 0.2625 | -0.0980 | |||
| IDCC / InterDigital, Inc. | 0.01 | 428.35 | 1.47 | 474.90 | 0.2556 | 0.2118 | |||
| TEL / TE Connectivity plc | 0.01 | 1.46 | 0.2543 | 0.2543 | |||||
| KMB / Kimberly-Clark Corporation | 0.01 | 218.69 | 1.44 | 188.96 | 0.2509 | 0.1657 | |||
| BOX / Box, Inc. | 0.04 | 600.41 | 1.39 | 676.54 | 0.2423 | 0.2116 | |||
| SON / Sonoco Products Company | 0.03 | 14.51 | 1.39 | 5.63 | 0.2419 | 0.0171 | |||
| CLX / The Clorox Company | 0.01 | -18.29 | 1.39 | -33.40 | 0.2417 | -0.1143 | |||
| PNW / Pinnacle West Capital Corporation | 0.02 | 0.40 | 1.37 | -5.70 | 0.2395 | -0.0097 | |||
| CF / CF Industries Holdings, Inc. | 0.01 | -17.72 | 1.36 | -3.13 | 0.2373 | -0.0031 | |||
| CARG / CarGurus, Inc. | 0.04 | 15,588.72 | 1.35 | 19,171.43 | 0.2352 | 0.2339 | |||
| WCN / Waste Connections, Inc. | 0.01 | 1.34 | 0.2331 | 0.2331 | |||||
| TSN / Tyson Foods, Inc. | 0.02 | -17.32 | 1.34 | -22.33 | 0.2329 | -0.0324 | |||
| CAJPY / Canon Inc. - Depositary Receipt (Common Stock) | 0.04 | -46.27 | 1.30 | -50.00 | 0.2260 | -0.2176 | |||
| JNPR / Juniper Networks, Inc. | 0.03 | -0.36 | 1.30 | 10.01 | 0.2260 | 0.0243 | |||
| AEP / American Electric Power Company, Inc. | 0.01 | -60.80 | 1.30 | -62.79 | 0.2259 | -0.3697 | |||
| HMC / Honda Motor Co., Ltd. - Depositary Receipt (Common Stock) | 0.04 | -47.42 | 1.29 | -44.12 | 0.2245 | -0.1698 | |||
| NMFC / New Mountain Finance Corporation | 0.12 | 1.21 | 0.2115 | 0.2115 | |||||
| CRUS / Cirrus Logic, Inc. | 0.01 | -19.40 | 1.21 | -15.66 | 0.2102 | -0.0344 | |||
| LDOS / Leidos Holdings, Inc. | 0.01 | -1.29 | 1.20 | 15.45 | 0.2096 | 0.0314 | |||
| MAT / Mattel, Inc. | 0.06 | -19.41 | 1.19 | -18.19 | 0.2069 | -0.0413 | |||
| OTEX / Open Text Corporation | 0.04 | -35.50 | 1.19 | -25.50 | 0.2068 | -0.0655 | |||
| SSNC / SS&C Technologies Holdings, Inc. | 0.01 | -0.71 | 1.16 | -1.61 | 0.2019 | 0.0006 | |||
| PTC / PTC Inc. | 0.01 | -59.05 | 1.15 | -50.19 | 0.2008 | -0.1096 | |||
| CVS / CVS Health Corporation | 0.02 | -75.45 | 1.14 | -75.00 | 0.1983 | -0.5802 | |||
| ECL / Ecolab Inc. | 0.00 | 1.13 | 0.1965 | 0.1965 | |||||
| ROL / Rollins, Inc. | 0.02 | 6.21 | 1.12 | 10.96 | 0.1959 | 0.0226 | |||
| UTHR / United Therapeutics Corporation | 0.00 | 29.95 | 1.12 | 21.08 | 0.1953 | 0.0371 | |||
| EG / Everest Group, Ltd. | 0.00 | -41.48 | 1.11 | -45.28 | 0.1941 | -0.1539 | |||
| EOG / EOG Resources, Inc. | 0.01 | 1.06 | 0.1855 | 0.1855 | |||||
| FHI / Federated Hermes, Inc. | 0.02 | -39.64 | 1.05 | -34.44 | 0.1823 | -0.0903 | |||
| DPZ / Domino's Pizza, Inc. | 0.00 | 0.00 | 1.02 | -1.92 | 0.1784 | -0.0001 | |||
| CDNAF / Canadian Tire Corporation, Limited | 0.01 | -14.77 | 1.02 | 11.50 | 0.1776 | 0.0213 | |||
| CSL / Carlisle Companies Incorporated | 0.00 | 0.00 | 1.02 | 9.60 | 0.1772 | 0.0186 | |||
| BG / Bunge Global SA | 0.01 | -54.29 | 1.00 | -51.99 | 0.1749 | -0.1825 | |||
| CM / Canadian Imperial Bank of Commerce | 0.01 | -36.49 | 0.95 | -19.98 | 0.1654 | -0.0375 | |||
| TSLX / Sixth Street Specialty Lending, Inc. | 0.04 | -38.99 | 0.92 | -35.07 | 0.1604 | -0.0821 | |||
| LEA / Lear Corporation | 0.01 | -47.65 | 0.89 | -43.69 | 0.1556 | -0.1153 | |||
| ADT / ADT Inc. | 0.10 | 0.89 | 0.1547 | 0.1547 | |||||
| EPR / EPR Properties | 0.02 | 0.88 | 0.1533 | 0.1533 | |||||
| RPRX / Royalty Pharma plc | 0.02 | -72.15 | 0.86 | -67.79 | 0.1503 | -0.3073 | |||
| AMCR / Amcor plc | 0.09 | -0.96 | 0.85 | -6.15 | 0.1488 | -0.0068 | |||
| SKM / SK Telecom Co., Ltd. - Depositary Receipt (Common Stock) | 0.04 | -38.85 | 0.84 | -32.88 | 0.1467 | -0.0676 | |||
| ZM / Zoom Communications Inc. | 0.01 | 1,008.19 | 0.83 | 1,073.24 | 0.1453 | 0.1331 | |||
| ABM / ABM Industries Incorporated | 0.02 | -11.44 | 0.83 | -11.81 | 0.1446 | -0.0161 | |||
| BWA / BorgWarner Inc. | 0.02 | -77.13 | 0.80 | -73.27 | 0.1394 | -0.3725 | |||
| MET / MetLife, Inc. | 0.01 | -16.81 | 0.80 | -16.65 | 0.1387 | -0.0246 | |||
| RS / Reliance, Inc. | 0.00 | 0.00 | 0.79 | 8.77 | 0.1384 | 0.0135 | |||
| GD / General Dynamics Corporation | 0.00 | -66.87 | 0.79 | -64.56 | 0.1377 | -0.2435 | |||
| AVY / Avery Dennison Corporation | 0.00 | 0.00 | 0.78 | -1.52 | 0.1357 | 0.0006 | |||
| MTG / MGIC Investment Corporation | 0.03 | -43.75 | 0.78 | -36.86 | 0.1354 | -0.0748 | |||
| PGR / The Progressive Corporation | 0.00 | -70.88 | 0.77 | -72.55 | 0.1334 | -0.3433 | |||
| CRM / Salesforce, Inc. | 0.00 | 0.76 | 0.1327 | 0.1327 | |||||
| CMI / Cummins Inc. | 0.00 | -82.24 | 0.75 | -81.44 | 0.1313 | -0.5627 | |||
| L / Loews Corporation | 0.01 | 0.73 | 0.1278 | 0.1278 | |||||
| MMS / Maximus, Inc. | 0.01 | 260.74 | 0.73 | 272.45 | 0.1272 | 0.0936 | |||
| ALRM / Alarm.com Holdings, Inc. | 0.01 | 0.71 | 0.1242 | 0.1242 | |||||
| NBIX / Neurocrine Biosciences, Inc. | 0.01 | -1.75 | 0.71 | 11.71 | 0.1230 | 0.0149 | |||
| CNC / Centene Corporation | 0.01 | 0.69 | 0.1201 | 0.1201 | |||||
| BKV / BKV Corporation | 0.03 | 0.67 | 0.1176 | 0.1176 | |||||
| ATR / AptarGroup, Inc. | 0.00 | 0.00 | 0.66 | 5.40 | 0.1159 | 0.0080 | |||
| NCDL / Nuveen Churchill Direct Lending Corp. | 0.04 | 0.66 | 0.1158 | 0.1158 | |||||
| SPB / Spectrum Brands Holdings, Inc. | 0.01 | 0.65 | 0.1136 | 0.1136 | |||||
| LIN / Linde plc | 0.00 | 0.63 | 0.1096 | 0.1096 | |||||
| HOLX / Hologic, Inc. | 0.01 | -25.66 | 0.63 | -21.62 | 0.1094 | -0.0275 | |||
| TM / Toyota Motor Corporation - Depositary Receipt (Common Stock) | 0.00 | -30.77 | 0.62 | -32.39 | 0.1081 | -0.0489 | |||
| INVA / Innoviva, Inc. | 0.03 | 314.75 | 0.60 | 359.23 | 0.1042 | 0.0819 | |||
| IAC / IAC Inc. | 0.02 | 0.59 | 0.1034 | 0.1034 | |||||
| ADSK / Autodesk, Inc. | 0.00 | 0.59 | 0.1027 | 0.1027 | |||||
| AON / Aon plc | 0.00 | -45.04 | 0.59 | -41.24 | 0.1023 | -0.0461 | |||
| LZB / La-Z-Boy Incorporated | 0.02 | 0.00 | 0.58 | -4.89 | 0.1017 | -0.0033 | |||
| MKC / McCormick & Company, Incorporated | 0.01 | 0.55 | 0.0952 | 0.0952 | |||||
| VTRS / Viatris Inc. | 0.06 | 0.54 | 0.0949 | 0.0949 | |||||
| FTNT / Fortinet, Inc. | 0.01 | -48.60 | 0.54 | -43.55 | 0.0938 | -0.0693 | |||
| HSTM / HealthStream, Inc. | 0.02 | 130.32 | 0.53 | 98.11 | 0.0915 | 0.0462 | |||
| G / Genpact Limited | 0.01 | -0.88 | 0.50 | -13.44 | 0.0865 | -0.0115 | |||
| TXRH / Texas Roadhouse, Inc. | 0.00 | 0.00 | 0.49 | 12.53 | 0.0861 | 0.0110 | |||
| RGLD / Royal Gold, Inc. | 0.00 | 528.83 | 0.49 | 587.32 | 0.0852 | 0.0729 | |||
| BMI / Badger Meter, Inc. | 0.00 | -34.55 | 0.47 | -15.83 | 0.0817 | -0.0134 | |||
| DT / Dynatrace, Inc. | 0.01 | 0.46 | 0.0810 | 0.0810 | |||||
| ALL / The Allstate Corporation | 0.00 | -84.37 | 0.46 | -84.81 | 0.0797 | -0.4349 | |||
| FOX / Fox Corporation | 0.01 | -73.14 | 0.44 | -73.71 | 0.0771 | -0.2105 | |||
| BMRN / BioMarin Pharmaceutical Inc. | 0.01 | 0.44 | 0.0771 | 0.0771 | |||||
| ACM / AECOM | 0.00 | 0.44 | 0.0761 | 0.0761 | |||||
| WTS / Watts Water Technologies, Inc. | 0.00 | 0.00 | 0.43 | 20.61 | 0.0755 | 0.0141 | |||
| PKG / Packaging Corporation of America | 0.00 | -29.11 | 0.43 | -32.55 | 0.0755 | -0.0343 | |||
| TRV / The Travelers Companies, Inc. | 0.00 | 0.00 | 0.41 | 1.25 | 0.0709 | 0.0021 | |||
| AME / AMETEK, Inc. | 0.00 | 0.39 | 0.0682 | 0.0682 | |||||
| DCI / Donaldson Company, Inc. | 0.01 | -1.82 | 0.37 | 1.63 | 0.0652 | 0.0022 | |||
| MUSA / Murphy USA Inc. | 0.00 | -82.76 | 0.37 | -85.09 | 0.0651 | -0.3628 | |||
| CASY / Casey's General Stores, Inc. | 0.00 | 0.00 | 0.37 | 17.46 | 0.0646 | 0.0107 | |||
| AOS / A. O. Smith Corporation | 0.01 | -1.75 | 0.37 | -1.34 | 0.0641 | 0.0003 | |||
| LOPE / Grand Canyon Education, Inc. | 0.00 | -85.43 | 0.36 | -84.10 | 0.0624 | -0.3225 | |||
| PRDO / Perdoceo Education Corporation | 0.01 | -7.08 | 0.35 | 73.04 | 0.0616 | 0.0312 | |||
| GPK / Graphic Packaging Holding Company | 0.02 | -63.60 | 0.34 | -70.48 | 0.0595 | -0.1381 | |||
| BCO / The Brink's Company | 0.00 | 50.10 | 0.33 | 121.48 | 0.0576 | 0.0404 | |||
| CVLT / Commvault Systems, Inc. | 0.00 | -9.30 | 0.32 | 0.31 | 0.0563 | 0.0012 | |||
| AFG / American Financial Group, Inc. | 0.00 | -48.58 | 0.30 | -50.66 | 0.0526 | -0.0518 | |||
| FLO / Flowers Foods, Inc. | 0.02 | -5.71 | 0.29 | -20.82 | 0.0505 | -0.0120 | |||
| KDP / Keurig Dr Pepper Inc. | 0.01 | -1.25 | 0.26 | -4.40 | 0.0455 | -0.0013 | |||
| MSM / MSC Industrial Direct Co., Inc. | 0.00 | 0.00 | 0.26 | 9.44 | 0.0446 | 0.0046 | |||
| ULS / UL Solutions Inc. | 0.00 | 0.24 | 0.0421 | 0.0421 | |||||
| AWI / Armstrong World Industries, Inc. | 0.00 | 0.00 | 0.23 | 15.35 | 0.0407 | 0.0061 | |||
| CALM / Cal-Maine Foods, Inc. | 0.00 | -32.79 | 0.23 | -26.43 | 0.0403 | -0.0134 | |||
| WRB / W. R. Berkley Corporation | 0.00 | -75.39 | 0.22 | -74.62 | 0.0381 | -0.1090 | |||
| POST / Post Holdings, Inc. | 0.00 | 0.00 | 0.21 | -6.31 | 0.0363 | -0.0017 | |||
| GNTX / Gentex Corporation | 0.01 | -1.05 | 0.21 | -6.76 | 0.0362 | -0.0018 | |||
| WDFC / WD-40 Company | 0.00 | -29.74 | 0.20 | -34.32 | 0.0347 | -0.0172 | |||
| WDAY / Workday, Inc. | 0.00 | 0.20 | 0.0342 | 0.0342 | |||||
| OGN / Organon & Co. | 0.02 | 0.00 | 0.17 | -34.88 | 0.0293 | -0.0149 | |||
| PINC / Premier, Inc. | 0.01 | -75.82 | 0.17 | -76.33 | 0.0288 | -0.0710 | |||
| WK / Workiva Inc. | 0.00 | 0.16 | 0.0285 | 0.0285 | |||||
| RHI / Robert Half Inc. | 0.00 | 0.00 | 0.16 | -24.65 | 0.0283 | -0.0086 | |||
| NTCT / NetScout Systems, Inc. | 0.01 | 0.16 | 0.0277 | 0.0277 | |||||
| LSTR / Landstar System, Inc. | 0.00 | 0.00 | 0.16 | -7.74 | 0.0272 | -0.0016 | |||
| FDP / Fresh Del Monte Produce Inc. | 0.00 | 288.66 | 0.13 | 319.35 | 0.0227 | 0.0172 | |||
| MZTI / The Marzetti Company | 0.00 | 0.00 | 0.11 | -0.87 | 0.0199 | 0.0001 | |||
| FELE / Franklin Electric Co., Inc. | 0.00 | 0.00 | 0.11 | -4.27 | 0.0195 | -0.0005 | |||
| SLRC / SLR Investment Corp. | 0.01 | 0.09 | 0.0154 | 0.0154 | |||||
| JJSF / J&J Snack Foods Corp. | 0.00 | 0.00 | 0.09 | -13.86 | 0.0152 | -0.0021 | |||
| WINA / Winmark Corporation | 0.00 | 88.60 | 0.08 | 125.00 | 0.0141 | 0.0080 | |||
| CPB / The Campbell's Company | 0.00 | 0.00 | 0.08 | -23.30 | 0.0138 | -0.0038 | |||
| REYN / Reynolds Consumer Products Inc. | 0.00 | -82.01 | 0.08 | -83.97 | 0.0132 | -0.0669 | |||
| HURN / Huron Consulting Group Inc. | 0.00 | -79.14 | 0.06 | -80.07 | 0.0103 | -0.0403 | |||
| EFSI / Eagle Financial Services, Inc. | 0.00 | 0.06 | 0.0102 | 0.0102 | |||||
| MAGN / Magnera Corporation | 0.00 | 0.00 | 0.05 | -32.89 | 0.0089 | -0.0042 | |||
| CENTA / Central Garden & Pet Company | 0.00 | 0.00 | 0.05 | -4.26 | 0.0080 | -0.0002 | |||
| CNXN / PC Connection, Inc. | 0.00 | -80.85 | 0.04 | -80.00 | 0.0074 | -0.0286 | |||
| GHC / Graham Holdings Company | 0.00 | 0.00 | 0.04 | -2.38 | 0.0073 | 0.0000 | |||
| NHC / National HealthCare Corporation | 0.00 | -66.05 | 0.03 | -60.94 | 0.0044 | -0.0067 | |||
| RGR / Sturm, Ruger & Company, Inc. | 0.00 | -84.20 | 0.02 | -85.53 | 0.0038 | -0.0223 | |||
| PRGS / Progress Software Corporation | 0.00 | -72.20 | 0.01 | -68.75 | 0.0010 | -0.0018 | |||
| DHIL / Diamond Hill Investment Group, Inc. | 0.00 | -95.26 | 0.00 | -96.15 | 0.0007 | -0.0128 | |||
| EBF / Ennis, Inc. | 0.00 | -96.36 | 0.00 | -97.14 | 0.0006 | -0.0175 | |||
| UTMD / Utah Medical Products, Inc. | 0.00 | -96.78 | 0.00 | -97.12 | 0.0006 | -0.0173 | |||
| TNC / Tennant Company | 0.00 | 0.00 | 0.00 | 0.00 | 0.0006 | -0.0000 |