Statistik Asas
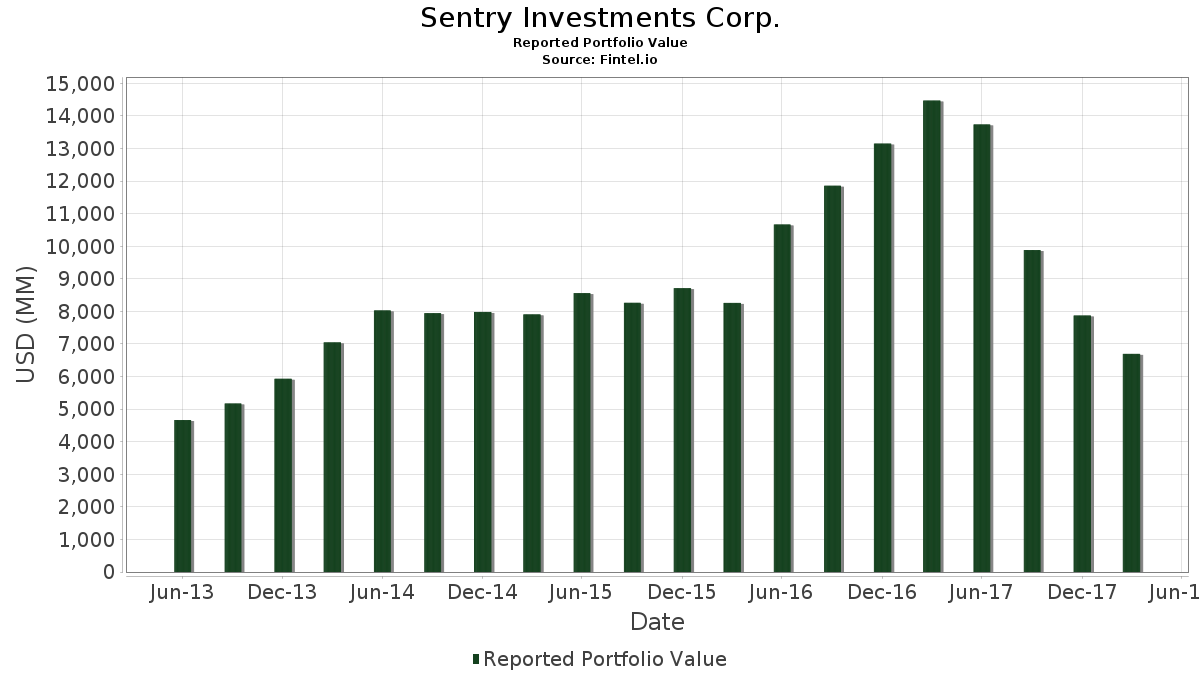
| Nilai Portfolio | $ 6,696,266,000 |
| Kedudukan Semasa | 196 |
Pegangan Terkini, Prestasi, AUM (dari 13F, 13D)
Sentry Investments Corp. telah mendedahkan 196 jumlah pegangan dalam pemfailan SEC terkini mereka. Nilai portfolio terkini dikira sebagai $ 6,696,266,000 USD. Aset Sebenar Di Bawah Pengurusan (AUM) ialah nilai ini ditambah dengan tunai (yang tidak didedahkan). Pegangan teratas Sentry Investments Corp. ialah CVS Health Corporation (US:CVS) , Brookfield Finance Inc - 4.625% NT REDEEM 16/10/2080 USD 25 (US:BAMH) , Waste Connections, Inc. (US:WCN) , Magna International Inc. (US:MGA) , and Berkshire Hathaway Inc. (US:BRK.A) . Kedudukan baharu Sentry Investments Corp. termasuk Applied Materials, Inc. (US:AMAT) , Anadarko Petroleum Corp. (US:US0325111070) , Caterpillar Inc. (US:CAT) , Parker-Hannifin Corporation (US:PH) , and Wabco Holdings, Inc. (US:WBC) .
Kenaikan Teratas Suku Tahun Ini
Kami menggunakan perubahan dalam peruntukan portfolio kerana ini adalah metrik yang paling bermakna. Perubahan boleh disebabkan oleh perdagangan atau perubahan dalam harga saham.
| Sekuriti | Saham (MM) |
Nilai (MM$) |
Portfolio % | ΔPortfolio % |
|---|---|---|---|---|
| 2.47 | 137.07 | 2.0470 | 2.0470 | |
| 3.14 | 141.87 | 2.1187 | 1.1942 | |
| 1.41 | 112.01 | 1.6727 | 1.1479 | |
| 1.07 | 59.51 | 0.8888 | 0.8888 | |
| 0.69 | 55.47 | 0.8284 | 0.8284 | |
| 1.51 | 53.41 | 0.7977 | 0.7977 | |
| 1.23 | 48.29 | 0.7211 | 0.7211 | |
| 0.30 | 47.86 | 0.7147 | 0.7147 | |
| 0.43 | 41.58 | 0.6209 | 0.6209 | |
| 2.55 | 185.37 | 2.7682 | 0.6078 |
Penurunan Teratas Suku Tahun Ini
Kami menggunakan perubahan dalam peruntukan portfolio kerana ini adalah metrik yang paling bermakna. Perubahan boleh disebabkan oleh perdagangan atau perubahan dalam harga saham.
| Sekuriti | Saham (MM) |
Nilai (MM$) |
Portfolio % | ΔPortfolio % |
|---|---|---|---|---|
| 0.20 | 9.84 | 0.1470 | -1.0882 | |
| 0.00 | 0.00 | -0.9610 | ||
| 0.00 | 0.00 | -0.7754 | ||
| 0.68 | 63.74 | 0.9519 | -0.6008 | |
| 0.52 | 73.44 | 1.0967 | -0.5719 | |
| 0.00 | 0.00 | -0.4695 | ||
| 0.00 | 0.00 | -0.4588 | ||
| 3.27 | 149.61 | 2.2342 | -0.4026 | |
| 0.36 | 35.66 | 0.5326 | -0.3753 | |
| 1.87 | 37.38 | 0.5581 | -0.3499 |
13F dan Pemfailan Dana
Borang ini telah difailkan pada 2018-05-11 untuk tempoh pelaporan 2018-03-31. Klik ikon pautan untuk melihat sejarah transaksi penuh.
Tingkatkan untuk membuka data premium dan eksport ke Excel ![]() .
.
| Sekuriti | Jenis | Purata Harga Saham | Saham (MM) |
ΔSaham (%) |
ΔSaham (%) |
Nilai ($MM) |
Portfolio (%) |
ΔPortfolio (%) |
|
|---|---|---|---|---|---|---|---|---|---|
| CVS / CVS Health Corporation | 4.45 | 3.58 | 276.87 | -11.12 | 4.1346 | 0.1785 | |||
| BAMH / Brookfield Finance Inc - 4.625% NT REDEEM 16/10/2080 USD 25 | 5.18 | -4.28 | 202.21 | -14.26 | 3.0197 | 0.0247 | |||
| WCN / Waste Connections, Inc. | 2.11 | -22.90 | 194.90 | -20.06 | 2.9106 | -0.1859 | |||
| MGA / Magna International Inc. | 2.55 | 6.97 | 185.37 | 8.97 | 2.7682 | 0.6078 | |||
| BRK.A / Berkshire Hathaway Inc. | 0.00 | -7.77 | 174.08 | -7.30 | 2.5996 | 0.2147 | |||
| GOOG / Alphabet Inc. | 0.17 | -15.73 | 173.21 | -16.91 | 2.5866 | -0.0607 | |||
| ENB / Enbridge Inc. | 3.90 | -7.23 | 158.14 | -23.54 | 2.3617 | -0.2649 | |||
| RSG / Republic Services, Inc. | 2.35 | -16.33 | 155.52 | -18.04 | 2.3225 | -0.0873 | |||
| ORCL / Oracle Corporation | 3.27 | -25.53 | 149.61 | -27.94 | 2.2342 | -0.4026 | |||
| MAXR / Maxar Technologies Inc | 2.48 | 10.82 | 147.88 | -18.40 | 2.2084 | -0.0932 | |||
| JPM / JPMorgan Chase & Co. | 1.34 | -3.14 | 147.16 | -0.40 | 2.1976 | 0.3213 | |||
| V / Visa Inc. | 1.23 | -10.97 | 146.85 | -6.60 | 2.1930 | 0.1962 | |||
| TU / TELUS Corporation | 3.14 | 105.15 | 141.87 | 94.90 | 2.1187 | 1.1942 | |||
| GIB / CGI Inc. | 2.44 | -8.31 | 140.66 | -2.73 | 2.1006 | 0.2641 | |||
| BCE / BCE Inc. | 2.47 | 3.68 | 137.07 | -4.80 | 2.0470 | 2.0470 | |||
| CI / The Cigna Group | 0.76 | 36.04 | 128.20 | 12.37 | 1.9146 | 0.4656 | |||
| CMCSA / Comcast Corporation | 3.66 | 5.54 | 125.07 | -9.96 | 1.8677 | 0.1038 | |||
| LH / Labcorp Holdings Inc. | 0.77 | -6.97 | 124.94 | -5.67 | 1.8658 | 0.1838 | |||
| MA / Mastercard Incorporated | 0.71 | -9.11 | 124.55 | 5.18 | 1.8600 | 0.3561 | |||
| CNK / Cinemark Holdings, Inc. | 3.30 | -5.87 | 124.17 | 1.83 | 1.8543 | 0.3057 | |||
| BIP / Brookfield Infrastructure Partners L.P. - Limited Partnership | 2.92 | -8.82 | 121.47 | -15.27 | 1.8140 | -0.0068 | |||
| UNH / UnitedHealth Group Incorporated | 0.55 | 14.34 | 117.69 | 10.99 | 1.7576 | 0.4109 | |||
| CP / Canadian Pacific Kansas City Limited | 0.50 | 6.63 | 114.04 | 5.49 | 1.7031 | 0.3301 | |||
| BNS / The Bank of Nova Scotia | 1.41 | 177.06 | 112.01 | 171.05 | 1.6727 | 1.1479 | |||
| PPL / Pembina Pipeline Corporation | 2.75 | 1.90 | 110.67 | -9.99 | 1.6527 | 0.0912 | |||
| LYV / Live Nation Entertainment, Inc. | 2.31 | -24.36 | 97.25 | -25.12 | 1.4523 | -0.1972 | |||
| WFC / Wells Fargo & Company | 1.81 | 3.07 | 94.81 | -10.96 | 1.4159 | 0.0636 | |||
| MSFT / Microsoft Corporation | 1.01 | -0.66 | 92.56 | 5.99 | 1.3823 | 0.2732 | |||
| BKNG / Booking Holdings Inc. | 0.04 | -41.94 | 77.21 | -30.49 | 1.1531 | -0.2577 | |||
| MCK / McKesson Corporation | 0.52 | -38.12 | 73.44 | -44.11 | 1.0967 | -0.5719 | |||
| GIL / Gildan Activewear Inc. | 1.95 | -4.07 | 72.60 | -12.10 | 1.0841 | 0.0353 | |||
| CCK / Crown Holdings, Inc. | 1.39 | -0.12 | 70.56 | -9.89 | 1.0538 | 0.0593 | |||
| OMC / Omnicom Group Inc. | 0.90 | -19.06 | 65.09 | -19.23 | 0.9720 | -0.0515 | |||
| UPS / United Parcel Service, Inc. | 0.62 | -12.71 | 65.03 | -23.32 | 0.9711 | -0.1059 | |||
| CNI / Canadian National Railway Company | 0.68 | -42.61 | 63.74 | -47.86 | 0.9519 | -0.6008 | |||
| CNQ / Canadian Natural Resources Limited | 1.92 | 97.23 | 60.48 | 73.77 | 0.9032 | 0.4612 | |||
| AMAT / Applied Materials, Inc. | 1.07 | 59.51 | 0.8888 | 0.8888 | |||||
| CTSH / Cognizant Technology Solutions Corporation | 0.69 | 9.31 | 55.47 | 23.90 | 0.8284 | 0.8284 | |||
| TJX / The TJX Companies, Inc. | 0.67 | -17.74 | 54.52 | -12.26 | 0.8142 | 0.0251 | |||
| PFE / Pfizer Inc. | 1.51 | -39.88 | 53.41 | -41.09 | 0.7977 | 0.7977 | |||
| AQN / Algonquin Power & Utilities Corp. | 4.18 | 1.32 | 53.37 | -7.97 | 0.7969 | 0.0605 | |||
| KLDX / Klondex Mines Ltd. | 16.93 | 30.62 | 51.65 | 22.21 | 0.7713 | 0.2346 | |||
| CSCO / Cisco Systems, Inc. | 1.19 | -39.19 | 50.90 | -31.91 | 0.7602 | -0.1892 | |||
| LEXEB / Liberty Expedia Holdings, Inc. Series B | 1.23 | 20.41 | 48.29 | 6.70 | 0.7211 | 0.7211 | |||
| META / Meta Platforms, Inc. | 0.30 | 27.99 | 47.86 | 15.90 | 0.7147 | 0.7147 | |||
| OTEX / Open Text Corporation | 0.99 | -17.87 | 44.42 | -17.67 | 0.6634 | -0.0218 | |||
| USB / U.S. Bancorp | 0.85 | -5.46 | 42.80 | -10.90 | 0.6392 | 0.0291 | |||
| 018490100 / Allergan plc | 0.25 | 51.75 | 41.70 | 56.11 | 0.6228 | 0.2835 | |||
| BMO / Bank of Montreal | 0.43 | 72.96 | 41.58 | 67.33 | 0.6209 | 0.6209 | |||
| AXP / American Express Company | 0.42 | -2.22 | 39.48 | -8.16 | 0.5897 | 0.0437 | |||
| TD / The Toronto-Dominion Bank | 0.54 | -21.94 | 39.33 | -22.51 | 0.5873 | -0.0572 | |||
| STN / Stantec Inc. | 1.23 | 0.87 | 39.14 | -8.80 | 0.5845 | 0.0395 | |||
| KL / Kirkland Lake Gold Ltd | 1.87 | -49.56 | 37.38 | -47.73 | 0.5581 | -0.3499 | |||
| RY / Royal Bank of Canada | 0.36 | -48.55 | 35.66 | -50.12 | 0.5326 | -0.3753 | |||
| BBU / Brookfield Business Partners L.P. - Limited Partnership | 0.96 | 2.78 | 34.65 | 7.21 | 0.5175 | 0.1070 | |||
| DOX / Amdocs Limited | 0.51 | -0.77 | 34.19 | 1.10 | 0.5105 | 0.0811 | |||
| GNOG / Golden Nugget Online Gaming Inc - Class A | 1.60 | -6.04 | 32.79 | -17.81 | 0.4897 | -0.0170 | |||
| PAG / Penske Automotive Group, Inc. | 0.74 | 92.63 | 32.64 | 78.46 | 0.4875 | 0.2552 | |||
| SPG / Simon Property Group, Inc. | 0.20 | -10.43 | 30.79 | -19.50 | 0.4599 | -0.0260 | |||
| AMT / American Tower Corporation | 0.20 | -2.75 | 29.65 | -0.93 | 0.4427 | 0.0627 | |||
| SPY / SPDR S&P 500 ETF | Put | 0.11 | 28.97 | 0.4327 | 0.4327 | ||||
| SLF / Sun Life Financial Inc. | 0.53 | 2.29 | 28.10 | 4.33 | 0.4197 | 0.0776 | |||
| US0325111070 / Anadarko Petroleum Corp. | Call | 0.46 | 27.80 | 0.4152 | 0.4152 | ||||
| FRC / First Republic Bank | 0.30 | 42.18 | 27.78 | 51.98 | 0.4149 | 0.1827 | |||
| EQIX / Equinix, Inc. | 0.07 | -4.71 | 27.49 | -12.08 | 0.4106 | 0.0134 | |||
| AXTA / Axalta Coating Systems Ltd. | 0.91 | 110.19 | 27.41 | 96.09 | 0.4094 | 0.4094 | |||
| WGL / WGL Holdings, Inc. | 0.32 | 12.26 | 26.81 | 9.40 | 0.4004 | 0.4004 | |||
| GL / Globe Life Inc. | 0.31 | -4.44 | 26.42 | -11.33 | 0.3946 | 0.0161 | |||
| SU / Suncor Energy Inc. | 0.58 | 61.62 | 25.92 | 55.80 | 0.3871 | 0.1758 | |||
| GILD / Gilead Sciences, Inc. | 0.33 | -56.78 | 25.04 | -54.52 | 0.3740 | -0.3253 | |||
| MKL / Markel Group Inc. | 0.02 | -1.42 | 24.34 | 1.27 | 0.3635 | 0.0582 | |||
| SWK / Stanley Black & Decker, Inc. | 0.16 | 341.23 | 24.27 | 298.34 | 0.3624 | 0.3624 | |||
| EQR / Equity Residential | 0.36 | -12.18 | 21.95 | -15.14 | 0.3279 | -0.0007 | |||
| AGI / Alamos Gold Inc. | 3.21 | 0.00 | 21.48 | -18.19 | 0.3207 | -0.0127 | |||
| SNXZF / Sandstorm Gold Ltd. | 3.25 | -28.21 | 19.94 | -29.81 | 0.2978 | -0.0630 | |||
| BXP / Boston Properties, Inc. | 0.16 | -15.71 | 19.93 | -20.13 | 0.2976 | -0.0193 | |||
| PLD / Prologis, Inc. | 0.31 | -22.90 | 19.64 | -24.71 | 0.2933 | -0.0380 | |||
| AVB / AvalonBay Communities, Inc. | 0.12 | -2.82 | 19.50 | -10.42 | 0.2912 | 0.0148 | |||
| SLG / SL Green Realty Corp. | 0.16 | -11.30 | 15.20 | -14.91 | 0.2270 | 0.0001 | |||
| MITL / Mitel Networks Corp | 1.26 | -6.30 | 15.10 | 7.79 | 0.2256 | 0.2256 | |||
| WMB / The Williams Companies, Inc. | 0.61 | -0.03 | 15.07 | -18.49 | 0.2250 | -0.0097 | |||
| GOOGL / Alphabet Inc. | 0.01 | -11.44 | 15.00 | -12.80 | 0.2240 | 0.0055 | |||
| FRT / Federal Realty Investment Trust | 0.13 | -14.92 | 14.90 | -25.62 | 0.2225 | -0.0319 | |||
| UNP / Union Pacific Corporation | 0.11 | -3.23 | 14.50 | -3.00 | 0.2165 | 0.0267 | |||
| WBA / Walgreens Boots Alliance, Inc. | 0.22 | 16.66 | 14.47 | 5.17 | 0.2162 | 0.2162 | |||
| SLB / Schlumberger Limited | 0.22 | 111.15 | 14.23 | 102.97 | 0.2124 | 0.1234 | |||
| NEE / NextEra Energy, Inc. | 0.09 | 25.59 | 14.19 | 31.34 | 0.2119 | 0.0747 | |||
| KRC / Kilroy Realty Corporation | 0.19 | -8.25 | 13.80 | -12.79 | 0.2061 | 0.2061 | |||
| BATRK / Atlanta Braves Holdings, Inc. | 0.59 | 120.37 | 13.45 | 126.31 | 0.2009 | 0.2009 | |||
| ZBH / Zimmer Biomet Holdings, Inc. | 0.12 | -4.82 | 12.92 | -13.99 | 0.1930 | 0.0022 | |||
| SRE / Sempra | 0.11 | 53.80 | 12.69 | 59.97 | 0.1894 | 0.0887 | |||
| SBAC / SBA Communications Corporation | 0.07 | -4.18 | 12.30 | 0.26 | 0.1837 | 0.0279 | |||
| AGCO / AGCO Corporation | 0.18 | -7.58 | 11.87 | -16.09 | 0.1772 | -0.0024 | |||
| NLOK / NortonLifeLock Inc | 0.46 | 5.59 | 11.86 | -2.72 | 0.1771 | 0.1771 | |||
| TAHO / Tahoe Resources Inc. | 1.95 | -1.76 | 11.80 | -1.44 | 0.1762 | 0.0242 | |||
| VZ / Verizon Communications Inc. | 0.24 | 11.50 | 0.1717 | 0.1717 | |||||
| AAPL / Apple Inc. | 0.07 | 85.37 | 11.36 | 83.77 | 0.1696 | 0.0911 | |||
| SSRM / SSR Mining Inc. | 0.91 | -5.98 | 11.32 | 5.41 | 0.1691 | 0.0327 | |||
| CCI / Crown Castle Inc. | 0.10 | -4.18 | 11.31 | -5.39 | 0.1690 | 0.0171 | |||
| FNV / Franco-Nevada Corporation | 0.16 | -2.29 | 10.89 | -33.48 | 0.1627 | 0.1627 | |||
| CAT / Caterpillar Inc. | 0.07 | 10.54 | 0.1575 | 0.1575 | |||||
| DOW / Dow Inc. | 0.16 | -4.81 | 10.45 | -14.84 | 0.1560 | 0.0002 | |||
| FTS / Fortis Inc. | 0.23 | -50.53 | 10.21 | -53.34 | 0.1524 | 0.1524 | |||
| OPI / Office Properties Income Trust | 0.05 | 26.87 | 10.13 | 43.09 | 0.1513 | 0.1513 | |||
| TRI / Thomson Reuters Corporation | 0.20 | -88.86 | 9.84 | -89.88 | 0.1470 | -1.0882 | |||
| MIC / Macquarie Infrastructure Holdings LLC - Units | 0.26 | -0.04 | 9.76 | -42.50 | 0.1458 | -0.0698 | |||
| KMI / Kinder Morgan, Inc. | 0.62 | -0.03 | 9.41 | -16.69 | 0.1405 | -0.0029 | |||
| PK / Park Hotels & Resorts Inc. | 0.34 | -24.35 | 9.23 | -28.90 | 0.1379 | 0.1379 | |||
| VTR / Ventas, Inc. | 0.19 | -3.89 | 9.23 | -20.68 | 0.1378 | -0.0099 | |||
| BSM / Black Stone Minerals, L.P. - Limited Partnership | 0.55 | 15.44 | 9.16 | 6.49 | 0.1367 | 0.0275 | |||
| PH / Parker-Hannifin Corporation | 0.05 | 9.04 | 0.1350 | 0.1350 | |||||
| STOR / Store Capital Corp | 0.36 | 20.10 | 9.01 | 14.48 | 0.1346 | 0.1346 | |||
| VNOM / Viper Energy, Inc. | 0.35 | 2.84 | 8.99 | 12.01 | 0.1343 | 0.1343 | |||
| WBC / Wabco Holdings, Inc. | 0.07 | 8.90 | 0.1329 | 0.1329 | |||||
| EXR / Extra Space Storage Inc. | 0.10 | -28.57 | 8.74 | -28.64 | 0.1305 | -0.0250 | |||
| CDE / Coeur Mining, Inc. | 1.06 | 432.50 | 8.52 | 468.00 | 0.1272 | 0.1272 | |||
| BRK.B / Berkshire Hathaway Inc. | 0.04 | -32.09 | 8.49 | -31.65 | 0.1267 | -0.0310 | |||
| GSS / Golden Star Resources Ltd. | 10.80 | -8.77 | 8.21 | -37.53 | 0.1226 | -0.0443 | |||
| CME / CME Group Inc. | 0.05 | -7.35 | 8.15 | 2.60 | 0.1218 | 0.0208 | |||
| LNG / Cheniere Energy, Inc. | 0.15 | -0.13 | 8.06 | -0.86 | 0.1204 | 0.1204 | |||
| HR / Healthcare Realty Trust Incorporated | 0.28 | -4.32 | 7.79 | -17.46 | 0.1164 | 0.1164 | |||
| EXC / Exelon Corporation | 0.20 | -4.05 | 7.73 | -5.02 | 0.1155 | 0.0121 | |||
| KLAC / KLA Corporation | 0.07 | 7.70 | 0.1149 | 0.1149 | |||||
| GSV / Gold Standard Ventures Corp | 3.37 | 58.57 | 7.12 | 52.06 | 0.1063 | 0.1063 | |||
| BUD / Anheuser-Busch InBev SA/NV - Depositary Receipt (Common Stock) | 0.06 | 75.27 | 6.90 | 72.75 | 0.1031 | 0.1031 | |||
| ARGO / Argo Group International Holdings, Inc. | 0.12 | 65.86 | 6.66 | 54.40 | 0.0995 | 0.0995 | |||
| 74005P104 / Praxair, Inc. | 0.05 | 6.29 | 6.57 | -0.85 | 0.0981 | 0.0140 | |||
| PM / Philip Morris International Inc. | 0.06 | 6.35 | 0.0949 | 0.0949 | |||||
| BLL / Ball Corp. | 0.15 | 48.59 | 5.84 | 55.91 | 0.0873 | 0.0873 | |||
| ABC / Amerisource Bergen Corp. | 0.07 | -77.52 | 5.72 | -78.90 | 0.0855 | -0.2590 | |||
| NWL / Newell Brands Inc. | 0.22 | -91.28 | 5.68 | -92.81 | 0.0849 | 0.0849 | |||
| CSX / CSX Corporation | 0.10 | 5.51 | 0.0823 | 0.0823 | |||||
| ECA / EnCana Corp. | 0.35 | 48.73 | 4.93 | 25.67 | 0.0737 | 0.0238 | |||
| NTR / Nutrien Ltd. | 0.08 | 4.59 | 0.0685 | 0.0685 | |||||
| SCHL / Scholastic Corporation | 0.11 | 4.53 | 4.21 | 1.23 | 0.0629 | 0.0101 | |||
| GD / General Dynamics Corporation | 0.02 | 4.11 | 0.0613 | 0.0613 | |||||
| PEGI / Pattern Energy Group Inc. | 0.21 | 3.58 | 0.0535 | 0.0535 | |||||
| ERF / Enerplus Corporation | 0.23 | -24.75 | 3.30 | -11.43 | 0.0493 | 0.0493 | |||
| TRP / TC Energy Corporation | 0.06 | -83.96 | 3.11 | -86.03 | 0.0465 | -0.2364 | |||
| NEM / Newmont Corporation | 0.07 | 2.92 | 0.0436 | 0.0436 | |||||
| BAC / Bank of America Corporation | 0.10 | 2.88 | 0.0430 | 0.0430 | |||||
| RDS.A / Shell Plc - ADR (Representing Ordinary Shares - Class A) | 0.04 | 2.87 | 0.0429 | 0.0429 | |||||
| WAB / Westinghouse Air Brake Technologies Corporation | 0.04 | 2.85 | 0.0425 | 0.0425 | |||||
| EOG / EOG Resources, Inc. | 0.03 | 4.00 | 2.74 | 1.45 | 0.0409 | 0.0066 | |||
| US7018771029 / Parsley Energy, Inc. | 0.09 | 3.82 | 2.68 | 2.21 | 0.0400 | 0.0400 | |||
| KW / Kennedy-Wilson Holdings, Inc. | 0.15 | 25.64 | 2.63 | 25.97 | 0.0393 | 0.0393 | |||
| SQM / Sociedad Química y Minera de Chile S.A. - Depositary Receipt (Common Stock) | 0.05 | 10.31 | 2.63 | -8.65 | 0.0393 | 0.0393 | |||
| AAV / Advantage Energy Ltd. | 0.69 | -22.41 | 2.63 | -45.25 | 0.0392 | 0.0392 | |||
| ALB / Albemarle Corporation | 0.03 | 21.74 | 2.60 | -11.70 | 0.0388 | 0.0388 | |||
| CPG / Veren Inc. | 0.29 | -31.75 | 2.55 | -37.60 | 0.0380 | -0.0138 | |||
| GOLD / Barrick Mining Corporation | 0.20 | 2.47 | 0.0368 | 0.0368 | |||||
| US20605P1012 / Concho Resources, Inc. | 0.02 | 4.14 | 2.27 | 4.22 | 0.0339 | 0.0339 | |||
| XEC / Cimarex Energy Co. | 0.02 | 3.96 | 2.21 | -20.32 | 0.0330 | 0.0330 | |||
| PUMP / ProPetro Holding Corp. | 0.12 | 3.92 | 1.94 | -18.11 | 0.0289 | 0.0289 | |||
| RSPP / RSP Permian, Inc. | 0.04 | -37.80 | 1.91 | -28.29 | 0.0285 | 0.0285 | |||
| NSU / Nevsun Resources Ltd. | 0.60 | -29.41 | 1.84 | -29.18 | 0.0275 | 0.0275 | |||
| CVE / Cenovus Energy Inc. | 0.17 | 1.81 | 0.0271 | 0.0271 | |||||
| CMS / CMS Energy Corporation | 0.04 | 0.00 | 1.81 | -4.23 | 0.0271 | 0.0030 | |||
| US6550441058 / Noble Energy, Inc. | 0.06 | 4.21 | 1.80 | 8.36 | 0.0269 | 0.0269 | |||
| LAC / Lithium Americas Corp. | 0.25 | 1.75 | 0.0261 | 0.0261 | |||||
| AWK / American Water Works Company, Inc. | 0.02 | 0.00 | 1.45 | -10.19 | 0.0217 | 0.0012 | |||
| MPVD / Mountain Province Diamonds Inc. | 0.44 | -42.67 | 1.42 | -46.22 | 0.0211 | 0.0211 | |||
| COG / Cabot Oil & Gas Corp. | 0.05 | 3.88 | 1.28 | -12.89 | 0.0192 | 0.0192 | |||
| BEN / Franklin Resources, Inc. | 0.03 | 0.00 | 1.21 | -19.96 | 0.0180 | -0.0011 | |||
| NICE / NICE Ltd. - Depositary Receipt (Common Stock) | 0.01 | 0.00 | 1.14 | 2.15 | 0.0170 | 0.0170 | |||
| GLD / SPDR Gold Trust | 0.01 | 0.00 | 1.11 | 1.74 | 0.0166 | 0.0027 | |||
| MIDD / The Middleby Corporation | 0.01 | -12.83 | 1.08 | -20.07 | 0.0161 | 0.0161 | |||
| FDX / FedEx Corporation | 0.00 | 0.00 | 1.02 | -3.86 | 0.0152 | 0.0018 | |||
| PSA / Public Storage | 0.00 | -30.16 | 0.99 | -33.00 | 0.0148 | -0.0040 | |||
| WEC / WEC Energy Group, Inc. | 0.02 | 0.00 | 0.98 | -5.66 | 0.0147 | 0.0014 | |||
| EIX / Edison International | 0.02 | 0.00 | 0.97 | 0.62 | 0.0145 | 0.0023 | |||
| REG / Regency Centers Corporation | 0.02 | -29.91 | 0.93 | -40.26 | 0.0138 | -0.0059 | |||
| PCG / PG&E Corporation | 0.02 | 0.00 | 0.86 | -1.95 | 0.0128 | 0.0017 | |||
| COMM / CommScope Holding Company, Inc. | 0.02 | 0.00 | 0.84 | 5.67 | 0.0125 | 0.0125 | |||
| HES / Hess Corporation | 0.02 | -3.73 | 0.79 | 2.75 | 0.0117 | 0.0117 | |||
| ATH / Athene Holding Ltd - Class A | 0.02 | -5.53 | 0.77 | -12.64 | 0.0116 | 0.0116 | |||
| TAC / TransAlta Corporation | 0.10 | -83.14 | 0.68 | -84.21 | 0.0101 | -0.0445 | |||
| AMH / American Homes 4 Rent | 0.03 | 0.65 | 0.0097 | 0.0097 | |||||
| SRCLP / Stericycle, Inc. 5.25% Series A Preferred | 0.01 | -83.93 | 0.63 | -86.27 | 0.0094 | 0.0094 | |||
| BPR / Brookfield Property REIT Inc. | 0.02 | 0.61 | 0.0091 | 0.0091 | |||||
| CNXC / Concentrix Corporation | 0.01 | 0.51 | 0.0076 | 0.0076 | |||||
| SBNY / Signature Bank | 0.00 | -14.32 | 0.48 | -11.50 | 0.0071 | 0.0003 | |||
| HUBS / HubSpot, Inc. | 0.00 | -31.45 | 0.43 | -15.95 | 0.0065 | 0.0065 | |||
| MTN / Vail Resorts, Inc. | 0.00 | 0.40 | 0.0060 | 0.0060 | |||||
| BABA / Alibaba Group Holding Limited - Depositary Receipt (Common Stock) | 0.00 | -95.91 | 0.33 | -95.65 | 0.0050 | 0.0050 | |||
| MAG / MAG Silver Corp. | 0.03 | 25.00 | 0.32 | 1.94 | 0.0047 | 0.0047 | |||
| KNX / Knight-Swift Transportation Holdings Inc. | 0.01 | 0.29 | 0.0043 | 0.0043 | |||||
| TEAM / Atlassian Corporation | 0.00 | 0.27 | 0.0040 | 0.0040 | |||||
| HSIC / Henry Schein, Inc. | 0.00 | 0.25 | 0.0037 | 0.0037 | |||||
| VNO / Vornado Realty Trust | 0.00 | 0.25 | 0.0037 | 0.0037 | |||||
| USFD / US Foods Holding Corp. | 0.01 | 0.24 | 0.0036 | 0.0036 | |||||
| TDY / Teledyne Technologies Incorporated | 0.00 | -50.28 | 0.23 | -48.68 | 0.0035 | 0.0035 | |||
| FCE.A / Forest City Realty Trust, Inc. | 0.01 | 0.23 | 0.0034 | 0.0034 | |||||
| SUI / Sun Communities, Inc. | 0.00 | 0.23 | 0.0034 | 0.0034 | |||||
| TCBI / Texas Capital Bancshares, Inc. | 0.00 | 0.22 | 0.0033 | 0.0033 | |||||
| VEEV / Veeva Systems Inc. | 0.00 | 0.22 | 0.0033 | 0.0033 | |||||
| MORN / Morningstar, Inc. | 0.00 | -100.00 | 0.00 | -100.00 | 0.0000 | ||||
| AMGN / Amgen Inc. | 0.00 | -100.00 | 0.00 | -100.00 | 0.0000 | ||||
| VET / Vermilion Energy Inc. | 0.00 | -100.00 | 0.00 | -100.00 | -0.0254 | ||||
| CLNS / Colony NorthStar, Inc. | 0.00 | -100.00 | 0.00 | -100.00 | 0.0000 | ||||
| US30224P2002 / Extended Stay America Inc | 0.00 | -100.00 | 0.00 | -100.00 | 0.0000 | 0.0000 | |||
| AVGO / Broadcom Inc. | 0.00 | -100.00 | 0.00 | -100.00 | 0.0000 | ||||
| C.WSA / Citigroup, Inc. | 0.00 | -100.00 | 0.00 | -100.00 | 0.0000 | ||||
| IGT / International Game Technology PLC | 0.00 | -100.00 | 0.00 | -100.00 | 0.0000 | ||||
| ST / Sensata Technologies Holding plc | 0.00 | -100.00 | 0.00 | -100.00 | -0.9610 | ||||
| FLR / Fluor Corporation | 0.00 | -100.00 | 0.00 | -100.00 | 0.0000 | ||||
| G5480U153 / Liberty Global plc LiLAC Class C | 0.00 | -100.00 | 0.00 | -100.00 | -0.7754 | ||||
| GZTGF / G City Ltd | 0.00 | -100.00 | 0.00 | 0.0000 | |||||
| HD / The Home Depot, Inc. | 0.00 | -100.00 | 0.00 | -100.00 | -0.0072 | ||||
| FTNT / Fortinet, Inc. | 0.00 | -100.00 | 0.00 | -100.00 | 0.0000 | ||||
| WTW / Willis Towers Watson Public Limited Company | 0.00 | -100.00 | 0.00 | -100.00 | 0.0000 | ||||
| AKG / Asanko Gold Inc. | 0.00 | -100.00 | 0.00 | -100.00 | 0.0000 | ||||
| AGU / Agrium Inc. | 0.00 | -100.00 | 0.00 | -100.00 | -0.0555 | ||||
| MCD / McDonald's Corporation | 0.00 | -100.00 | 0.00 | -100.00 | -0.0168 | ||||
| VLO / Valero Energy Corporation | 0.00 | -100.00 | 0.00 | -100.00 | -0.0176 | ||||
| JNJ / Johnson & Johnson | 0.00 | -100.00 | 0.00 | -100.00 | -0.1068 | ||||
| C / Citigroup Inc. | 0.00 | -100.00 | 0.00 | -100.00 | 0.0000 | ||||
| RCI / Rogers Communications Inc. | 0.00 | -100.00 | 0.00 | -100.00 | -0.4695 | ||||
| LBTYK / Liberty Global Ltd. | 0.00 | -100.00 | 0.00 | -100.00 | 0.0000 | ||||
| MDT / Medtronic plc | 0.00 | -100.00 | 0.00 | -100.00 | -0.4588 | ||||
| HAL / Halliburton Company | Call | 0.00 | -100.00 | 0.00 | -100.00 | 0.0000 | |||
| PZZA / Papa John's International, Inc. | 0.00 | -100.00 | 0.00 | -100.00 | 0.0000 | ||||
| AMC / AMC Entertainment Holdings, Inc. | 0.00 | -100.00 | 0.00 | -100.00 | -0.0082 | ||||
| BA / The Boeing Company | 0.00 | -100.00 | 0.00 | -100.00 | 0.0000 | ||||
| ESGR / Enstar Group Limited | 0.00 | -100.00 | 0.00 | -100.00 | 0.0000 | ||||
| CB / Chubb Limited | 0.00 | -100.00 | 0.00 | -100.00 | 0.0000 | ||||
| SYF / Synchrony Financial | 0.00 | -100.00 | 0.00 | -100.00 | 0.0000 | 0.0000 | |||
| MFC / HEXAOM | 0.00 | -100.00 | 0.00 | -100.00 | -0.1190 |