Statistik Asas
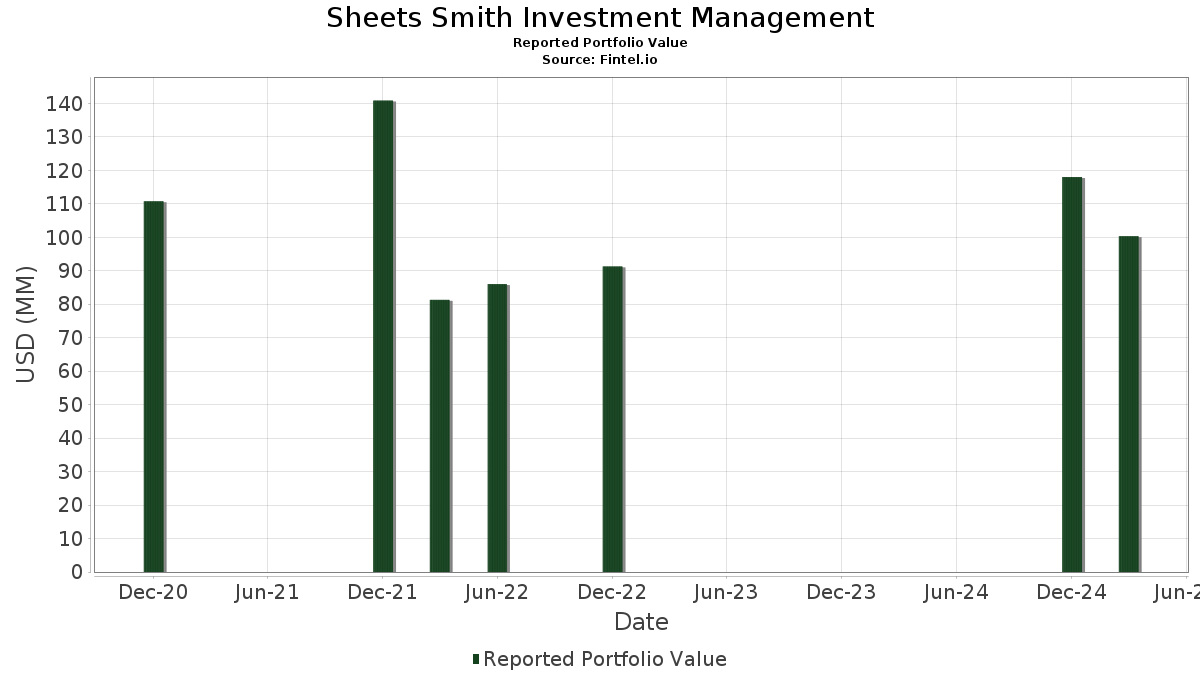
| Nilai Portfolio | $ 100,316,909 |
| Kedudukan Semasa | 42 |
Pegangan Terkini, Prestasi, AUM (dari 13F, 13D)
Sheets Smith Investment Management telah mendedahkan 42 jumlah pegangan dalam pemfailan SEC terkini mereka. Nilai portfolio terkini dikira sebagai $ 100,316,909 USD. Aset Sebenar Di Bawah Pengurusan (AUM) ialah nilai ini ditambah dengan tunai (yang tidak didedahkan). Pegangan teratas Sheets Smith Investment Management ialah Goldman Sachs ETF Trust - Goldman Sachs Access Treasury 0-1 Year ETF (US:GBIL) , Vanguard Scottsdale Funds - Vanguard Short-Term Corporate Bond ETF (US:VSTB.X) , Invesco Exchange-Traded Fund Trust - Invesco S&P 500 Equal Weight ETF (US:RSP) , Vanguard Scottsdale Funds - Vanguard Intermediate-Term Corporate Bond ETF (US:VCIT) , and NVIDIA Corporation (US:NVDA) . Kedudukan baharu Sheets Smith Investment Management termasuk Sea Limited - Depositary Receipt (Common Stock) (US:SE) , Nutanix, Inc. (US:NTNX) , General Electric Company (US:GE) , Penumbra, Inc. (US:PEN) , and ProShares Trust - ProShares Short QQQ (US:PSQ) .
Kenaikan Teratas Suku Tahun Ini
Kami menggunakan perubahan dalam peruntukan portfolio kerana ini adalah metrik yang paling bermakna. Perubahan boleh disebabkan oleh perdagangan atau perubahan dalam harga saham.
| Sekuriti | Saham (MM) |
Nilai (MM$) |
Portfolio % | ΔPortfolio % |
|---|---|---|---|---|
| 0.34 | 34.17 | 34.0604 | 27.6154 | |
| 0.14 | 10.82 | 10.7884 | 1.8597 | |
| 0.00 | 1.32 | 1.3166 | 1.3166 | |
| 0.01 | 1.05 | 1.0493 | 1.0493 | |
| 0.01 | 0.98 | 0.9780 | 0.9780 | |
| 0.00 | 0.96 | 0.9545 | 0.9545 | |
| 0.04 | 6.13 | 6.1107 | 0.8472 | |
| 0.00 | 0.77 | 0.7701 | 0.7701 | |
| 0.02 | 2.11 | 2.1055 | 0.7252 | |
| 0.05 | 4.47 | 4.4563 | 0.6897 |
Penurunan Teratas Suku Tahun Ini
Kami menggunakan perubahan dalam peruntukan portfolio kerana ini adalah metrik yang paling bermakna. Perubahan boleh disebabkan oleh perdagangan atau perubahan dalam harga saham.
| Sekuriti | Saham (MM) |
Nilai (MM$) |
Portfolio % | ΔPortfolio % |
|---|---|---|---|---|
| 0.00 | 0.33 | 0.3306 | -4.4483 | |
| 0.00 | 0.00 | -3.0797 | ||
| 0.00 | 0.00 | -2.1090 | ||
| 0.01 | 1.48 | 1.4781 | -1.2868 | |
| 0.00 | 1.33 | 1.3249 | -0.8993 | |
| 0.01 | 1.26 | 1.2527 | -0.6568 | |
| 0.01 | 1.07 | 1.0670 | -0.3383 | |
| 0.03 | 1.09 | 1.0888 | -0.2547 | |
| 0.02 | 2.43 | 2.4273 | -0.1345 | |
| 0.01 | 1.14 | 1.1338 | -0.1330 |
13F dan Pemfailan Dana
Borang ini telah difailkan pada 2025-06-12 untuk tempoh pelaporan 2025-03-31. Klik ikon pautan untuk melihat sejarah transaksi penuh.
Tingkatkan untuk membuka data premium dan eksport ke Excel ![]() .
.
| Sekuriti | Jenis | Purata Harga Saham | Saham (MM) |
ΔSaham (%) |
ΔSaham (%) |
Nilai ($MM) |
Portfolio (%) |
ΔPortfolio (%) |
|
|---|---|---|---|---|---|---|---|---|---|
| GBIL / Goldman Sachs ETF Trust - Goldman Sachs Access Treasury 0-1 Year ETF | 0.34 | 348.16 | 34.17 | 349.34 | 34.0604 | 27.6154 | |||
| VSTB.X / Vanguard Scottsdale Funds - Vanguard Short-Term Corporate Bond ETF | 0.14 | 1.52 | 10.82 | 2.73 | 10.7884 | 1.8597 | |||
| RSP / Invesco Exchange-Traded Fund Trust - Invesco S&P 500 Equal Weight ETF | 0.04 | -0.15 | 6.13 | -1.29 | 6.1107 | 0.8472 | |||
| VCIT / Vanguard Scottsdale Funds - Vanguard Intermediate-Term Corporate Bond ETF | 0.05 | -1.24 | 4.47 | 0.59 | 4.4563 | 0.6897 | |||
| NVDA / NVIDIA Corporation | 0.02 | -0.18 | 2.43 | -19.46 | 2.4273 | -0.1345 | |||
| AMZN / Amazon.com, Inc. | 0.01 | 2.98 | 2.35 | -10.70 | 2.3470 | 0.1126 | |||
| PLMR / Palomar Holdings, Inc. | 0.02 | -0.10 | 2.11 | 29.73 | 2.1055 | 0.7252 | |||
| TMUS / T-Mobile US, Inc. | 0.01 | -0.08 | 2.02 | 20.71 | 2.0116 | 0.5950 | |||
| HWM / Howmet Aerospace Inc. | 0.02 | -0.16 | 1.97 | 18.44 | 1.9664 | 0.5547 | |||
| CRS / Carpenter Technology Corporation | 0.01 | -0.24 | 1.89 | 6.55 | 1.8823 | 0.3796 | |||
| EXLS / ExlService Holdings, Inc. | 0.04 | 0.08 | 1.72 | 6.45 | 1.7122 | 0.3448 | |||
| USFD / US Foods Holding Corp. | 0.03 | 23.30 | 1.64 | 19.65 | 1.6397 | 0.4745 | |||
| FI / Fiserv, Inc. | 0.01 | 0.13 | 1.54 | 7.69 | 1.5363 | 0.3228 | |||
| APP / AppLovin Corporation | 0.01 | -44.45 | 1.48 | -54.57 | 1.4781 | -1.2868 | |||
| AVPT / AvePoint, Inc. | 0.10 | -0.30 | 1.47 | -12.85 | 1.4683 | 0.0367 | |||
| WTW / Willis Towers Watson Public Limited Company | 0.00 | -0.36 | 1.42 | 7.52 | 1.4109 | 0.2950 | |||
| SYK / Stryker Corporation | 0.00 | 0.43 | 1.39 | 3.88 | 1.3878 | 0.2514 | |||
| GEV / GE Vernova Inc. | 0.00 | -0.22 | 1.37 | -7.38 | 1.3642 | 0.1117 | |||
| META / Meta Platforms, Inc. | 0.00 | -48.55 | 1.33 | -49.35 | 1.3249 | -0.8993 | |||
| MELI / MercadoLibre, Inc. | 0.00 | 1.32 | 1.3166 | 1.3166 | |||||
| PLTR / Palantir Technologies Inc. | 0.01 | -50.02 | 1.26 | -44.23 | 1.2527 | -0.6568 | |||
| TBBK / The Bancorp, Inc. | 0.02 | -0.37 | 1.25 | 0.00 | 1.2478 | 0.1872 | |||
| PODD / Insulet Corporation | 0.00 | 48.18 | 1.22 | 49.08 | 1.2149 | 0.5219 | |||
| GOOG / Alphabet Inc. | 0.01 | 1.57 | 1.21 | -16.64 | 1.2085 | -0.0246 | |||
| FTNT / Fortinet, Inc. | 0.01 | -25.31 | 1.14 | -23.90 | 1.1338 | -0.1330 | |||
| TOST / Toast, Inc. | 0.03 | -24.28 | 1.09 | -31.10 | 1.0888 | -0.2547 | |||
| ALL / The Allstate Corporation | 0.01 | -39.90 | 1.07 | -35.43 | 1.0670 | -0.3383 | |||
| SE / Sea Limited - Depositary Receipt (Common Stock) | 0.01 | 1.05 | 1.0493 | 1.0493 | |||||
| NFLX / Netflix, Inc. | 0.00 | -22.81 | 1.04 | -19.26 | 1.0411 | -0.0550 | |||
| NTNX / Nutanix, Inc. | 0.01 | 0.98 | 0.9780 | 0.9780 | |||||
| ADP / Automatic Data Processing, Inc. | 0.00 | -27.44 | 0.96 | -24.27 | 0.9618 | -0.1179 | |||
| GE / General Electric Company | 0.00 | 0.96 | 0.9545 | 0.9545 | |||||
| GTLS / Chart Industries, Inc. | 0.01 | 0.10 | 0.87 | -24.35 | 0.8680 | -0.1066 | |||
| SKWD / Skyward Specialty Insurance Group, Inc. | 0.02 | 0.01 | 0.85 | 4.67 | 0.8489 | 0.1597 | |||
| PEN / Penumbra, Inc. | 0.00 | 0.77 | 0.7701 | 0.7701 | |||||
| PSQ / ProShares Trust - ProShares Short QQQ | 0.01 | 0.44 | 0.4432 | 0.4432 | |||||
| XMTR / Xometry, Inc. | 0.01 | 0.35 | 0.3459 | 0.3459 | |||||
| IWV / iShares Trust - iShares Russell 3000 ETF | 0.00 | -93.81 | 0.33 | -94.13 | 0.3306 | -4.4483 | |||
| SH / ProShares Trust - ProShares Short S&P500 | 0.01 | 0.30 | 0.2957 | 0.2957 | |||||
| ARDX / Ardelyx, Inc. | 0.01 | 0.00 | 0.06 | -3.51 | 0.0558 | 0.0068 | |||
| MREO / Mereo BioPharma Group plc - Depositary Receipt (Common Stock) | 0.02 | 0.00 | 0.04 | -35.59 | 0.0379 | -0.0122 | |||
| VERU / Veru Inc. | 0.02 | 0.00 | 0.01 | -28.57 | 0.0109 | -0.0014 | |||
| FTI / TechnipFMC plc | 0.00 | -100.00 | 0.00 | 0.0000 | |||||
| TMHC / Taylor Morrison Home Corporation | 0.00 | -100.00 | 0.00 | 0.0000 | |||||
| BURL / Burlington Stores, Inc. | 0.00 | -100.00 | 0.00 | 0.0000 | |||||
| TEAM / Atlassian Corporation | 0.00 | -100.00 | 0.00 | 0.0000 | |||||
| CWAN / Clearwater Analytics Holdings, Inc. | 0.00 | -100.00 | 0.00 | 0.0000 | |||||
| AGG / iShares Trust - iShares Core U.S. Aggregate Bond ETF | 0.00 | -100.00 | 0.00 | 0.0000 | |||||
| KGS / Kodiak Gas Services, Inc. | 0.00 | -100.00 | 0.00 | 0.0000 | |||||
| BVS / Bioventus Inc. | 0.00 | -100.00 | 0.00 | 0.0000 | |||||
| AAPL / Apple Inc. | 0.00 | -100.00 | 0.00 | -100.00 | -2.1090 | ||||
| MSFT / Microsoft Corporation | 0.00 | -100.00 | 0.00 | -100.00 | -3.0797 | ||||
| DSGX / The Descartes Systems Group Inc. | 0.00 | -100.00 | 0.00 | 0.0000 | |||||
| HUBS / HubSpot, Inc. | 0.00 | -100.00 | 0.00 | 0.0000 | |||||
| VRT / Vertiv Holdings Co | 0.00 | -100.00 | 0.00 | 0.0000 | |||||
| VERX / Vertex, Inc. | 0.00 | -100.00 | 0.00 | 0.0000 | |||||
| SHOP / Shopify Inc. | 0.00 | -100.00 | 0.00 | 0.0000 | |||||
| PANW / Palo Alto Networks, Inc. | 0.00 | -100.00 | 0.00 | 0.0000 | |||||
| ACA / Arcosa, Inc. | 0.00 | -100.00 | 0.00 | 0.0000 | |||||
| NOW / ServiceNow, Inc. | 0.00 | -100.00 | 0.00 | 0.0000 | |||||
| OII / Oceaneering International, Inc. | 0.00 | -100.00 | 0.00 | 0.0000 | |||||
| EFIV / SPDR Series Trust - SPDR S&P 500 ESG ETF | 0.00 | -100.00 | 0.00 | 0.0000 | |||||
| ROAD / Construction Partners, Inc. | 0.00 | -100.00 | 0.00 | 0.0000 | |||||
| MCY / Mercury General Corporation | 0.00 | -100.00 | 0.00 | 0.0000 | |||||
| ALSN / Allison Transmission Holdings, Inc. | 0.00 | -100.00 | 0.00 | 0.0000 |