Statistik Asas
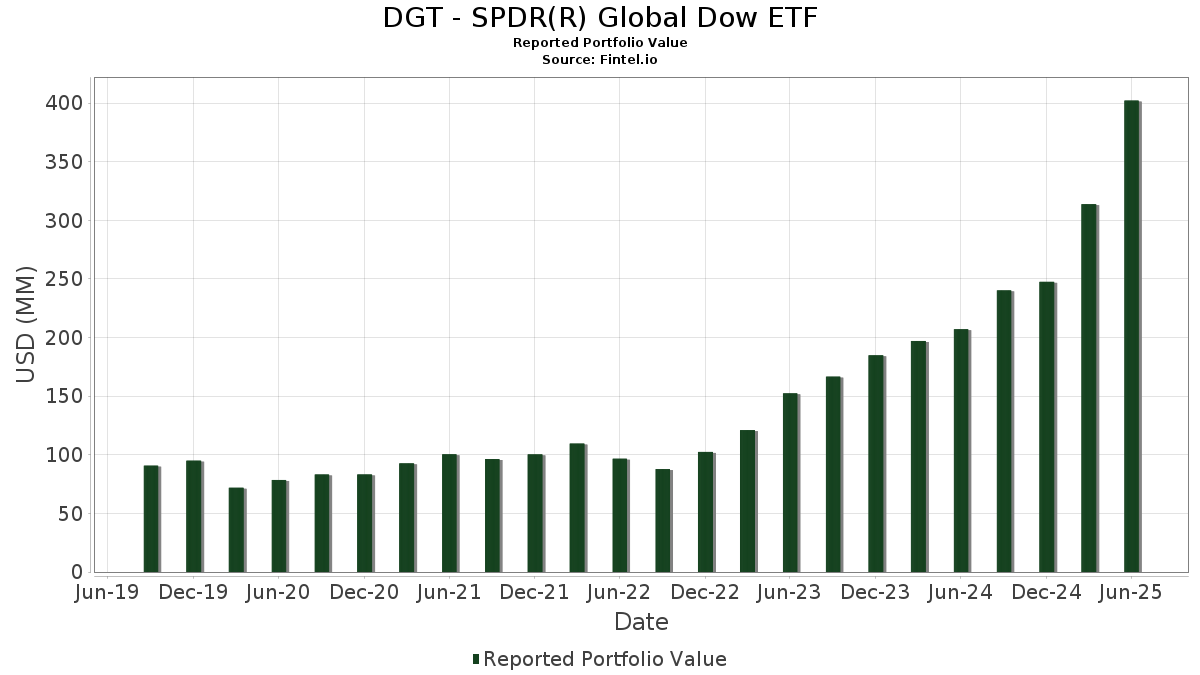
| Nilai Portfolio | $ 402,175,196 |
| Kedudukan Semasa | 159 |
Pegangan Terkini, Prestasi, AUM (dari 13F, 13D)
DGT - SPDR(R) Global Dow ETF telah mendedahkan 159 jumlah pegangan dalam pemfailan SEC terkini mereka. Nilai portfolio terkini dikira sebagai $ 402,175,196 USD. Aset Sebenar Di Bawah Pengurusan (AUM) ialah nilai ini ditambah dengan tunai (yang tidak didedahkan). Pegangan teratas DGT - SPDR(R) Global Dow ETF ialah State Street Institutional Investment Trust - State Street Institutional US Govt Money Market Fnd Premier Cls (US:GVMXX) , Howmet Aerospace Inc. (US:HWM) , Netflix, Inc. (US:NFLX) , Deutsche Bank Aktiengesellschaft (AT:DBK) , and Banco Santander, S.A. (GB:BNC) .
Kenaikan Teratas Suku Tahun Ini
Kami menggunakan perubahan dalam peruntukan portfolio kerana ini adalah metrik yang paling bermakna. Perubahan boleh disebabkan oleh perdagangan atau perubahan dalam harga saham.
| Sekuriti | Saham (MM) |
Nilai (MM$) |
Portfolio % | ΔPortfolio % |
|---|---|---|---|---|
| 7.49 | 7.49 | 1.8983 | 1.8125 | |
| 0.07 | 2.17 | 0.5503 | 0.5503 | |
| 0.01 | 3.82 | 0.9677 | 0.3342 | |
| 0.02 | 4.54 | 1.1501 | 0.2860 | |
| 0.00 | 4.51 | 1.1424 | 0.2835 | |
| 0.01 | 3.15 | 0.7975 | 0.2478 | |
| 0.13 | 3.77 | 0.9567 | 0.2404 | |
| 0.02 | 3.07 | 0.7787 | 0.1969 | |
| 0.04 | 2.81 | 0.7134 | 0.1790 | |
| 0.14 | 4.22 | 1.0704 | 0.1510 |
Penurunan Teratas Suku Tahun Ini
Kami menggunakan perubahan dalam peruntukan portfolio kerana ini adalah metrik yang paling bermakna. Perubahan boleh disebabkan oleh perdagangan atau perubahan dalam harga saham.
| Sekuriti | Saham (MM) |
Nilai (MM$) |
Portfolio % | ΔPortfolio % |
|---|---|---|---|---|
| 0.00 | 1.21 | 0.3068 | -0.2460 | |
| 0.06 | 1.96 | 0.4958 | -0.1652 | |
| 0.02 | 2.36 | 0.5974 | -0.1550 | |
| 0.02 | 2.23 | 0.5650 | -0.1451 | |
| 0.27 | 2.92 | 0.7403 | -0.1375 | |
| 0.02 | 2.02 | 0.5130 | -0.1342 | |
| 0.00 | 1.79 | 0.4549 | -0.1251 | |
| 0.01 | 2.22 | 0.5633 | -0.1220 | |
| 0.44 | 2.20 | 0.5577 | -0.1176 | |
| 0.11 | 2.04 | 0.5167 | -0.1164 |
13F dan Pemfailan Dana
Borang ini telah difailkan pada 2025-08-28 untuk tempoh pelaporan 2025-06-30. Klik ikon pautan untuk melihat sejarah transaksi penuh.
Tingkatkan untuk membuka data premium dan eksport ke Excel ![]() .
.
| Sekuriti | Jenis | Purata Harga Saham | Saham (MM) |
ΔSaham (%) |
ΔSaham (%) |
Nilai ($MM) |
Portfolio (%) |
ΔPortfolio (%) |
|
|---|---|---|---|---|---|---|---|---|---|
| GVMXX / State Street Institutional Investment Trust - State Street Institutional US Govt Money Market Fnd Premier Cls | 7.49 | 2,113.95 | 7.49 | 2,115.09 | 1.8983 | 1.8125 | |||
| HWM / Howmet Aerospace Inc. | 0.02 | 20.84 | 4.54 | 73.39 | 1.1501 | 0.2860 | |||
| NFLX / Netflix, Inc. | 0.00 | 20.65 | 4.51 | 73.31 | 1.1424 | 0.2835 | |||
| DBK / Deutsche Bank Aktiengesellschaft | 0.14 | 20.99 | 4.22 | 51.65 | 1.0704 | 0.1510 | |||
| BNC / Banco Santander, S.A. | 0.47 | 20.01 | 3.91 | 47.88 | 0.9922 | 0.1183 | |||
| AVGO / Broadcom Inc. | 0.01 | 20.86 | 3.82 | 99.01 | 0.9677 | 0.3342 | |||
| UCG / UniCredit S.p.A. | 0.06 | 20.85 | 3.78 | 45.03 | 0.9579 | 0.0976 | |||
| CCL / Carnival Corporation & plc | 0.13 | 20.84 | 3.77 | 74.03 | 0.9567 | 0.2404 | |||
| NNW0 / Naspers Limited | 0.01 | 20.85 | 3.63 | 52.71 | 0.9204 | 0.1351 | |||
| WFC / Wells Fargo & Company | 0.04 | 21.00 | 3.52 | 35.05 | 0.8919 | 0.0315 | |||
| BKNG / Booking Holdings Inc. | 0.00 | 21.64 | 3.51 | 52.92 | 0.8909 | 0.1317 | |||
| BBVA / Banco Bilbao Vizcaya Argentaria, S.A. - Depositary Receipt (Common Stock) | 0.23 | 20.84 | 3.46 | 36.69 | 0.8764 | 0.0410 | |||
| GS / The Goldman Sachs Group, Inc. | 0.00 | 20.92 | 3.44 | 56.65 | 0.8722 | 0.1469 | |||
| BA. / BAE Systems plc | 0.13 | 20.85 | 3.43 | 55.25 | 0.8698 | 0.1397 | |||
| ICK / Industrial and Commercial Bank of China Limited | 4.27 | 22.36 | 3.38 | 36.15 | 0.8575 | 0.0371 | |||
| PM / Philip Morris International Inc. | 0.02 | 20.85 | 3.38 | 38.64 | 0.8571 | 0.0519 | |||
| GE / General Electric Company | 0.01 | 20.86 | 3.35 | 55.39 | 0.8487 | 0.1374 | |||
| 939 / China Construction Bank Corporation | 3.31 | 22.38 | 3.34 | 39.62 | 0.8462 | 0.0567 | |||
| META / Meta Platforms, Inc. | 0.00 | 20.71 | 3.27 | 54.59 | 0.8278 | 0.1302 | |||
| JPM / JPMorgan Chase & Co. | 0.01 | 19.63 | 3.25 | 41.42 | 0.8251 | 0.0649 | |||
| SIE / Siemens Aktiengesellschaft | 0.01 | 20.85 | 3.25 | 34.90 | 0.8243 | 0.0283 | |||
| 6758 / Sony Group Corporation | 0.13 | 20.85 | 3.23 | 23.97 | 0.8195 | -0.0417 | |||
| CSCO / Cisco Systems, Inc. | 0.05 | 20.85 | 3.23 | 35.89 | 0.8190 | 0.0338 | |||
| 5 / HSBC Holdings plc | 0.27 | 20.84 | 3.23 | 29.47 | 0.8187 | -0.0051 | |||
| 8411 / Mizuho Financial Group, Inc. | 0.12 | 21.63 | 3.22 | 24.10 | 0.8159 | -0.0405 | |||
| MT / ArcelorMittal S.A. | 0.10 | 20.84 | 3.21 | 33.29 | 0.8131 | 0.0185 | |||
| TSLA / Tesla, Inc. | 0.01 | 21.01 | 3.20 | 48.35 | 0.8106 | 0.0987 | |||
| DIS / The Walt Disney Company | 0.03 | 20.86 | 3.19 | 51.83 | 0.8096 | 0.1151 | |||
| IBM / International Business Machines Corporation | 0.01 | 20.99 | 3.18 | 43.43 | 0.8054 | 0.0739 | |||
| SAP / SAP SE | 0.01 | 20.86 | 3.15 | 38.73 | 0.7993 | 0.0488 | |||
| ORCL / Oracle Corporation | 0.01 | 20.84 | 3.15 | 89.00 | 0.7975 | 0.2478 | |||
| GILD / Gilead Sciences, Inc. | 0.03 | 20.85 | 3.12 | 19.58 | 0.7913 | -0.0707 | |||
| BA / The Boeing Company | 0.01 | 20.84 | 3.11 | 48.47 | 0.7882 | 0.0966 | |||
| NNND / Tencent Holdings Limited | 0.05 | 23.09 | 3.11 | 23.48 | 0.7879 | -0.0434 | |||
| ENGI / Engie SA | 0.13 | 20.84 | 3.10 | 45.11 | 0.7869 | 0.0804 | |||
| GOB / Compagnie de Saint-Gobain S.A. | 0.03 | 20.85 | 3.10 | 42.70 | 0.7854 | 0.0684 | |||
| T / AT&T Inc. | 0.11 | 20.88 | 3.10 | 23.69 | 0.7851 | -0.0417 | |||
| MFZ / Mitsubishi UFJ Financial Group, Inc. | 0.22 | 21.16 | 3.08 | 23.69 | 0.7812 | -0.0416 | |||
| BK / The Bank of New York Mellon Corporation | 0.03 | 20.85 | 3.07 | 31.28 | 0.7788 | 0.0060 | |||
| NVDA / NVIDIA Corporation | 0.02 | 19.61 | 3.07 | 74.39 | 0.7787 | 0.1969 | |||
| BNP / BNP Paribas SA | 0.03 | 20.84 | 2.97 | 30.28 | 0.7539 | 0.0002 | |||
| DE / Deere & Company | 0.01 | 21.30 | 2.97 | 31.44 | 0.7524 | 0.0066 | |||
| ALV / Allianz SE | 0.01 | 20.79 | 2.96 | 28.27 | 0.7514 | -0.0116 | |||
| G / Assicurazioni Generali S.p.A. | 0.08 | 20.85 | 2.94 | 22.54 | 0.7457 | -0.0471 | |||
| TSM / Taiwan Semiconductor Manufacturing Company Limited - Depositary Receipt (Common Stock) | 0.01 | 16.49 | 2.93 | 58.99 | 0.7422 | 0.1339 | |||
| 6752 / Panasonic Holdings Corporation | 0.27 | 20.86 | 2.92 | 9.90 | 0.7403 | -0.1375 | |||
| NTR / Nutrien Ltd. | 0.05 | 20.84 | 2.88 | 41.63 | 0.7298 | 0.0585 | |||
| 6301 N / Komatsu Ltd. | 0.09 | 21.32 | 2.87 | 38.17 | 0.7287 | 0.0417 | |||
| V / Visa Inc. | 0.01 | 20.78 | 2.87 | 22.33 | 0.7266 | -0.0469 | |||
| AXP / American Express Company | 0.01 | 20.87 | 2.85 | 43.32 | 0.7231 | 0.0658 | |||
| EOAN / E.ON SE | 0.16 | 20.84 | 2.85 | 47.03 | 0.7228 | 0.0822 | |||
| RTX / RTX Corporation | 0.02 | 20.85 | 2.85 | 33.24 | 0.7217 | 0.0160 | |||
| BAC / Bank of America Corporation | 0.06 | 20.84 | 2.84 | 37.07 | 0.7191 | 0.0355 | |||
| DG / Vinci SA | 0.02 | 20.85 | 2.82 | 41.31 | 0.7154 | 0.0557 | |||
| SFT / SoftBank Group Corp. | 0.04 | 19.47 | 2.81 | 73.86 | 0.7134 | 0.1790 | |||
| WMT / Walmart Inc. | 0.03 | 20.83 | 2.81 | 34.58 | 0.7124 | 0.0228 | |||
| CVS / CVS Health Corporation | 0.04 | 20.85 | 2.77 | 23.08 | 0.7030 | -0.0413 | |||
| AIG / American International Group, Inc. | 0.03 | 20.84 | 2.73 | 18.97 | 0.6917 | -0.0657 | |||
| AMZN / Amazon.com, Inc. | 0.01 | 20.85 | 2.73 | 39.37 | 0.6912 | 0.0451 | |||
| ABT / Abbott Laboratories | 0.02 | 20.84 | 2.73 | 23.91 | 0.6911 | -0.0355 | |||
| FI4000552500 / ORDINARY SHARES | 0.25 | 20.84 | 2.72 | 35.44 | 0.6890 | 0.0265 | |||
| EBAY / eBay Inc. | 0.04 | 21.04 | 2.72 | 33.06 | 0.6890 | 0.0145 | |||
| MSFT / Microsoft Corporation | 0.01 | 21.11 | 2.66 | 60.55 | 0.6749 | 0.1271 | |||
| HON / Honeywell International Inc. | 0.01 | 20.83 | 2.66 | 32.93 | 0.6744 | 0.0133 | |||
| INTC / Intel Corporation | 0.12 | 20.84 | 2.66 | 19.19 | 0.6739 | -0.0626 | |||
| TSCO / Tesco PLC | 0.48 | 20.84 | 2.65 | 54.93 | 0.6730 | 0.1072 | |||
| MMM / 3M Company | 0.02 | 20.84 | 2.65 | 25.31 | 0.6729 | -0.0269 | |||
| ERCB / Telefonaktiebolaget LM Ericsson (publ) | 0.31 | 20.84 | 2.64 | 32.75 | 0.6701 | 0.0124 | |||
| TRV / The Travelers Companies, Inc. | 0.01 | 21.00 | 2.61 | 22.39 | 0.6612 | -0.0424 | |||
| UBSG / UBS Group AG | 0.08 | 19.24 | 2.61 | 32.47 | 0.6609 | 0.0108 | |||
| CAT / Caterpillar Inc. | 0.01 | 20.78 | 2.60 | 42.16 | 0.6601 | 0.0553 | |||
| TEF / Telefónica, S.A. | 0.50 | 20.85 | 2.60 | 34.47 | 0.6587 | 0.0205 | |||
| AI / L'Air Liquide S.A. | 0.01 | 20.83 | 2.54 | 31.32 | 0.6444 | 0.0051 | |||
| BGT / Bridgestone Corporation | 0.06 | 21.19 | 2.52 | 23.45 | 0.6396 | -0.0352 | |||
| BRK.B / Berkshire Hathaway Inc. | 0.01 | 21.19 | 2.51 | 10.54 | 0.6353 | -0.1134 | |||
| CRM / Salesforce, Inc. | 0.01 | 20.84 | 2.49 | 22.77 | 0.6316 | -0.0384 | |||
| ABBN / ABB Ltd | 0.04 | 20.84 | 2.48 | 40.53 | 0.6287 | 0.0459 | |||
| RY / Royal Bank of Canada | 0.02 | 20.84 | 2.48 | 41.17 | 0.6285 | 0.0483 | |||
| NG. / National Grid plc | 0.17 | 20.84 | 2.47 | 34.92 | 0.6271 | 0.0216 | |||
| AMXB / America Movil S.A.B.DE C.V. - Class B | 2.77 | 20.84 | 2.46 | 50.61 | 0.6241 | 0.0843 | |||
| ABIT / Anheuser-Busch InBev SA/NV | 0.04 | 20.84 | 2.46 | 34.41 | 0.6229 | 0.0190 | |||
| PYPL / PayPal Holdings, Inc. | 0.03 | 20.85 | 2.46 | 37.69 | 0.6225 | 0.0334 | |||
| NOVN / Novartis AG | 0.02 | 20.83 | 2.43 | 32.00 | 0.6173 | 0.0082 | |||
| ROG / Roche Holding AG | 0.01 | 20.79 | 2.42 | 19.43 | 0.6126 | -0.0557 | |||
| VOD / Vodafone Group Public Limited Company | 2.27 | 20.84 | 2.42 | 36.90 | 0.6123 | 0.0296 | |||
| S6M / Seven & i Holdings Co., Ltd. | 0.15 | 21.15 | 2.41 | 34.73 | 0.6118 | 0.0202 | |||
| TKD / Takeda Pharmaceutical Company Limited | 0.08 | 22.20 | 2.41 | 26.84 | 0.6112 | -0.0164 | |||
| BAS / Leverage Shares Plc - Corporate Bond/Note | 0.05 | 20.84 | 2.37 | 19.80 | 0.6013 | -0.0527 | |||
| CVX / Chevron Corporation | 0.02 | 20.85 | 2.36 | 3.42 | 0.5974 | -0.1550 | |||
| DUK / Duke Energy Corporation | 0.02 | 20.84 | 2.34 | 16.91 | 0.5945 | -0.0679 | |||
| NAL / National Australia Bank Limited | 0.09 | 20.84 | 2.34 | 47.05 | 0.5937 | 0.0677 | |||
| 8031 / Mitsui & Co., Ltd. | 0.11 | 21.17 | 2.31 | 32.04 | 0.5863 | 0.0079 | |||
| KO / The Coca-Cola Company | 0.03 | 20.85 | 2.31 | 19.42 | 0.5862 | -0.0535 | |||
| MBI / Mitsubishi Corporation | 0.12 | 20.68 | 2.31 | 37.42 | 0.5856 | 0.0303 | |||
| 7203 / Toyota Motor Corporation | 0.13 | 21.23 | 2.31 | 19.62 | 0.5846 | -0.0521 | |||
| MCD / McDonald's Corporation | 0.01 | 20.82 | 2.29 | 12.99 | 0.5803 | -0.0886 | |||
| SPG / Simon Property Group, Inc. | 0.01 | 20.83 | 2.28 | 16.92 | 0.5782 | -0.0658 | |||
| VZ / Verizon Communications Inc. | 0.05 | 20.85 | 2.27 | 15.28 | 0.5759 | -0.0749 | |||
| ASML / ASML Holding N.V. | 0.00 | 20.54 | 2.27 | 46.51 | 0.5751 | 0.0636 | |||
| MDT / Medtronic plc | 0.03 | 21.04 | 2.24 | 17.38 | 0.5686 | -0.0623 | |||
| XOM / Exxon Mobil Corporation | 0.02 | 21.09 | 2.24 | 9.75 | 0.5682 | -0.1062 | |||
| NESN / Nestlé S.A. | 0.02 | 20.83 | 2.24 | 18.55 | 0.5672 | -0.0563 | |||
| HD / The Home Depot, Inc. | 0.01 | 21.07 | 2.23 | 21.10 | 0.5662 | -0.0428 | |||
| BABA / Alibaba Group Holding Limited - Depositary Receipt (Common Stock) | 0.02 | 20.85 | 2.23 | 3.63 | 0.5650 | -0.1451 | |||
| ABBV / AbbVie Inc. | 0.01 | 20.86 | 2.22 | 7.04 | 0.5633 | -0.1220 | |||
| QCOM / QUALCOMM Incorporated | 0.01 | 20.85 | 2.21 | 25.33 | 0.5596 | -0.0222 | |||
| BP / BP p.l.c. - Depositary Receipt (Common Stock) | 0.44 | 20.84 | 2.20 | 7.63 | 0.5577 | -0.1176 | |||
| AMD / Advanced Micro Devices, Inc. | 0.02 | 20.84 | 2.17 | 66.90 | 0.5510 | 0.1209 | |||
| AAL / Anglo American plc | 0.07 | 2.17 | 0.5503 | 0.5503 | |||||
| RIO / Rio Tinto Group | 0.04 | 20.84 | 2.17 | 18.72 | 0.5501 | -0.0534 | |||
| MBG / Mercedes-Benz Group AG | 0.04 | 20.84 | 2.16 | 20.43 | 0.5485 | -0.0449 | |||
| UNP / Union Pacific Corporation | 0.01 | 22.36 | 2.16 | 19.14 | 0.5478 | -0.0510 | |||
| AAPL / Apple Inc. | 0.01 | 22.20 | 2.16 | 12.88 | 0.5467 | -0.0843 | |||
| JNJ / Johnson & Johnson | 0.01 | 20.85 | 2.15 | 11.32 | 0.5461 | -0.0930 | |||
| SBUX / Starbucks Corporation | 0.02 | 20.85 | 2.15 | 12.86 | 0.5453 | -0.0840 | |||
| HMC / Honda Motor Co., Ltd. - Depositary Receipt (Common Stock) | 0.22 | 20.54 | 2.14 | 29.60 | 0.5429 | -0.0027 | |||
| PG / The Procter & Gamble Company | 0.01 | 20.83 | 2.14 | 12.96 | 0.5413 | -0.0829 | |||
| BHP / BHP Group Limited | 0.09 | 20.84 | 2.11 | 22.28 | 0.5359 | -0.0351 | |||
| FP / TotalEnergies SE | 0.03 | 20.85 | 2.11 | 14.64 | 0.5344 | -0.0726 | |||
| MDLZ / Mondelez International, Inc. | 0.03 | 20.84 | 2.09 | 20.09 | 0.5305 | -0.0449 | |||
| RELIANCE / Reliance Industries Limited | 0.12 | 22.42 | 2.08 | 43.62 | 0.5277 | 0.0490 | |||
| NKE / NIKE, Inc. | 0.03 | 20.84 | 2.08 | 35.26 | 0.5271 | 0.0193 | |||
| GSK / GSK plc | 0.11 | 20.85 | 2.07 | 21.99 | 0.5246 | -0.0356 | |||
| AZN / Astrazeneca plc | 0.01 | 20.84 | 2.06 | 15.32 | 0.5230 | -0.0675 | |||
| 5401 / Nippon Steel Corporation | 0.11 | 20.06 | 2.04 | 6.37 | 0.5167 | -0.1164 | |||
| COP / ConocoPhillips | 0.02 | 20.83 | 2.02 | 3.27 | 0.5130 | -0.1342 | |||
| CL / Colgate-Palmolive Company | 0.02 | 20.83 | 2.01 | 17.18 | 0.5085 | -0.0566 | |||
| CSA / Accenture plc | 0.01 | 22.94 | 2.00 | 17.76 | 0.5076 | -0.0539 | |||
| 7751 / Canon Inc. | 0.07 | 19.80 | 2.00 | 11.86 | 0.5072 | -0.0835 | |||
| LLY / Eli Lilly and Company | 0.00 | 20.57 | 1.97 | 13.78 | 0.5004 | -0.0724 | |||
| SHEL / Shell plc | 0.06 | 20.84 | 1.97 | 16.07 | 0.5000 | -0.0612 | |||
| AMGN / Amgen Inc. | 0.01 | 20.78 | 1.96 | 8.24 | 0.4963 | -0.1010 | |||
| SLB / Schlumberger Limited | 0.06 | 20.84 | 1.96 | -2.30 | 0.4958 | -0.1652 | |||
| DD / DuPont de Nemours, Inc. | 0.03 | 20.85 | 1.95 | 10.98 | 0.4946 | -0.0859 | |||
| PFE / Pfizer Inc. | 0.08 | 20.85 | 1.93 | 15.63 | 0.4897 | -0.0621 | |||
| NEE / NextEra Energy, Inc. | 0.03 | 20.84 | 1.91 | 18.39 | 0.4847 | -0.0489 | |||
| PLD / Prologis, Inc. | 0.02 | 20.85 | 1.89 | 13.61 | 0.4784 | -0.0700 | |||
| INFY / Infosys Limited - Depositary Receipt (Common Stock) | 0.10 | 20.84 | 1.87 | 22.68 | 0.4731 | -0.0292 | |||
| FDX / FedEx Corporation | 0.01 | 20.84 | 1.85 | 12.67 | 0.4691 | -0.0732 | |||
| UPS / United Parcel Service, Inc. | 0.02 | 20.83 | 1.85 | 10.92 | 0.4686 | -0.0819 | |||
| MC / LVMH Moët Hennessy - Louis Vuitton, Société Européenne | 0.00 | 20.89 | 1.79 | 2.16 | 0.4549 | -0.1251 | |||
| BAX / Baxter International Inc. | 0.06 | 20.85 | 1.78 | 6.92 | 0.4508 | -0.0985 | |||
| PEP / PepsiCo, Inc. | 0.01 | 20.85 | 1.73 | 6.45 | 0.4397 | -0.0985 | |||
| TCS / Tata Consultancy Services Limited | 0.04 | 22.77 | 1.72 | 17.51 | 0.4355 | -0.0475 | |||
| HPQ / HP Inc. | 0.07 | 20.85 | 1.70 | 6.73 | 0.4303 | -0.0948 | |||
| ADBE / Adobe Inc. | 0.00 | 20.75 | 1.66 | 21.77 | 0.4213 | -0.0293 | |||
| MRK / Merck & Co., Inc. | 0.02 | 20.85 | 1.59 | 6.62 | 0.4041 | -0.0898 | |||
| PJXB / Petróleo Brasileiro S.A. - Petrobras - Preferred Stock | 0.25 | 22.83 | 1.43 | 8.81 | 0.3632 | -0.0715 | |||
| GOOGL / Alphabet Inc. | 0.01 | 20.79 | 1.42 | 37.63 | 0.3598 | 0.0193 | |||
| BC94 / Samsung Electronics Co., Ltd. - Depositary Receipt (Common Stock) | 0.00 | 20.08 | 1.30 | 35.87 | 0.3305 | 0.0136 | |||
| UNH / UnitedHealth Group Incorporated | 0.00 | 21.37 | 1.21 | -27.67 | 0.3068 | -0.2460 | |||
| GOOG / Alphabet Inc. | 0.01 | 20.82 | 1.17 | 37.15 | 0.2978 | 0.0150 | |||
| 2RR / Alibaba Group Holding Limited | 0.06 | 20.59 | 0.85 | 2.53 | 0.2159 | -0.0584 | |||
| 005930 / Samsung Electronics Co., Ltd. | 0.02 | 18.37 | 0.79 | 33.67 | 0.2003 | 0.0050 | |||
| PBR.A / Petróleo Brasileiro S.A. - Petrobras - Depositary Receipt (Common Stock) | 0.05 | 20.84 | 0.57 | 6.89 | 0.1458 | -0.0318 | |||
| GVMXX / State Street Institutional Investment Trust - State Street Institutional US Govt Money Market Fnd Premier Cls | 0.34 | 351.53 | 0.34 | 356.76 | 0.0857 | 0.0610 | |||
| RLNIY / Reliance Industries Ltd. - GDR - 144A | 0.00 | 20.66 | 0.21 | 43.36 | 0.0521 | 0.0048 | |||
| S+P500 EMINI FUT SEP25 / DE (000000000) | 0.03 | 0.0068 | 0.0068 | ||||||
| MSCI EAFE SEP25 / DE (000000000) | 0.02 | 0.0039 | 0.0039 |