Statistik Asas
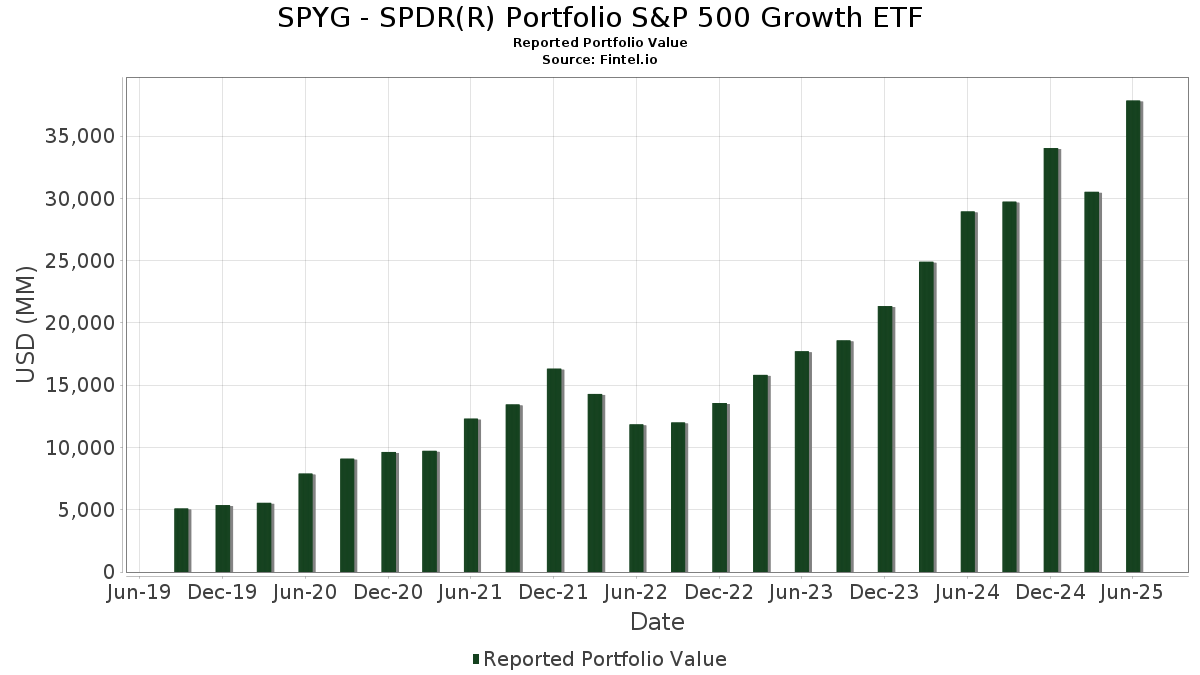
| Nilai Portfolio | $ 37,899,034,717 |
| Kedudukan Semasa | 212 |
Pegangan Terkini, Prestasi, AUM (dari 13F, 13D)
SPYG - SPDR(R) Portfolio S&P 500 Growth ETF telah mendedahkan 212 jumlah pegangan dalam pemfailan SEC terkini mereka. Nilai portfolio terkini dikira sebagai $ 37,899,034,717 USD. Aset Sebenar Di Bawah Pengurusan (AUM) ialah nilai ini ditambah dengan tunai (yang tidak didedahkan). Pegangan teratas SPYG - SPDR(R) Portfolio S&P 500 Growth ETF ialah NVIDIA Corporation (US:NVDA) , Microsoft Corporation (US:MSFT) , Meta Platforms, Inc. (US:META) , Apple Inc. (US:AAPL) , and Broadcom Inc. (US:AVGO) . Kedudukan baharu SPYG - SPDR(R) Portfolio S&P 500 Growth ETF termasuk Coinbase Global, Inc. (US:COIN) , .
Kenaikan Teratas Suku Tahun Ini
Kami menggunakan perubahan dalam peruntukan portfolio kerana ini adalah metrik yang paling bermakna. Perubahan boleh disebabkan oleh perdagangan atau perubahan dalam harga saham.
| Sekuriti | Saham (MM) |
Nilai (MM$) |
Portfolio % | ΔPortfolio % |
|---|---|---|---|---|
| 32.85 | 5,190.42 | 13.7255 | 2.5342 | |
| 6.33 | 1,745.96 | 4.6170 | 1.3079 | |
| 5.21 | 2,590.00 | 6.8490 | 0.7304 | |
| 2.93 | 2,158.95 | 5.7091 | 0.3873 | |
| 0.57 | 767.94 | 2.0307 | 0.3489 | |
| 2.19 | 479.17 | 1.2671 | 0.3108 | |
| 2.87 | 390.73 | 1.0332 | 0.3038 | |
| 0.37 | 194.61 | 0.5146 | 0.1595 | |
| 0.14 | 48.48 | 0.1282 | 0.1282 | |
| 3.78 | 1,199.51 | 3.1720 | 0.1141 |
Penurunan Teratas Suku Tahun Ini
Kami menggunakan perubahan dalam peruntukan portfolio kerana ini adalah metrik yang paling bermakna. Perubahan boleh disebabkan oleh perdagangan atau perubahan dalam harga saham.
| Sekuriti | Saham (MM) |
Nilai (MM$) |
Portfolio % | ΔPortfolio % |
|---|---|---|---|---|
| 9.26 | 1,898.89 | 5.0214 | -1.4506 | |
| 1.06 | 826.01 | 2.1843 | -0.5595 | |
| 1.21 | 588.17 | 1.5554 | -0.4615 | |
| 2.31 | 818.61 | 2.1647 | -0.3819 | |
| 1.09 | 614.22 | 1.6242 | -0.2579 | |
| 0.60 | 591.85 | 1.5651 | -0.2051 | |
| 0.75 | 128.81 | 0.3406 | -0.1891 | |
| 1.00 | 185.22 | 0.4898 | -0.1652 | |
| 1.29 | 352.56 | 0.9323 | -0.1505 | |
| 7.84 | 1,381.65 | 3.6536 | -0.1496 |
13F dan Pemfailan Dana
Borang ini telah difailkan pada 2025-08-28 untuk tempoh pelaporan 2025-06-30. Klik ikon pautan untuk melihat sejarah transaksi penuh.
Tingkatkan untuk membuka data premium dan eksport ke Excel ![]() .
.
| Sekuriti | Jenis | Purata Harga Saham | Saham (MM) |
ΔSaham (%) |
ΔSaham (%) |
Nilai ($MM) |
Portfolio (%) |
ΔPortfolio (%) |
|
|---|---|---|---|---|---|---|---|---|---|
| NVDA / NVIDIA Corporation | 32.85 | 4.27 | 5,190.42 | 52.00 | 13.7255 | 2.5342 | |||
| MSFT / Microsoft Corporation | 5.21 | 4.70 | 2,590.00 | 38.73 | 6.8490 | 0.7304 | |||
| META / Meta Platforms, Inc. | 2.93 | 3.82 | 2,158.95 | 32.96 | 5.7091 | 0.3873 | |||
| AAPL / Apple Inc. | 9.26 | 4.11 | 1,898.89 | -3.84 | 5.0214 | -1.4506 | |||
| AVGO / Broadcom Inc. | 6.33 | 5.04 | 1,745.96 | 72.93 | 4.6170 | 1.3079 | |||
| AMZN / Amazon.com, Inc. | 7.38 | 4.89 | 1,619.60 | 20.95 | 4.2829 | -0.1057 | |||
| GOOGL / Alphabet Inc. | 7.84 | 4.48 | 1,381.65 | 19.06 | 3.6536 | -0.1496 | |||
| TSLA / Tesla, Inc. | 3.78 | 4.89 | 1,199.51 | 28.56 | 3.1720 | 0.1141 | |||
| GOOG / Alphabet Inc. | 6.33 | 4.02 | 1,122.23 | 18.11 | 2.9676 | -0.1465 | |||
| LLY / Eli Lilly and Company | 1.06 | 4.54 | 826.01 | -1.34 | 2.1843 | -0.5595 | |||
| V / Visa Inc. | 2.31 | 3.99 | 818.61 | 5.35 | 2.1647 | -0.3819 | |||
| NFLX / Netflix, Inc. | 0.57 | 4.21 | 767.94 | 49.65 | 2.0307 | 0.3489 | |||
| JPM / JPMorgan Chase & Co. | 2.13 | 4.11 | 618.84 | 23.04 | 1.6365 | -0.0120 | |||
| MA / Mastercard Incorporated | 1.09 | 4.32 | 614.22 | 6.95 | 1.6242 | -0.2579 | |||
| COST / Costco Wholesale Corporation | 0.60 | 4.69 | 591.85 | 9.58 | 1.5651 | -0.2051 | |||
| BRK.B / Berkshire Hathaway Inc. | 1.21 | 4.79 | 588.17 | -4.42 | 1.5554 | -0.4615 | |||
| ORCL / Oracle Corporation | 2.19 | 5.01 | 479.17 | 64.22 | 1.2671 | 0.3108 | |||
| PLTR / Palantir Technologies Inc. | 2.87 | 8.69 | 390.73 | 75.55 | 1.0332 | 0.3038 | |||
| WMT / Walmart Inc. | 3.90 | 4.32 | 381.41 | 16.19 | 1.0086 | -0.0672 | |||
| IBM / International Business Machines Corporation | 1.25 | 5.28 | 369.18 | 24.81 | 0.9763 | 0.0068 | |||
| CRM / Salesforce, Inc. | 1.29 | 5.01 | 352.56 | 6.71 | 0.9323 | -0.1505 | |||
| INTU / Intuit Inc. | 0.38 | 4.63 | 296.76 | 34.22 | 0.7848 | 0.0601 | |||
| NOW / ServiceNow, Inc. | 0.28 | 5.25 | 286.76 | 35.91 | 0.7583 | 0.0668 | |||
| UBER / Uber Technologies, Inc. | 2.82 | 4.85 | 262.91 | 34.27 | 0.6952 | 0.0535 | |||
| ISRG / Intuitive Surgical, Inc. | 0.48 | 5.27 | 262.46 | 15.50 | 0.6940 | -0.0507 | |||
| BKNG / Booking Holdings Inc. | 0.04 | 2.99 | 253.96 | 29.42 | 0.6716 | 0.0284 | |||
| CAT / Caterpillar Inc. | 0.63 | 3.08 | 246.04 | 21.33 | 0.6506 | -0.0140 | |||
| AXP / American Express Company | 0.75 | 4.41 | 237.79 | 23.78 | 0.6288 | -0.0008 | |||
| HD / The Home Depot, Inc. | 0.59 | 4.59 | 215.63 | 4.64 | 0.5702 | -0.1052 | |||
| BSX / Boston Scientific Corporation | 1.99 | 5.14 | 214.13 | 11.95 | 0.5662 | -0.0607 | |||
| PGR / The Progressive Corporation | 0.79 | 4.59 | 210.36 | -1.37 | 0.5563 | -0.1428 | |||
| PM / Philip Morris International Inc. | 1.13 | 4.86 | 206.29 | 20.31 | 0.5455 | -0.0164 | |||
| GEV / GE Vernova Inc. | 0.37 | 3.61 | 194.61 | 79.59 | 0.5146 | 0.1595 | |||
| 3EC / Eaton Corporation plc | 0.53 | 3.71 | 188.23 | 36.20 | 0.4978 | 0.0448 | |||
| ABBV / AbbVie Inc. | 1.00 | 4.61 | 185.22 | -7.33 | 0.4898 | -0.1652 | |||
| PANW / Palo Alto Networks, Inc. | 0.89 | 4.60 | 182.32 | 25.44 | 0.4821 | 0.0058 | |||
| CRWD / CrowdStrike Holdings, Inc. | 0.34 | 5.91 | 170.94 | 52.99 | 0.4520 | 0.0858 | |||
| APH / Amphenol Corporation | 1.63 | 4.78 | 160.96 | 57.75 | 0.4256 | 0.0912 | |||
| KLAC / KLA Corporation | 0.18 | 4.17 | 159.53 | 37.25 | 0.4219 | 0.0409 | |||
| VRTX / Vertex Pharmaceuticals Incorporated | 0.35 | 4.63 | 153.90 | -3.92 | 0.4070 | -0.1180 | |||
| GE / General Electric Company | 0.59 | 4.07 | 151.64 | 33.83 | 0.4010 | 0.0296 | |||
| RTX / RTX Corporation | 1.03 | 5.04 | 149.83 | 15.79 | 0.3962 | -0.0279 | |||
| ANET / Arista Networks Inc | 1.39 | 4.61 | 142.23 | 38.13 | 0.3761 | 0.0386 | |||
| CEG / Constellation Energy Corporation | 0.42 | 4.61 | 135.89 | 67.45 | 0.3593 | 0.0934 | |||
| 2IS / Trane Technologies plc | 0.30 | 4.10 | 131.39 | 35.15 | 0.3474 | 0.0288 | |||
| FI / Fiserv, Inc. | 0.75 | 2.08 | 128.81 | -20.30 | 0.3406 | -0.1891 | |||
| NEE / NextEra Energy, Inc. | 1.85 | 4.61 | 128.73 | 2.44 | 0.3404 | -0.0714 | |||
| PH / Parker-Hannifin Corporation | 0.17 | 3.94 | 120.27 | 19.44 | 0.3181 | -0.0120 | |||
| TDG / TransDigm Group Incorporated | 0.08 | 4.61 | 114.82 | 15.00 | 0.3036 | -0.0236 | |||
| DASH / DoorDash, Inc. | 0.46 | 5.87 | 113.89 | 42.80 | 0.3012 | 0.0398 | |||
| TJX / The TJX Companies, Inc. | 0.89 | 3.98 | 109.56 | 5.42 | 0.2897 | -0.0509 | |||
| MS / Morgan Stanley | 0.75 | 4.63 | 105.58 | 26.33 | 0.2792 | 0.0053 | |||
| RCL / Royal Caribbean Cruises Ltd. | 0.34 | 5.68 | 105.42 | 61.09 | 0.2788 | 0.0643 | |||
| SPGI / S&P Global Inc. | 0.20 | 4.61 | 105.06 | 8.56 | 0.2778 | -0.0394 | |||
| ORLY / O'Reilly Automotive, Inc. | 1.15 | 1,457.44 | 103.82 | -2.01 | 0.2745 | -0.0727 | |||
| CTAS / Cintas Corporation | 0.46 | 4.61 | 102.88 | 13.44 | 0.2721 | -0.0252 | |||
| CMG / Chipotle Mexican Grill, Inc. | 1.81 | 4.07 | 101.89 | 16.38 | 0.2694 | -0.0175 | |||
| HWM / Howmet Aerospace Inc. | 0.55 | 4.63 | 101.48 | 50.12 | 0.2684 | 0.0468 | |||
| SYK / Stryker Corporation | 0.25 | 4.63 | 96.93 | 11.20 | 0.2563 | -0.0294 | |||
| ADP / Automatic Data Processing, Inc. | 0.31 | 4.60 | 96.24 | 5.58 | 0.2545 | -0.0442 | |||
| MSI / Motorola Solutions, Inc. | 0.22 | 4.59 | 94.55 | 0.45 | 0.2500 | -0.0585 | |||
| ADBE / Adobe Inc. | 0.24 | 2.55 | 93.32 | 3.44 | 0.2468 | -0.0489 | |||
| FTNT / Fortinet, Inc. | 0.86 | 4.63 | 90.53 | 14.91 | 0.2394 | -0.0188 | |||
| ADSK / Autodesk, Inc. | 0.29 | 4.60 | 89.56 | 23.68 | 0.2368 | -0.0005 | |||
| VST / Vistra Corp. | 0.46 | 4.65 | 88.78 | 72.70 | 0.2348 | 0.0663 | |||
| AMGN / Amgen Inc. | 0.31 | 4.61 | 86.80 | -6.24 | 0.2295 | -0.0739 | |||
| APO / Apollo Global Management, Inc. | 0.61 | 5.79 | 86.31 | 9.60 | 0.2282 | -0.0299 | |||
| HLT / Hilton Worldwide Holdings Inc. | 0.32 | 3.47 | 85.31 | 21.11 | 0.2256 | -0.0053 | |||
| AMAT / Applied Materials, Inc. | 0.46 | 4.63 | 84.12 | 31.99 | 0.2224 | 0.0136 | |||
| AZO / AutoZone, Inc. | 0.02 | 4.63 | 83.88 | 1.87 | 0.2218 | -0.0481 | |||
| MAR / Marriott International, Inc. | 0.31 | 3.99 | 83.64 | 19.28 | 0.2212 | -0.0086 | |||
| AXON / Axon Enterprise, Inc. | 0.10 | 6.96 | 82.52 | 68.37 | 0.2182 | 0.0576 | |||
| TMUS / T-Mobile US, Inc. | 0.34 | 4.62 | 81.50 | -6.54 | 0.2155 | -0.0703 | |||
| ABNB / Airbnb, Inc. | 0.58 | 4.61 | 77.10 | 15.89 | 0.2039 | -0.0142 | |||
| DE / Deere & Company | 0.15 | 4.64 | 76.29 | 13.37 | 0.2017 | -0.0188 | |||
| PWR / Quanta Services, Inc. | 0.20 | 4.63 | 75.12 | 55.64 | 0.1987 | 0.0405 | |||
| ICE / Intercontinental Exchange, Inc. | 0.40 | 4.65 | 73.80 | 11.30 | 0.1952 | -0.0222 | |||
| WELL / Welltower Inc. | 0.45 | 6.80 | 69.50 | 7.17 | 0.1838 | -0.0288 | |||
| EMR / Emerson Electric Co. | 0.52 | 4.64 | 68.82 | 27.25 | 0.1820 | 0.0047 | |||
| AMP / Ameriprise Financial, Inc. | 0.13 | 3.61 | 68.43 | 14.23 | 0.1810 | -0.0154 | |||
| RSG / Republic Services, Inc. | 0.27 | 4.62 | 67.37 | 6.54 | 0.1782 | -0.0291 | |||
| SPG / Simon Property Group, Inc. | 0.41 | 4.63 | 66.37 | 1.28 | 0.1755 | -0.0393 | |||
| URI / United Rentals, Inc. | 0.09 | 4.62 | 66.22 | 25.77 | 0.1751 | 0.0026 | |||
| PYPL / PayPal Holdings, Inc. | 0.88 | 2.98 | 65.26 | 17.29 | 0.1726 | -0.0098 | |||
| MMC / Marsh & McLennan Companies, Inc. | 0.29 | 4.66 | 63.62 | -6.23 | 0.1682 | -0.0541 | |||
| CDNS / Cadence Design Systems, Inc. | 0.20 | 4.67 | 62.60 | 26.83 | 0.1655 | 0.0038 | |||
| PSA / Public Storage | 0.21 | 4.66 | 62.27 | 2.61 | 0.1647 | -0.0342 | |||
| MO / Altria Group, Inc. | 1.05 | 4.64 | 61.53 | 2.21 | 0.1627 | -0.0346 | |||
| GWW / W.W. Grainger, Inc. | 0.06 | 3.26 | 61.27 | 8.75 | 0.1620 | -0.0226 | |||
| SHW / The Sherwin-Williams Company | 0.18 | 4.60 | 61.02 | 2.85 | 0.1614 | -0.0331 | |||
| CMI / Cummins Inc. | 0.19 | 4.61 | 60.59 | 9.30 | 0.1602 | -0.0215 | |||
| MSCI / MSCI Inc. | 0.10 | 4.61 | 60.27 | 6.69 | 0.1594 | -0.0258 | |||
| FICO / Fair Isaac Corporation | 0.03 | 4.56 | 60.03 | 3.64 | 0.1587 | -0.0311 | |||
| WM / Waste Management, Inc. | 0.26 | 4.65 | 59.64 | 3.44 | 0.1577 | -0.0313 | |||
| CPRT / Copart, Inc. | 1.18 | 4.63 | 57.92 | -9.27 | 0.1532 | -0.0561 | |||
| CBRE / CBRE Group, Inc. | 0.40 | 4.65 | 55.76 | 12.12 | 0.1474 | -0.0155 | |||
| SNPS / Synopsys, Inc. | 0.11 | 4.96 | 55.47 | 25.47 | 0.1467 | 0.0018 | |||
| MCO / Moody's Corporation | 0.11 | 4.50 | 54.29 | 12.56 | 0.1436 | -0.0145 | |||
| WMB / The Williams Companies, Inc. | 0.85 | 4.67 | 53.61 | 10.01 | 0.1418 | -0.0179 | |||
| KKR / KKR & Co. Inc. | 0.40 | 4.65 | 53.19 | 20.41 | 0.1407 | -0.0041 | |||
| 4VK / Aon plc | 0.15 | 4.46 | 52.89 | -6.62 | 0.1398 | -0.0458 | |||
| HCA / HCA Healthcare, Inc. | 0.14 | 1.46 | 52.75 | 12.48 | 0.1395 | -0.0142 | |||
| HES / Hess Corporation | 0.37 | 4.40 | 51.43 | -9.45 | 0.1360 | -0.0501 | |||
| TRGP / Targa Resources Corp. | 0.29 | 4.39 | 50.98 | -9.35 | 0.1348 | -0.0495 | |||
| RMD / ResMed Inc. | 0.20 | 4.41 | 50.90 | 20.34 | 0.1346 | -0.0040 | |||
| AJG / Arthur J. Gallagher & Co. | 0.15 | 4.63 | 49.31 | -2.99 | 0.1304 | -0.0362 | |||
| EQIX / Equinix, Inc. | 0.06 | 5.24 | 48.99 | 2.68 | 0.1295 | -0.0268 | |||
| GVMXX / State Street Institutional Investment Trust - State Street Institutional US Govt Money Market Fnd Premier Cls | 48.67 | 563.08 | 48.67 | 563.13 | 0.1287 | 0.1047 | |||
| COIN / Coinbase Global, Inc. | 0.14 | 48.48 | 0.1282 | 0.1282 | |||||
| WAB / Westinghouse Air Brake Technologies Corporation | 0.23 | 4.39 | 48.04 | 20.51 | 0.1270 | -0.0036 | |||
| BK / The Bank of New York Mellon Corporation | 0.52 | 4.41 | 47.43 | 13.42 | 0.1254 | -0.0116 | |||
| MPWR / Monolithic Power Systems, Inc. | 0.06 | 4.63 | 47.08 | 31.95 | 0.1245 | 0.0076 | |||
| RSK / Arch Capital Group Ltd. | 0.50 | 4.41 | 45.85 | -1.16 | 0.1212 | -0.0308 | |||
| IR / Ingersoll Rand Inc. | 0.54 | 4.38 | 45.00 | 8.48 | 0.1190 | -0.0170 | |||
| ECL / Ecolab Inc. | 0.17 | 4.40 | 44.69 | 10.96 | 0.1182 | -0.0138 | |||
| CL / Colgate-Palmolive Company | 0.48 | 4.43 | 43.61 | 1.31 | 0.1153 | -0.0258 | |||
| DAL / Delta Air Lines, Inc. | 0.88 | 6.59 | 43.27 | 20.23 | 0.1144 | -0.0035 | |||
| GRMN / Garmin Ltd. | 0.21 | 4.38 | 43.06 | 0.34 | 0.1139 | -0.0268 | |||
| NRG / NRG Energy, Inc. | 0.26 | 1.10 | 42.31 | 70.07 | 0.1119 | 0.0303 | |||
| BRO / Brown & Brown, Inc. | 0.38 | 23.65 | 41.85 | 10.20 | 0.1107 | -0.0138 | |||
| IT / Gartner, Inc. | 0.10 | 4.38 | 41.70 | 0.52 | 0.1103 | -0.0257 | |||
| IRM / Iron Mountain Incorporated | 0.39 | 4.41 | 40.47 | 24.47 | 0.1070 | 0.0005 | |||
| CCL / Carnival Corporation & plc | 1.41 | 5.08 | 39.63 | 51.29 | 0.1048 | 0.0189 | |||
| CARR / Carrier Global Corporation | 0.52 | 4.40 | 38.11 | 20.52 | 0.1008 | -0.0029 | |||
| OKE / ONEOK, Inc. | 0.47 | 4.39 | 38.09 | -14.11 | 0.1007 | -0.0446 | |||
| CSX / CSX Corporation | 1.16 | 2.04 | 38.00 | 13.13 | 0.1005 | -0.0096 | |||
| FAST / Fastenal Company | 0.88 | 108.76 | 36.87 | 13.06 | 0.0975 | -0.0094 | |||
| PCAR / PACCAR Inc | 0.39 | 4.40 | 36.82 | 1.92 | 0.0974 | -0.0210 | |||
| ITW / Illinois Tool Works Inc. | 0.15 | 4.49 | 36.40 | 4.17 | 0.0963 | -0.0183 | |||
| UAL / United Airlines Holdings, Inc. | 0.44 | 4.40 | 35.17 | 20.40 | 0.0930 | -0.0027 | |||
| SYF / Synchrony Financial | 0.51 | 2.43 | 34.19 | 29.13 | 0.0904 | 0.0036 | |||
| GDDY / GoDaddy Inc. | 0.19 | 4.75 | 34.19 | 4.71 | 0.0904 | -0.0166 | |||
| TYL / Tyler Technologies, Inc. | 0.06 | 4.23 | 34.02 | 6.29 | 0.0900 | -0.0149 | |||
| SMCI / Super Micro Computer, Inc. | 0.69 | 6.76 | 33.90 | 52.81 | 0.0896 | 0.0169 | |||
| WDAY / Workday, Inc. | 0.14 | 4.78 | 32.51 | 7.68 | 0.0860 | -0.0130 | |||
| LYV / Live Nation Entertainment, Inc. | 0.21 | 4.46 | 31.88 | 21.02 | 0.0843 | -0.0020 | |||
| CPAY / Corpay, Inc. | 0.09 | 4.46 | 31.09 | -0.61 | 0.0822 | -0.0203 | |||
| EBAY / eBay Inc. | 0.42 | 0.81 | 30.99 | 10.83 | 0.0820 | -0.0097 | |||
| VNX / NXP Semiconductors N.V. | 0.14 | 4.33 | 29.81 | 19.93 | 0.0788 | -0.0026 | |||
| PODD / Insulet Corporation | 0.09 | 4.43 | 29.61 | 24.94 | 0.0783 | 0.0006 | |||
| PAYX / Paychex, Inc. | 0.20 | 4.47 | 29.45 | -1.51 | 0.0779 | -0.0201 | |||
| HUBB / Hubbell Incorporated | 0.07 | 4.34 | 29.42 | 28.78 | 0.0778 | 0.0029 | |||
| VMC / Vulcan Materials Company | 0.11 | 4.43 | 28.69 | 16.74 | 0.0759 | -0.0047 | |||
| PHM / PulteGroup, Inc. | 0.27 | 4.35 | 28.66 | 7.05 | 0.0758 | -0.0120 | |||
| EXPE / Expedia Group, Inc. | 0.17 | 4.41 | 27.93 | 4.77 | 0.0738 | -0.0135 | |||
| WSM / Williams-Sonoma, Inc. | 0.17 | 4.42 | 27.01 | 7.90 | 0.0714 | -0.0106 | |||
| HIG / The Hartford Insurance Group, Inc. | 0.21 | 4.42 | 26.96 | 7.07 | 0.0713 | -0.0112 | |||
| TPL / Texas Pacific Land Corporation | 0.03 | 4.54 | 26.76 | -16.65 | 0.0708 | -0.0345 | |||
| PEG / Public Service Enterprise Group Incorporated | 0.31 | 4.42 | 26.48 | 6.81 | 0.0700 | -0.0112 | |||
| AME / AMETEK, Inc. | 0.15 | 4.29 | 26.39 | 9.63 | 0.0698 | -0.0091 | |||
| VRSK / Verisk Analytics, Inc. | 0.08 | 4.53 | 26.10 | 9.40 | 0.0690 | -0.0092 | |||
| MNST / Monster Beverage Corporation | 0.41 | 4.37 | 25.91 | 11.72 | 0.0685 | -0.0075 | |||
| LII / Lennox International Inc. | 0.04 | 4.04 | 24.56 | 6.35 | 0.0649 | -0.0107 | |||
| TPR / Tapestry, Inc. | 0.28 | 4.38 | 24.41 | 30.17 | 0.0645 | 0.0031 | |||
| RJF / Raymond James Financial, Inc. | 0.15 | 4.88 | 23.57 | 15.80 | 0.0623 | -0.0044 | |||
| MLM / Martin Marietta Materials, Inc. | 0.04 | 4.07 | 23.35 | 19.49 | 0.0617 | -0.0023 | |||
| DELL / Dell Technologies Inc. | 0.19 | 1.83 | 23.26 | 36.96 | 0.0615 | 0.0059 | |||
| YUM / Yum! Brands, Inc. | 0.15 | 4.30 | 22.75 | -1.79 | 0.0602 | -0.0158 | |||
| DECK / Deckers Outdoor Corporation | 0.20 | 4.43 | 21.02 | -3.73 | 0.0556 | -0.0160 | |||
| NDAQ / Nasdaq, Inc. | 0.23 | 4.41 | 20.45 | 23.07 | 0.0541 | -0.0004 | |||
| TSCO / Tractor Supply Company | 0.39 | 4.40 | 20.44 | -0.02 | 0.0541 | -0.0130 | |||
| LVS / Las Vegas Sands Corp. | 0.46 | 4.37 | 20.08 | 17.56 | 0.0531 | -0.0029 | |||
| DXCM / DexCom, Inc. | 0.23 | 4.40 | 19.75 | 33.45 | 0.0522 | 0.0037 | |||
| WTY / Willis Towers Watson Public Limited Company | 0.06 | 4.32 | 19.71 | -5.39 | 0.0521 | -0.0162 | |||
| EA / Electronic Arts Inc. | 0.12 | 0.59 | 19.60 | 11.15 | 0.0518 | -0.0060 | |||
| ODFL / Old Dominion Freight Line, Inc. | 0.12 | 4.48 | 18.91 | 2.49 | 0.0500 | -0.0105 | |||
| EXR / Extra Space Storage Inc. | 0.13 | 4.34 | 18.88 | 3.60 | 0.0499 | -0.0098 | |||
| ANSS / ANSYS, Inc. | 0.05 | 4.70 | 18.25 | 16.16 | 0.0482 | -0.0032 | |||
| NVR / NVR, Inc. | 0.00 | 2.49 | 18.24 | 4.49 | 0.0482 | -0.0090 | |||
| PPL / PPL Corporation | 0.52 | 4.37 | 17.53 | -2.05 | 0.0463 | -0.0123 | |||
| AVB / AvalonBay Communities, Inc. | 0.08 | 4.54 | 17.16 | -0.87 | 0.0454 | -0.0114 | |||
| BR / Broadridge Financial Solutions, Inc. | 0.07 | 4.52 | 16.86 | 4.76 | 0.0446 | -0.0082 | |||
| CINF / Cincinnati Financial Corporation | 0.11 | 4.36 | 16.63 | 5.20 | 0.0440 | -0.0078 | |||
| LULU / lululemon athletica inc. | 0.07 | 4.52 | 16.47 | -12.27 | 0.0435 | -0.0180 | |||
| WRB / W. R. Berkley Corporation | 0.22 | 4.39 | 16.29 | 7.77 | 0.0431 | -0.0065 | |||
| TKO / TKO Group Holdings, Inc. | 0.09 | 4.28 | 16.25 | 24.16 | 0.0430 | 0.0001 | |||
| VLTO / Veralto Corporation | 0.16 | 4.34 | 16.15 | 8.09 | 0.0427 | -0.0063 | |||
| PAYC / Paycom Software, Inc. | 0.07 | 8.39 | 15.19 | 14.79 | 0.0402 | -0.0032 | |||
| DOV / Dover Corporation | 0.08 | 4.19 | 15.17 | 8.67 | 0.0401 | -0.0056 | |||
| DRI / Darden Restaurants, Inc. | 0.07 | 4.60 | 14.86 | 9.74 | 0.0393 | -0.0051 | |||
| PNR / Pentair plc | 0.14 | 4.32 | 14.86 | 22.42 | 0.0393 | -0.0005 | |||
| RL / Ralph Lauren Corporation | 0.05 | 4.54 | 14.72 | 29.90 | 0.0389 | 0.0018 | |||
| LDOS / Leidos Holdings, Inc. | 0.09 | 4.51 | 14.47 | 22.19 | 0.0383 | -0.0005 | |||
| NTAP / NetApp, Inc. | 0.13 | 4.33 | 13.67 | 26.56 | 0.0361 | 0.0007 | |||
| MTD / Mettler-Toledo International Inc. | 0.01 | 4.15 | 13.47 | 3.61 | 0.0356 | -0.0070 | |||
| PTC / PTC Inc. | 0.08 | 4.57 | 13.13 | 16.30 | 0.0347 | -0.0023 | |||
| WAT / Waters Corporation | 0.04 | 4.73 | 12.87 | -0.82 | 0.0340 | -0.0085 | |||
| FSLR / First Solar, Inc. | 0.08 | 4.55 | 12.67 | 36.88 | 0.0335 | 0.0032 | |||
| GEN / Gen Digital Inc. | 0.42 | 4.36 | 12.45 | 15.61 | 0.0329 | -0.0024 | |||
| ROL / Rollins, Inc. | 0.22 | 4.43 | 12.39 | 9.06 | 0.0328 | -0.0045 | |||
| NCLH / Norwegian Cruise Line Holdings Ltd. | 0.59 | 4.42 | 12.02 | 11.69 | 0.0318 | -0.0035 | |||
| DAY / Dayforce Inc. | 0.21 | 5.17 | 11.86 | -0.13 | 0.0314 | -0.0076 | |||
| ESS / Essex Property Trust, Inc. | 0.04 | 4.18 | 11.77 | -3.70 | 0.0311 | -0.0089 | |||
| ERIE / Erie Indemnity Company | 0.03 | 4.13 | 11.64 | -13.83 | 0.0308 | -0.0135 | |||
| PKG / Packaging Corporation of America | 0.06 | 4.63 | 11.34 | -0.42 | 0.0300 | -0.0073 | |||
| WYNN / Wynn Resorts, Limited | 0.12 | 4.33 | 11.26 | 17.05 | 0.0298 | -0.0018 | |||
| TRMB / Trimble Inc. | 0.14 | 4.32 | 11.00 | 20.74 | 0.0291 | -0.0008 | |||
| FFIV / F5, Inc. | 0.04 | 4.43 | 10.48 | 15.43 | 0.0277 | -0.0020 | |||
| FDS / FactSet Research Systems Inc. | 0.02 | 4.53 | 10.31 | 2.83 | 0.0273 | -0.0056 | |||
| ZBRA / Zebra Technologies Corporation | 0.03 | 4.45 | 9.65 | 13.97 | 0.0255 | -0.0022 | |||
| MAA / Mid-America Apartment Communities, Inc. | 0.06 | 4.30 | 9.56 | -7.88 | 0.0253 | -0.0087 | |||
| HST / Host Hotels & Resorts, Inc. | 0.59 | 4.39 | 9.12 | 12.84 | 0.0241 | -0.0024 | |||
| BLDR / Builders FirstSource, Inc. | 0.08 | -0.26 | 9.00 | -6.84 | 0.0238 | -0.0079 | |||
| ALLE / Allegion plc | 0.06 | 4.48 | 8.95 | 15.42 | 0.0237 | -0.0017 | |||
| INCY / Incyte Corporation | 0.13 | 4.30 | 8.80 | 17.30 | 0.0233 | -0.0013 | |||
| DPZ / Domino's Pizza, Inc. | 0.02 | 3.57 | 8.70 | 1.58 | 0.0230 | -0.0051 | |||
| CPT / Camden Property Trust | 0.07 | 4.26 | 8.26 | -3.92 | 0.0218 | -0.0063 | |||
| DVA / DaVita Inc. | 0.06 | -1.60 | 7.93 | -8.38 | 0.0210 | -0.0074 | |||
| MAS / Masco Corporation | 0.12 | 4.47 | 7.52 | -3.32 | 0.0199 | -0.0056 | |||
| UDR / UDR, Inc. | 0.18 | 4.39 | 7.44 | -5.65 | 0.0197 | -0.0062 | |||
| GNRC / Generac Holdings Inc. | 0.05 | 4.19 | 7.11 | 17.81 | 0.0188 | -0.0010 | |||
| JKHY / Jack Henry & Associates, Inc. | 0.04 | 4.42 | 7.09 | 3.04 | 0.0187 | -0.0038 |