Statistik Asas
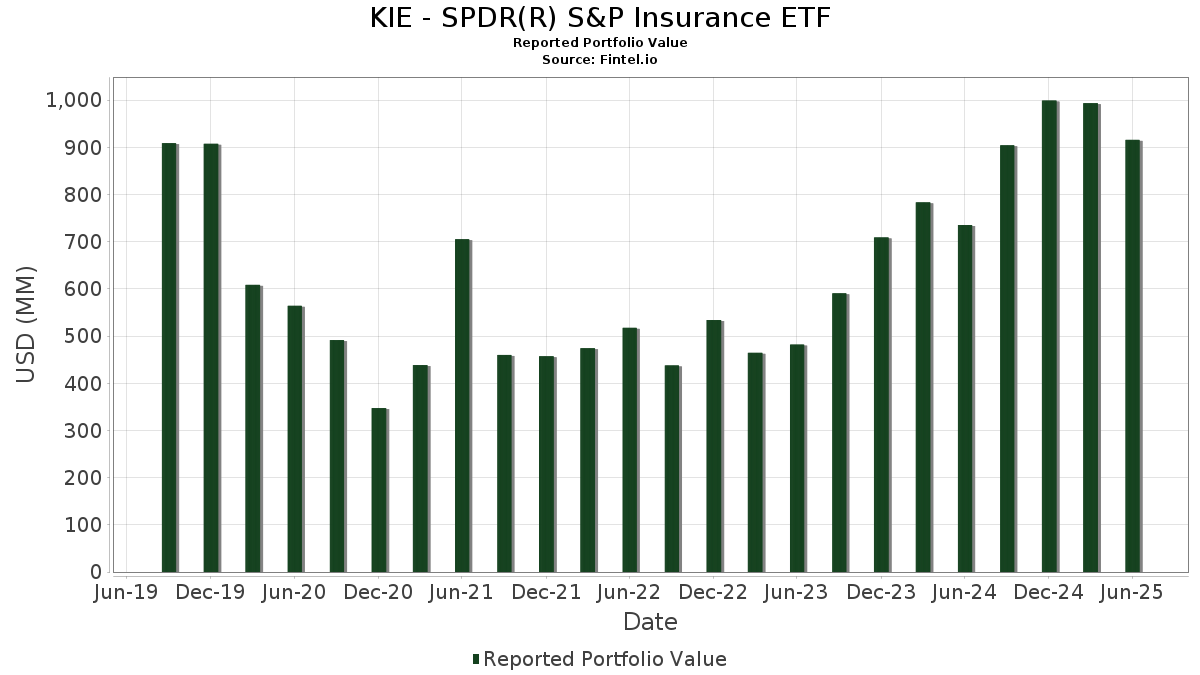
| Nilai Portfolio | $ 915,904,592 |
| Kedudukan Semasa | 56 |
Pegangan Terkini, Prestasi, AUM (dari 13F, 13D)
KIE - SPDR(R) S&P Insurance ETF telah mendedahkan 56 jumlah pegangan dalam pemfailan SEC terkini mereka. Nilai portfolio terkini dikira sebagai $ 915,904,592 USD. Aset Sebenar Di Bawah Pengurusan (AUM) ialah nilai ini ditambah dengan tunai (yang tidak didedahkan). Pegangan teratas KIE - SPDR(R) S&P Insurance ETF ialah Oscar Health, Inc. (US:OSCR) , State Street Institutional Investment Trust - State Street Institutional US Govt Money Market Fnd Premier Cls (US:GVMXX) , Genworth Financial, Inc. (US:GNW) , The Baldwin Insurance Group, Inc. (US:BWIN) , and Brown & Brown, Inc. (US:BRO) . Kedudukan baharu KIE - SPDR(R) S&P Insurance ETF termasuk Skyward Specialty Insurance Group, Inc. (US:SKWD) , .
Kenaikan Teratas Suku Tahun Ini
Kami menggunakan perubahan dalam peruntukan portfolio kerana ini adalah metrik yang paling bermakna. Perubahan boleh disebabkan oleh perdagangan atau perubahan dalam harga saham.
| Sekuriti | Saham (MM) |
Nilai (MM$) |
Portfolio % | ΔPortfolio % |
|---|---|---|---|---|
| 20.21 | 20.21 | 2.2557 | 2.1064 | |
| 0.27 | 15.77 | 1.7599 | 1.7599 | |
| 1.14 | 24.41 | 2.7245 | 1.0651 | |
| 0.38 | 16.63 | 1.8567 | 0.2383 | |
| 0.06 | 16.98 | 1.8950 | 0.0515 | |
| 2.33 | 18.11 | 2.0217 | 0.0420 | |
| 0.49 | 16.84 | 1.8794 | 0.0413 | |
| 0.05 | 16.42 | 1.8333 | 0.0328 | |
| 0.25 | 16.69 | 1.8630 | 0.0293 | |
| 0.21 | 16.73 | 1.8674 | 0.0178 |
Penurunan Teratas Suku Tahun Ini
Kami menggunakan perubahan dalam peruntukan portfolio kerana ini adalah metrik yang paling bermakna. Perubahan boleh disebabkan oleh perdagangan atau perubahan dalam harga saham.
| Sekuriti | Saham (MM) |
Nilai (MM$) |
Portfolio % | ΔPortfolio % |
|---|---|---|---|---|
| 1.34 | 1.34 | 0.1493 | -0.8725 | |
| 0.20 | 13.32 | 1.4864 | -0.3005 | |
| 0.22 | 16.35 | 1.8251 | -0.2539 | |
| 0.28 | 15.20 | 1.6970 | -0.2252 | |
| 0.22 | 15.90 | 1.7749 | -0.1779 | |
| 0.10 | 15.73 | 1.7558 | -0.1340 | |
| 0.19 | 16.40 | 1.8306 | -0.1283 | |
| 0.19 | 16.34 | 1.8236 | -0.1214 | |
| 0.09 | 16.10 | 1.7971 | -0.1142 | |
| 0.16 | 16.57 | 1.8490 | -0.1126 |
13F dan Pemfailan Dana
Borang ini telah difailkan pada 2025-08-28 untuk tempoh pelaporan 2025-06-30. Klik ikon pautan untuk melihat sejarah transaksi penuh.
Tingkatkan untuk membuka data premium dan eksport ke Excel ![]() .
.
| Sekuriti | Jenis | Purata Harga Saham | Saham (MM) |
ΔSaham (%) |
ΔSaham (%) |
Nilai ($MM) |
Portfolio (%) |
ΔPortfolio (%) |
|
|---|---|---|---|---|---|---|---|---|---|
| OSCR / Oscar Health, Inc. | 1.14 | -8.58 | 24.41 | 49.51 | 2.7245 | 1.0651 | |||
| GVMXX / State Street Institutional Investment Trust - State Street Institutional US Govt Money Market Fnd Premier Cls | 20.21 | 1,410.41 | 20.21 | 1,411.44 | 2.2557 | 2.1064 | |||
| GNW / Genworth Financial, Inc. | 2.33 | -15.26 | 18.11 | -7.01 | 2.0217 | 0.0420 | |||
| BWIN / The Baldwin Insurance Group, Inc. | 0.41 | -8.13 | 17.42 | -12.00 | 1.9440 | -0.0676 | |||
| BRO / Brown & Brown, Inc. | 0.15 | 2.22 | 17.10 | -8.90 | 1.9082 | 0.0009 | |||
| PRI / Primerica, Inc. | 0.06 | -2.68 | 16.98 | -6.39 | 1.8950 | 0.0515 | |||
| KNSL / Kinsale Capital Group, Inc. | 0.03 | -11.25 | 16.94 | -11.76 | 1.8904 | -0.0605 | |||
| FAF / First American Financial Corporation | 0.28 | -3.51 | 16.89 | -9.74 | 1.8858 | -0.0168 | |||
| ORI / Old Republic International Corporation | 0.44 | -9.51 | 16.86 | -11.31 | 1.8824 | -0.0503 | |||
| LNC / Lincoln National Corporation | 0.49 | -3.37 | 16.84 | -6.90 | 1.8794 | 0.0413 | |||
| RYAN / Ryan Specialty Holdings, Inc. | 0.25 | -3.29 | 16.79 | -10.98 | 1.8743 | -0.0431 | |||
| AFL / Aflac Incorporated | 0.16 | -5.93 | 16.76 | -10.78 | 1.8712 | -0.0387 | |||
| PFG / Principal Financial Group, Inc. | 0.21 | -2.34 | 16.73 | -8.06 | 1.8674 | 0.0178 | |||
| GL / Globe Life Inc. | 0.13 | -6.98 | 16.72 | -12.23 | 1.8660 | -0.0700 | |||
| MCY / Mercury General Corporation | 0.25 | -23.20 | 16.69 | -7.48 | 1.8630 | 0.0293 | |||
| AGO / Assured Guaranty Ltd. | 0.19 | -9.04 | 16.69 | -10.08 | 1.8625 | -0.0235 | |||
| MKL / Markel Group Inc. | 0.01 | -14.21 | 16.68 | -8.35 | 1.8618 | 0.0121 | |||
| L / Loews Corporation | 0.18 | -13.63 | 16.68 | -13.86 | 1.8614 | -0.1064 | |||
| WTY / Willis Towers Watson Public Limited Company | 0.05 | -1.33 | 16.66 | -10.52 | 1.8599 | -0.0328 | |||
| LMND / Lemonade, Inc. | 0.38 | -25.05 | 16.63 | 4.47 | 1.8567 | 0.2383 | |||
| CNO / CNO Financial Group, Inc. | 0.43 | -5.03 | 16.58 | -12.03 | 1.8505 | -0.0650 | |||
| AXV / AXIS Capital Holdings Limited | 0.16 | -17.13 | 16.57 | -14.17 | 1.8490 | -0.1126 | |||
| PRU / Prudential Financial, Inc. | 0.15 | -7.65 | 16.55 | -11.16 | 1.8469 | -0.0461 | |||
| UNM / Unum Group | 0.20 | -10.04 | 16.54 | -10.81 | 1.8463 | -0.0388 | |||
| AFG / American Financial Group, Inc. | 0.13 | -8.37 | 16.54 | -11.95 | 1.8459 | -0.0631 | |||
| ALL / The Allstate Corporation | 0.08 | -7.88 | 16.53 | -10.44 | 1.8452 | -0.0310 | |||
| WTM / White Mountains Insurance Group, Ltd. | 0.01 | -4.28 | 16.49 | -10.75 | 1.8407 | -0.0373 | |||
| TRV / The Travelers Companies, Inc. | 0.06 | -12.19 | 16.48 | -11.16 | 1.8390 | -0.0461 | |||
| KMPR / Kemper Corporation | 0.26 | -5.66 | 16.47 | -8.93 | 1.8381 | 0.0003 | |||
| AJG / Arthur J. Gallagher & Co. | 0.05 | -5.46 | 16.46 | -12.34 | 1.8371 | -0.0712 | |||
| HIG / The Hartford Insurance Group, Inc. | 0.13 | -15.23 | 16.43 | -13.08 | 1.8343 | -0.0874 | |||
| 4VK / Aon plc | 0.05 | 3.72 | 16.42 | -7.28 | 1.8333 | 0.0328 | |||
| MET / MetLife, Inc. | 0.20 | -8.63 | 16.42 | -8.48 | 1.8326 | 0.0092 | |||
| RSK / Arch Capital Group Ltd. | 0.18 | -9.17 | 16.41 | -14.02 | 1.8317 | -0.1081 | |||
| SIGI / Selective Insurance Group, Inc. | 0.19 | -10.10 | 16.40 | -14.91 | 1.8306 | -0.1283 | |||
| WRB / W. R. Berkley Corporation | 0.22 | -22.57 | 16.35 | -20.06 | 1.8251 | -0.2539 | |||
| CB / Chubb Limited | 0.06 | -9.46 | 16.34 | -13.14 | 1.8241 | -0.0882 | |||
| AIG / American International Group, Inc. | 0.19 | -13.28 | 16.34 | -14.62 | 1.8236 | -0.1214 | |||
| PGR / The Progressive Corporation | 0.06 | -3.87 | 16.33 | -9.36 | 1.8230 | -0.0084 | |||
| ERE / Everest Group, Ltd. | 0.05 | -5.49 | 16.33 | -11.60 | 1.8225 | -0.0549 | |||
| CINF / Cincinnati Financial Corporation | 0.11 | -13.29 | 16.32 | -12.59 | 1.8219 | -0.0760 | |||
| FNF / Fidelity National Financial, Inc. | 0.29 | 0.93 | 16.23 | -13.06 | 1.8118 | -0.0859 | |||
| MMC / Marsh & McLennan Companies, Inc. | 0.07 | -3.59 | 16.21 | -13.62 | 1.8093 | -0.0981 | |||
| RRJ / RenaissanceRe Holdings Ltd. | 0.07 | -11.46 | 16.20 | -10.39 | 1.8077 | -0.0293 | |||
| AIZ / Assurant, Inc. | 0.08 | -6.72 | 16.17 | -12.18 | 1.8046 | -0.0665 | |||
| ESGR / Enstar Group Limited | 0.05 | -10.00 | 16.14 | -8.92 | 1.8017 | 0.0003 | |||
| RGA / Reinsurance Group of America, Incorporated | 0.08 | -13.62 | 16.12 | -12.98 | 1.7992 | -0.0835 | |||
| THG / The Hanover Insurance Group, Inc. | 0.09 | -12.32 | 16.10 | -14.38 | 1.7971 | -0.1142 | |||
| RLI / RLI Corp. | 0.22 | -7.94 | 15.90 | -17.23 | 1.7749 | -0.1779 | |||
| GSHD / Goosehead Insurance, Inc | 0.15 | -0.64 | 15.78 | -11.21 | 1.7617 | -0.0449 | |||
| SKWD / Skyward Specialty Insurance Group, Inc. | 0.27 | 15.77 | 1.7599 | 1.7599 | |||||
| PLMR / Palomar Holdings, Inc. | 0.10 | -24.81 | 15.73 | -15.39 | 1.7558 | -0.1340 | |||
| ERIE / Erie Indemnity Company | 0.05 | 6.81 | 15.64 | -11.61 | 1.7458 | -0.0527 | |||
| BHF / Brighthouse Financial, Inc. | 0.28 | -13.30 | 15.20 | -19.61 | 1.6970 | -0.2252 | |||
| STC / Stewart Information Services Corporation | 0.20 | -16.98 | 13.32 | -24.25 | 1.4864 | -0.3005 | |||
| GVMXX / State Street Institutional Investment Trust - State Street Institutional US Govt Money Market Fnd Premier Cls | 1.34 | -86.69 | 1.34 | -86.70 | 0.1493 | -0.8725 |