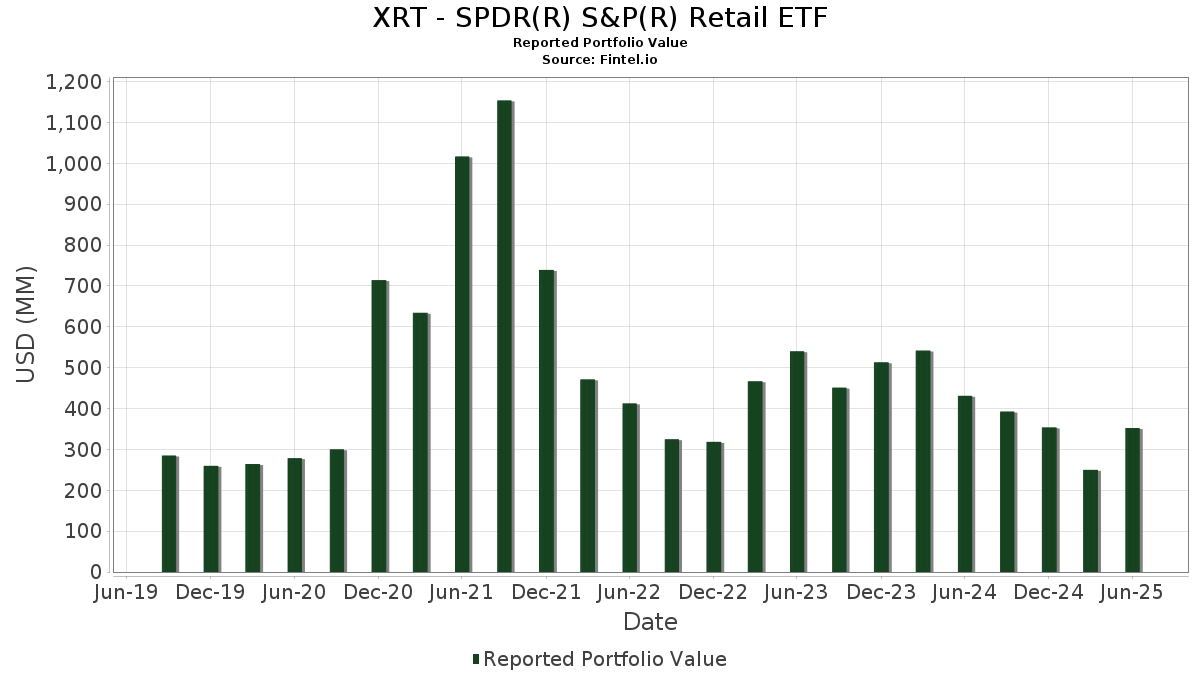
Statistik Asas
| Nilai Portfolio | $ 352,266,921 |
| Kedudukan Semasa | 77 |
Pegangan Terkini, Prestasi, AUM (dari 13F, 13D)
XRT - SPDR(R) S&P(R) Retail ETF telah mendedahkan 77 jumlah pegangan dalam pemfailan SEC terkini mereka. Nilai portfolio terkini dikira sebagai $ 352,266,921 USD. Aset Sebenar Di Bawah Pengurusan (AUM) ialah nilai ini ditambah dengan tunai (yang tidak didedahkan). Pegangan teratas XRT - SPDR(R) S&P(R) Retail ETF ialah State Street Institutional Investment Trust - State Street Institutional US Govt Money Market Fnd Premier Cls (US:GVMXX) , Ollie's Bargain Outlet Holdings, Inc. (US:OLLI) , Bath & Body Works, Inc. (US:BBWI) , The Kroger Co. (US:KR) , and National Vision Holdings, Inc. (US:EYE) . Kedudukan baharu XRT - SPDR(R) S&P(R) Retail ETF termasuk Natural Grocers by Vitamin Cottage, Inc. (US:NGVC) , .
Kenaikan Teratas Suku Tahun Ini
Kami menggunakan perubahan dalam peruntukan portfolio kerana ini adalah metrik yang paling bermakna. Perubahan boleh disebabkan oleh perdagangan atau perubahan dalam harga saham.
| Sekuriti | Saham (MM) |
Nilai (MM$) |
Portfolio % | ΔPortfolio % |
|---|---|---|---|---|
| 0.08 | 3.03 | 0.9823 | 0.9823 | |
| 0.13 | 4.37 | 1.4170 | 0.7912 | |
| 0.06 | 4.15 | 1.3454 | 0.6525 | |
| 0.09 | 4.46 | 1.4459 | 0.3143 | |
| 0.06 | 4.45 | 1.4431 | 0.2313 | |
| 0.19 | 3.45 | 1.1187 | 0.1998 | |
| 0.18 | 4.33 | 1.4030 | 0.1713 | |
| 0.16 | 4.87 | 1.5784 | 0.1634 | |
| 0.03 | 4.35 | 1.4113 | 0.1601 | |
| 0.01 | 4.21 | 1.3657 | 0.1520 |
Penurunan Teratas Suku Tahun Ini
Kami menggunakan perubahan dalam peruntukan portfolio kerana ini adalah metrik yang paling bermakna. Perubahan boleh disebabkan oleh perdagangan atau perubahan dalam harga saham.
| Sekuriti | Saham (MM) |
Nilai (MM$) |
Portfolio % | ΔPortfolio % |
|---|---|---|---|---|
| 22.09 | 22.09 | 7.1641 | -2.5077 | |
| 0.24 | 2.91 | 0.9431 | -0.3955 | |
| 0.07 | 3.55 | 1.1528 | -0.2830 | |
| 0.32 | 3.98 | 1.2919 | -0.2670 | |
| 0.20 | 3.76 | 1.2201 | -0.2586 | |
| 0.05 | 4.29 | 1.3897 | -0.2498 | |
| 0.01 | 4.22 | 1.3700 | -0.2244 | |
| 0.15 | 3.64 | 1.1819 | -0.2058 | |
| 0.05 | 4.49 | 1.4545 | -0.2032 | |
| 0.04 | 4.38 | 1.4198 | -0.1864 |
13F dan Pemfailan Dana
Borang ini telah difailkan pada 2025-08-28 untuk tempoh pelaporan 2025-06-30. Klik ikon pautan untuk melihat sejarah transaksi penuh.
Tingkatkan untuk membuka data premium dan eksport ke Excel ![]() .
.
| Sekuriti | Jenis | Purata Harga Saham | Saham (MM) |
ΔSaham (%) |
ΔSaham (%) |
Nilai ($MM) |
Portfolio (%) |
ΔPortfolio (%) |
|
|---|---|---|---|---|---|---|---|---|---|
| GVMXX / State Street Institutional Investment Trust - State Street Institutional US Govt Money Market Fnd Premier Cls | 22.09 | 0.20 | 22.09 | 0.20 | 7.1641 | -2.5077 | |||
| OLLI / Ollie's Bargain Outlet Holdings, Inc. | 0.04 | 24.94 | 5.01 | 41.52 | 1.6261 | 0.0715 | |||
| BBWI / Bath & Body Works, Inc. | 0.16 | 52.71 | 4.87 | 50.91 | 1.5784 | 0.1634 | |||
| KR / The Kroger Co. | 0.07 | 37.65 | 4.74 | 45.87 | 1.5356 | 0.1115 | |||
| EYE / National Vision Holdings, Inc. | 0.20 | -24.11 | 4.57 | 36.66 | 1.4820 | 0.0149 | |||
| DKS / DICK'S Sporting Goods, Inc. | 0.02 | 44.53 | 4.57 | 41.88 | 1.4810 | 0.0686 | |||
| VVV / Valvoline Inc. | 0.12 | 31.43 | 4.49 | 43.01 | 1.4557 | 0.0785 | |||
| DLTR / Dollar Tree, Inc. | 0.05 | -10.03 | 4.49 | 18.68 | 1.4545 | -0.2032 | |||
| FIVE / Five Below, Inc. | 0.03 | -19.37 | 4.48 | 41.20 | 1.4515 | 0.0607 | |||
| ANF / Abercrombie & Fitch Co. | 0.05 | 32.56 | 4.47 | 43.81 | 1.4508 | 0.0861 | |||
| URBN / Urban Outfitters, Inc. | 0.06 | 4.72 | 4.47 | 44.99 | 1.4496 | 0.0969 | |||
| CHWY / Chewy, Inc. | 0.10 | 11.70 | 4.46 | 46.45 | 1.4466 | 0.1103 | |||
| BBW / Build-A-Bear Workshop, Inc. | 0.09 | 24.60 | 4.46 | 72.90 | 1.4459 | 0.3143 | |||
| SAH / Sonic Automotive, Inc. | 0.06 | 14.80 | 4.45 | 61.12 | 1.4431 | 0.2313 | |||
| BKE / The Buckle, Inc. | 0.10 | 13.29 | 4.43 | 34.07 | 1.4371 | -0.0129 | |||
| DDS / Dillard's, Inc. | 0.01 | 23.48 | 4.43 | 44.08 | 1.4352 | 0.0875 | |||
| SFM / Sprouts Farmers Market, Inc. | 0.03 | 17.61 | 4.39 | 26.86 | 1.4246 | -0.0945 | |||
| AMZN / Amazon.com, Inc. | 0.02 | 27.69 | 4.39 | 47.27 | 1.4237 | 0.1157 | |||
| TSCO / Tractor Supply Company | 0.08 | 39.71 | 4.39 | 33.82 | 1.4229 | -0.0156 | |||
| DG / Dollar General Corporation | 0.04 | -8.08 | 4.38 | 19.58 | 1.4198 | -0.1864 | |||
| CART / Maplebear Inc. | 0.10 | 20.28 | 4.37 | 36.40 | 1.4170 | 0.0118 | |||
| GRPN / Groupon, Inc. | 0.13 | -47.97 | 4.37 | 77.96 | 1.4170 | 0.7912 | |||
| ULTA / Ulta Beauty, Inc. | 0.01 | -1.35 | 4.37 | 25.92 | 1.4166 | -0.1054 | |||
| AN / AutoNation, Inc. | 0.02 | 16.51 | 4.36 | 42.92 | 1.4148 | 0.0759 | |||
| CASY / Casey's General Stores, Inc. | 0.01 | 10.21 | 4.36 | 29.55 | 1.4134 | -0.0623 | |||
| WMT / Walmart Inc. | 0.04 | 21.71 | 4.35 | 35.55 | 1.4120 | 0.0030 | |||
| PAG / Penske Automotive Group, Inc. | 0.03 | 27.86 | 4.35 | 52.59 | 1.4113 | 0.1601 | |||
| AZO / AutoZone, Inc. | 0.00 | 31.43 | 4.35 | 27.97 | 1.4096 | -0.0806 | |||
| FL / Foot Locker, Inc. | 0.18 | -11.32 | 4.33 | 54.11 | 1.4030 | 0.1713 | |||
| WBA / Walgreens Boots Alliance, Inc. | 0.38 | 35.20 | 4.32 | 38.96 | 1.4006 | 0.0371 | |||
| ACI / Albertsons Companies, Inc. | 0.20 | 34.17 | 4.31 | 31.24 | 1.3991 | -0.0430 | |||
| SBH / Sally Beauty Holdings, Inc. | 0.47 | 35.68 | 4.31 | 39.14 | 1.3986 | 0.0388 | |||
| TGT / Target Corporation | 0.04 | 49.66 | 4.29 | 41.46 | 1.3910 | 0.0609 | |||
| SIG / Signet Jewelers Limited | 0.05 | -16.31 | 4.29 | 14.66 | 1.3897 | -0.2498 | |||
| LAD / Lithia Motors, Inc. | 0.01 | 21.34 | 4.28 | 39.64 | 1.3879 | 0.0434 | |||
| ORLY / O'Reilly Automotive, Inc. | 0.05 | 1,889.01 | 4.27 | 25.14 | 1.3853 | -0.1122 | |||
| COST / Costco Wholesale Corporation | 0.00 | 27.53 | 4.24 | 33.49 | 1.3755 | -0.0184 | |||
| BJ / BJ's Wholesale Club Holdings, Inc. | 0.04 | 36.67 | 4.23 | 29.15 | 1.3721 | -0.0649 | |||
| TJX / The TJX Companies, Inc. | 0.03 | 26.78 | 4.23 | 28.56 | 1.3721 | -0.0719 | |||
| ASO / Academy Sports and Outdoors, Inc. | 0.09 | 35.88 | 4.23 | 33.47 | 1.3710 | -0.0183 | |||
| KMX / CarMax, Inc. | 0.06 | 46.37 | 4.23 | 26.25 | 1.3708 | -0.0980 | |||
| CVNA / Carvana Co. | 0.01 | -27.88 | 4.22 | 16.24 | 1.3700 | -0.2244 | |||
| GPI / Group 1 Automotive, Inc. | 0.01 | 33.13 | 4.21 | 52.24 | 1.3657 | 0.1520 | |||
| ABG / Asbury Automotive Group, Inc. | 0.02 | 36.91 | 4.19 | 47.88 | 1.3581 | 0.1158 | |||
| MUSA / Murphy USA Inc. | 0.01 | 49.17 | 4.19 | 29.16 | 1.3575 | -0.0642 | |||
| GAP / The Gap, Inc. | 0.19 | 28.80 | 4.16 | 36.31 | 1.3501 | 0.0102 | |||
| PSMT / PriceSmart, Inc. | 0.04 | 6.03 | 4.16 | 26.79 | 1.3490 | -0.0904 | |||
| BURL / Burlington Stores, Inc. | 0.02 | 39.63 | 4.16 | 36.30 | 1.3483 | 0.0102 | |||
| WMK / Weis Markets, Inc. | 0.06 | 179.20 | 4.15 | 162.70 | 1.3454 | 0.6525 | |||
| WRBY / Warby Parker Inc. | 0.19 | 23.94 | 4.14 | 49.10 | 1.3424 | 0.1244 | |||
| KSS / Kohl's Corporation | 0.49 | 34.24 | 4.12 | 39.14 | 1.3362 | 0.0373 | |||
| M / Macy's, Inc. | 0.35 | 56.69 | 4.09 | 45.45 | 1.3266 | 0.0929 | |||
| EBAY / eBay Inc. | 0.05 | 14.53 | 4.08 | 25.90 | 1.3227 | -0.0983 | |||
| UPBD / Upbound Group, Inc. | 0.16 | 26.77 | 4.07 | 32.80 | 1.3209 | -0.0245 | |||
| AEO / American Eagle Outfitters, Inc. | 0.42 | 55.04 | 4.06 | 28.37 | 1.3164 | -0.0710 | |||
| RVLV / Revolve Group, Inc. | 0.20 | 55.20 | 4.04 | 44.80 | 1.3103 | 0.0863 | |||
| BOOT / Boot Barn Holdings, Inc. | 0.03 | -13.63 | 4.00 | 22.20 | 1.2959 | -0.1386 | |||
| ROST / Ross Stores, Inc. | 0.03 | 26.95 | 3.99 | 26.75 | 1.2939 | -0.0871 | |||
| GO / Grocery Outlet Holding Corp. | 0.32 | 26.19 | 3.98 | 12.13 | 1.2919 | -0.2670 | |||
| BBY / Best Buy Co., Inc. | 0.06 | 36.85 | 3.94 | 24.83 | 1.2784 | -0.1073 | |||
| AAP / Advance Auto Parts, Inc. | 0.08 | -0.17 | 3.85 | 18.36 | 1.2484 | -0.1783 | |||
| CWH / Camping World Holdings, Inc. | 0.22 | 17.26 | 3.82 | 24.73 | 1.2400 | -0.1048 | |||
| WINA / Winmark Corporation | 0.01 | 28.85 | 3.80 | 53.10 | 1.2315 | 0.1432 | |||
| VSCO / Victoria's Secret & Co. | 0.20 | 11.98 | 3.76 | 11.63 | 1.2201 | -0.2586 | |||
| IMKTA / Ingles Markets, Incorporated | 0.06 | 41.98 | 3.66 | 38.17 | 1.1869 | 0.0248 | |||
| GME / GameStop Corp. | 0.15 | 5.43 | 3.64 | 15.21 | 1.1819 | -0.2058 | |||
| ETSY / Etsy, Inc. | 0.07 | 2.16 | 3.55 | 8.59 | 1.1528 | -0.2830 | |||
| ODP / The ODP Corporation | 0.19 | 30.17 | 3.45 | 64.71 | 1.1187 | 0.1998 | |||
| REAL / The RealReal, Inc. | 0.70 | 32.21 | 3.37 | 17.52 | 1.0922 | -0.1653 | |||
| MNRO / Monro, Inc. | 0.21 | 24.04 | 3.06 | 27.78 | 0.9935 | -0.0580 | |||
| NGVC / Natural Grocers by Vitamin Cottage, Inc. | 0.08 | 3.03 | 0.9823 | 0.9823 | |||||
| EVGO / EVgo, Inc. | 0.81 | 6.31 | 2.97 | -4.16 | 0.9631 | 0.0881 | |||
| CAL / Caleres, Inc. | 0.24 | 34.38 | 2.91 | -4.69 | 0.9431 | -0.3955 | |||
| HZO / MarineMax, Inc. | 0.11 | 21.02 | 2.79 | 41.51 | 0.9031 | 0.0398 | |||
| SFIX / Stitch Fix, Inc. | 0.67 | 8.04 | 2.49 | 22.96 | 0.8061 | -0.0805 | |||
| SCVL / Shoe Carnival, Inc. | 0.12 | 30.52 | 2.23 | 11.07 | 0.7227 | -0.1576 | |||
| CRMT / America's Car-Mart, Inc. | 0.02 | -11.83 | 1.37 | 8.92 | 0.4433 | -0.1075 |