Statistik Asas
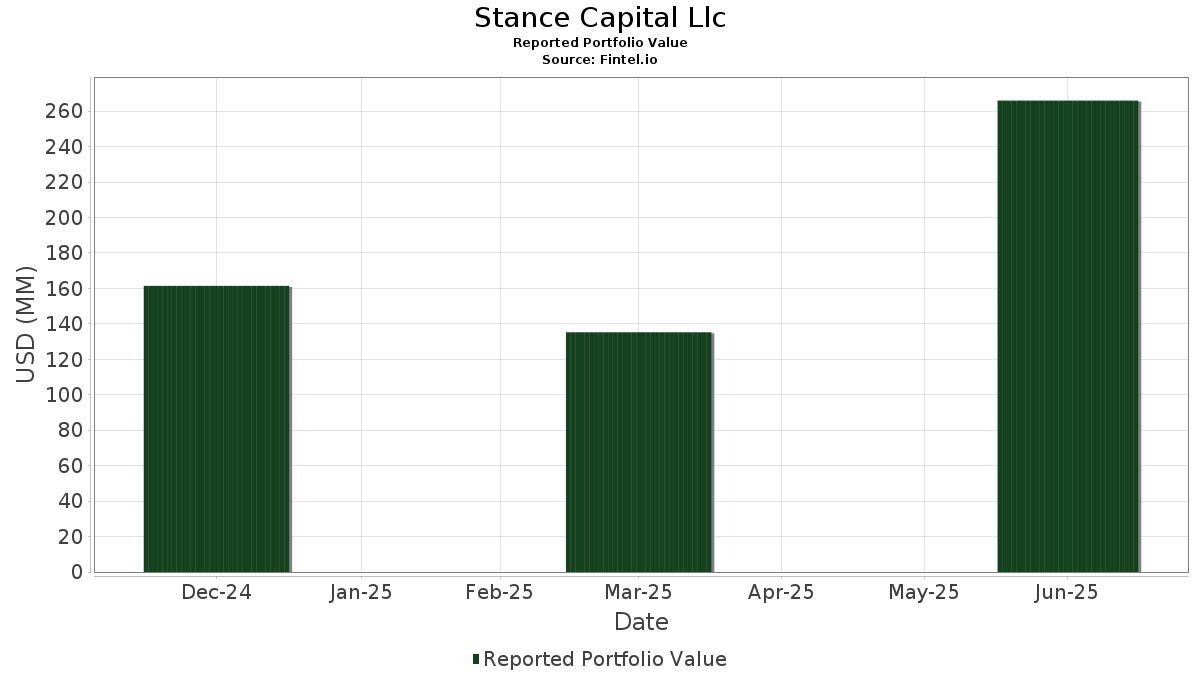
| Nilai Portfolio | $ 265,981,010 |
| Kedudukan Semasa | 158 |
Pegangan Terkini, Prestasi, AUM (dari 13F, 13D)
Stance Capital Llc telah mendedahkan 158 jumlah pegangan dalam pemfailan SEC terkini mereka. Nilai portfolio terkini dikira sebagai $ 265,981,010 USD. Aset Sebenar Di Bawah Pengurusan (AUM) ialah nilai ini ditambah dengan tunai (yang tidak didedahkan). Pegangan teratas Stance Capital Llc ialah Hennessy Funds Trust - Hennessy Sustainable ETF (US:STNC) , EA Series Trust - Stance Sustainable Beta ETF (US:STSB) , Cisco Systems, Inc. (US:CSCO) , Netflix, Inc. (US:NFLX) , and Stryker Corporation (US:SYK) . Kedudukan baharu Stance Capital Llc termasuk Ulta Beauty, Inc. (US:ULTA) , Walgreens Boots Alliance, Inc. (US:WBA) , Rockwell Automation, Inc. (US:ROK) , Motorola Solutions, Inc. (US:MSI) , and Raymond James Financial, Inc. (US:RJF) .
Kenaikan Teratas Suku Tahun Ini
Kami menggunakan perubahan dalam peruntukan portfolio kerana ini adalah metrik yang paling bermakna. Perubahan boleh disebabkan oleh perdagangan atau perubahan dalam harga saham.
| Sekuriti | Saham (MM) |
Nilai (MM$) |
Portfolio % | ΔPortfolio % |
|---|---|---|---|---|
| 0.06 | 4.45 | 1.5954 | 1.5954 | |
| 0.00 | 4.16 | 1.4933 | 1.4933 | |
| 0.01 | 4.14 | 1.4848 | 1.4848 | |
| 0.01 | 3.81 | 1.4322 | 1.4322 | |
| 0.03 | 3.98 | 1.4274 | 1.4274 | |
| 0.33 | 3.80 | 1.3623 | 1.3623 | |
| 0.02 | 3.45 | 1.2986 | 1.2986 | |
| 0.02 | 3.17 | 1.1374 | 1.1374 | |
| 0.01 | 2.60 | 0.9791 | 0.9791 | |
| 0.01 | 2.60 | 0.9785 | 0.9785 |
Penurunan Teratas Suku Tahun Ini
Kami menggunakan perubahan dalam peruntukan portfolio kerana ini adalah metrik yang paling bermakna. Perubahan boleh disebabkan oleh perdagangan atau perubahan dalam harga saham.
| Sekuriti | Saham (MM) |
Nilai (MM$) |
Portfolio % | ΔPortfolio % |
|---|---|---|---|---|
| 0.47 | 14.61 | 5.2401 | -5.3664 | |
| 0.00 | 0.33 | 0.1187 | -3.0058 | |
| 0.00 | 0.56 | 0.2006 | -2.6137 | |
| 0.02 | 2.98 | 1.0694 | -2.5181 | |
| 0.01 | 1.40 | 0.5006 | -2.2199 | |
| 0.05 | 2.21 | 0.7908 | -2.2187 | |
| 0.00 | 1.63 | 0.5845 | -2.1316 | |
| 0.01 | 3.27 | 1.1722 | -2.0664 | |
| 0.03 | 2.62 | 0.9840 | -2.0214 | |
| 0.02 | 2.02 | 0.7256 | -1.9843 |
13F dan Pemfailan Dana
Borang ini telah difailkan pada 2025-08-22 untuk tempoh pelaporan 2025-06-30. Klik ikon pautan untuk melihat sejarah transaksi penuh.
Tingkatkan untuk membuka data premium dan eksport ke Excel ![]() .
.
| Sekuriti | Jenis | Purata Harga Saham | Saham (MM) |
ΔSaham (%) |
ΔSaham (%) |
Nilai ($MM) |
Portfolio (%) |
ΔPortfolio (%) |
|
|---|---|---|---|---|---|---|---|---|---|
| STNC / Hennessy Funds Trust - Hennessy Sustainable ETF | 0.47 | -1.60 | 14.61 | 1.86 | 5.2401 | -5.3664 | |||
| STSB / EA Series Trust - Stance Sustainable Beta ETF | 0.21 | -4.25 | 5.39 | 5.27 | 1.9339 | -1.8537 | |||
| CSCO / Cisco Systems, Inc. | 0.06 | 4.45 | 1.5954 | 1.5954 | |||||
| NFLX / Netflix, Inc. | 0.00 | 4.16 | 1.4933 | 1.4933 | |||||
| SYK / Stryker Corporation | 0.01 | 4.14 | 1.4848 | 1.4848 | |||||
| TJX / The TJX Companies, Inc. | 0.03 | 3.98 | 1.4274 | 1.4274 | |||||
| ULTA / Ulta Beauty, Inc. | 0.01 | 3.81 | 1.4322 | 1.4322 | |||||
| WBA / Walgreens Boots Alliance, Inc. | 0.33 | 3.80 | 1.3623 | 1.3623 | |||||
| AAPL / Apple Inc. | 0.02 | 3.45 | 1.2986 | 1.2986 | |||||
| MA / Mastercard Incorporated | 0.01 | -27.20 | 3.27 | -25.37 | 1.1722 | -2.0664 | |||
| ROST / Ross Stores, Inc. | 0.02 | 3.17 | 1.1374 | 1.1374 | |||||
| CAH / Cardinal Health, Inc. | 0.02 | -49.60 | 2.98 | -38.54 | 1.0694 | -2.5181 | |||
| SBUX / Starbucks Corporation | 0.03 | -31.09 | 2.62 | -35.62 | 0.9840 | -2.0214 | |||
| ROK / Rockwell Automation, Inc. | 0.01 | 2.60 | 0.9791 | 0.9791 | |||||
| MSI / Motorola Solutions, Inc. | 0.01 | 2.60 | 0.9785 | 0.9785 | |||||
| HUBB / Hubbell Incorporated | 0.01 | 2.54 | 0.9116 | 0.9116 | |||||
| RJF / Raymond James Financial, Inc. | 0.02 | 2.51 | 0.9431 | 0.9431 | |||||
| JPM / JPMorgan Chase & Co. | 0.01 | 2.51 | 0.8989 | 0.8989 | |||||
| HD / The Home Depot, Inc. | 0.01 | 2.49 | 0.9371 | 0.9371 | |||||
| WELL / Welltower Inc. | 0.02 | 36.50 | 2.46 | 36.94 | 0.8814 | -0.4456 | |||
| MCD / McDonald's Corporation | 0.01 | 2.44 | 0.9168 | 0.9168 | |||||
| NTAP / NetApp, Inc. | 0.02 | 2.44 | 0.8742 | 0.8742 | |||||
| WAB / Westinghouse Air Brake Technologies Corporation | 0.01 | 2.22 | 0.8345 | 0.8345 | |||||
| IP / International Paper Company | 0.05 | -38.28 | 2.21 | -45.82 | 0.7908 | -2.2187 | |||
| GRMN N / Garmin Ltd. | 0.01 | 2.17 | 0.8162 | 0.8162 | |||||
| ADSK / Autodesk, Inc. | 0.01 | 2.15 | 0.7723 | 0.7723 | |||||
| CHTR / Charter Communications, Inc. | 0.01 | 2.12 | 0.7971 | 0.7971 | |||||
| IR / Ingersoll Rand Inc. | 0.03 | -23.75 | 2.10 | -20.73 | 0.7527 | -1.2055 | |||
| VZ / Verizon Communications Inc. | 0.05 | 2.06 | 0.7400 | 0.7400 | |||||
| MMM / 3M Company | 0.01 | 2.06 | 0.7383 | 0.7383 | |||||
| VTRS / Viatris Inc. | 0.23 | -25.69 | 2.04 | -23.81 | 0.7298 | -1.2454 | |||
| DHI / D.R. Horton, Inc. | 0.02 | -45.56 | 2.02 | -44.80 | 0.7256 | -1.9843 | |||
| MTD / Mettler-Toledo International Inc. | 0.00 | 2.01 | 0.7566 | 0.7566 | |||||
| ORLY / O'Reilly Automotive, Inc. | 0.02 | 2.01 | 0.7565 | 0.7565 | |||||
| LEN / Lennar Corporation | 0.02 | 2.01 | 0.7202 | 0.7202 | |||||
| T / AT&T Inc. | 0.07 | 2.00 | 0.7186 | 0.7186 | |||||
| ORCL / Oracle Corporation | 0.01 | -49.93 | 2.00 | -21.71 | 0.7165 | -1.1704 | |||
| CVS / CVS Health Corporation | 0.03 | 1.99 | 0.7498 | 0.7498 | |||||
| GL / Globe Life Inc. | 0.02 | 1.98 | 0.7459 | 0.7459 | |||||
| PLTR / Palantir Technologies Inc. | 0.01 | 1.89 | 0.7125 | 0.7125 | |||||
| K / Kellanova | 0.02 | 1.86 | 0.6980 | 0.6980 | |||||
| EXEC / Exelon Corporation | 0.04 | 1.84 | 0.6928 | 0.6928 | |||||
| DE / Deere & Company | 0.00 | 1.76 | 0.6296 | 0.6296 | |||||
| MAA / Mid-America Apartment Communities, Inc. | 0.01 | 46.52 | 1.72 | 29.41 | 0.6156 | -0.3652 | |||
| EIX / Edison International | 0.03 | 1.68 | 0.6025 | 0.6025 | |||||
| GOOGL / Alphabet Inc. | 0.01 | 1.67 | 0.6002 | 0.6002 | |||||
| GIS / General Mills, Inc. | 0.03 | 1.65 | 0.5927 | 0.5927 | |||||
| GPC / Genuine Parts Company | 0.01 | 1.64 | 0.5888 | 0.5888 | |||||
| RDDT / Reddit, Inc. | 0.01 | 1.64 | 0.6173 | 0.6173 | |||||
| V / Visa Inc. | 0.00 | -56.21 | 1.63 | -55.63 | 0.5845 | -2.1316 | |||
| AMD / Advanced Micro Devices, Inc. | 0.01 | 1.59 | 0.5971 | 0.5971 | |||||
| 0I0J / The Clorox Company | 0.01 | 1.56 | 0.5864 | 0.5864 | |||||
| EL / The Estée Lauder Companies Inc. | 0.02 | 1.55 | 0.5814 | 0.5814 | |||||
| BMY / Bristol-Myers Squibb Company | 0.03 | -21.65 | 1.54 | -40.53 | 0.5509 | -1.3592 | |||
| NKE / NIKE, Inc. | 0.02 | 1.51 | 0.5417 | 0.5417 | |||||
| AZO / AutoZone, Inc. | 0.00 | 1.49 | 0.5351 | 0.5351 | |||||
| VRT / Vertiv Holdings Co | 0.01 | 1.49 | 0.5341 | 0.5341 | |||||
| MRVL / Marvell Technology, Inc. | 0.02 | 1.48 | 0.5577 | 0.5577 | |||||
| SHW / The Sherwin-Williams Company | 0.00 | 1.48 | 0.5311 | 0.5311 | |||||
| NET / Cloudflare, Inc. | 0.01 | 1.48 | 0.5568 | 0.5568 | |||||
| NVDA / NVIDIA Corporation | 0.01 | -69.61 | 1.45 | -55.71 | 0.5190 | -1.8964 | |||
| DELL / Dell Technologies Inc. | 0.01 | 260.49 | 1.44 | 384.85 | 0.5166 | 0.2970 | |||
| AVGO / Broadcom Inc. | 0.01 | 1.44 | 0.5164 | 0.5164 | |||||
| INTC / Intel Corporation | 0.06 | 1.43 | 0.5380 | 0.5380 | |||||
| AXP / American Express Company | 0.00 | 1.43 | 0.5123 | 0.5123 | |||||
| ANET / Arista Networks Inc | 0.01 | 1.43 | 0.5114 | 0.5114 | |||||
| URI / United Rentals, Inc. | 0.00 | 1.42 | 0.5322 | 0.5322 | |||||
| SPOT / Spotify Technology S.A. | 0.00 | 1.41 | 0.5297 | 0.5297 | |||||
| NWS / News Corporation | 0.04 | 1.41 | 0.5293 | 0.5293 | |||||
| HLT / Hilton Worldwide Holdings Inc. | 0.01 | -45.42 | 1.41 | -36.11 | 0.5038 | -1.1222 | |||
| FWONA / Formula One Group | 0.01 | 1.41 | 0.5283 | 0.5283 | |||||
| AMAT / Applied Materials, Inc. | 0.01 | -69.93 | 1.40 | -62.05 | 0.5006 | -2.2199 | |||
| SNPS / Synopsys, Inc. | 0.00 | 1.39 | 0.4994 | 0.4994 | |||||
| TXN / Texas Instruments Incorporated | 0.01 | 1.39 | 0.4973 | 0.4973 | |||||
| MU / Micron Technology, Inc. | 0.01 | 1.39 | 0.4971 | 0.4971 | |||||
| EA / Electronic Arts Inc. | 0.01 | 1.39 | 0.4966 | 0.4966 | |||||
| MAR / Marriott International, Inc. | 0.01 | 1.38 | 0.5191 | 0.5191 | |||||
| CRWD / CrowdStrike Holdings, Inc. | 0.00 | 1.38 | 0.4942 | 0.4942 | |||||
| ISRG / Intuitive Surgical, Inc. | 0.00 | 1.37 | 0.5157 | 0.5157 | |||||
| SPGI / S&P Global Inc. | 0.00 | 1.37 | 0.4910 | 0.4910 | |||||
| MCO / Moody's Corporation | 0.00 | 1.37 | 0.4910 | 0.4910 | |||||
| DIS / The Walt Disney Company | 0.01 | 1.37 | 0.4899 | 0.4899 | |||||
| NVR / NVR, Inc. | 0.00 | 1.37 | 0.4899 | 0.4899 | |||||
| INTU / Intuit Inc. | 0.00 | 1.36 | 0.4880 | 0.4880 | |||||
| ADI / Analog Devices, Inc. | 0.01 | 1.36 | 0.4879 | 0.4879 | |||||
| CRM / Salesforce, Inc. | 0.00 | 1.36 | 0.4876 | 0.4876 | |||||
| NOW / ServiceNow, Inc. | 0.00 | 1.36 | 0.4873 | 0.4873 | |||||
| PYPL / PayPal Holdings, Inc. | 0.02 | 1.36 | 0.5107 | 0.5107 | |||||
| SCHW / The Charles Schwab Corporation | 0.01 | 1.36 | 0.4869 | 0.4869 | |||||
| PANW / Palo Alto Networks, Inc. | 0.01 | 1.36 | 0.4865 | 0.4865 | |||||
| KLAC / KLA Corporation | 0.00 | 1.35 | 0.4853 | 0.4853 | |||||
| FTNT / Fortinet, Inc. | 0.01 | 1.35 | 0.4839 | 0.4839 | |||||
| TEL / TE Connectivity plc | 0.01 | 1.35 | 0.4835 | 0.4835 | |||||
| PHM / PulteGroup, Inc. | 0.01 | 74.52 | 1.35 | 78.99 | 0.4828 | -0.0732 | |||
| CART / Maplebear Inc. | 0.03 | 1.34 | 0.4811 | 0.4811 | |||||
| AFL / Aflac Incorporated | 0.01 | 1.34 | 0.4811 | 0.4811 | |||||
| CDNS / Cadence Design Systems, Inc. | 0.00 | 1.34 | 0.4791 | 0.4791 | |||||
| ICE / Intercontinental Exchange, Inc. | 0.01 | 1.34 | 0.4790 | 0.4790 | |||||
| CARR / Carrier Global Corporation | 0.02 | 1.33 | 0.4786 | 0.4786 | |||||
| OMC / Omnicom Group Inc. | 0.02 | 1.33 | 0.4778 | 0.4778 | |||||
| CME / CME Group Inc. | 0.00 | 1.33 | 0.4768 | 0.4768 | |||||
| BK / The Bank of New York Mellon Corporation | 0.01 | 1.33 | 0.4768 | 0.4768 | |||||
| TEAM / Atlassian Corporation | 0.01 | 1.33 | 0.4765 | 0.4765 | |||||
| CMCSA / Comcast Corporation | 0.04 | 1.32 | 0.4750 | 0.4750 | |||||
| QCOM / QUALCOMM Incorporated | 0.01 | 1.32 | 0.4748 | 0.4748 | |||||
| ECL / Ecolab Inc. | 0.00 | 1.32 | 0.4745 | 0.4745 | |||||
| TRV / The Travelers Companies, Inc. | 0.00 | 1.32 | 0.4968 | 0.4968 | |||||
| USFD / US Foods Holding Corp. | 0.02 | 1.31 | 0.4939 | 0.4939 | |||||
| AON / Aon plc | 0.00 | 1.31 | 0.4710 | 0.4710 | |||||
| CPRT / Copart, Inc. | 0.03 | 1.31 | 0.4706 | 0.4706 | |||||
| GILDCL / Gilead Sciences, Inc. | 0.01 | 1.31 | 0.4929 | 0.4929 | |||||
| TMO / Thermo Fisher Scientific Inc. | 0.00 | 1.31 | 0.4694 | 0.4694 | |||||
| MMC / Marsh & McLennan Companies, Inc. | 0.01 | 1.31 | 0.4692 | 0.4692 | |||||
| NEM / Newmont Corporation | 0.02 | 1.31 | 0.4916 | 0.4916 | |||||
| ADP / Automatic Data Processing, Inc. | 0.00 | 1.31 | 0.4685 | 0.4685 | |||||
| VRSK / Verisk Analytics, Inc. | 0.00 | 1.30 | 0.4675 | 0.4675 | |||||
| ABT / Abbott Laboratories | 0.01 | 1.30 | 0.4675 | 0.4675 | |||||
| ROP / Roper Technologies, Inc. | 0.00 | 1.30 | 0.4675 | 0.4675 | |||||
| UNH / UnitedHealth Group Incorporated | 0.00 | 1.30 | 0.4649 | 0.4649 | |||||
| PGR / The Progressive Corporation | 0.00 | 1.30 | 0.4646 | 0.4646 | |||||
| CHD / Church & Dwight Co., Inc. | 0.01 | 1.29 | 0.4615 | 0.4615 | |||||
| DLR / Digital Realty Trust, Inc. | 0.01 | 1.29 | 0.4834 | 0.4834 | |||||
| RSG / Republic Services, Inc. | 0.01 | 1.28 | 0.4807 | 0.4807 | |||||
| WDAY / Workday, Inc. | 0.01 | 1.28 | 0.4575 | 0.4575 | |||||
| GWW / W.W. Grainger, Inc. | 0.00 | 1.28 | 0.4573 | 0.4573 | |||||
| ADBE / Adobe Inc. | 0.00 | 1.27 | 0.4562 | 0.4562 | |||||
| ABBV / AbbVie Inc. | 0.01 | 1.26 | 0.4526 | 0.4526 | |||||
| PLD / Prologis, Inc. | 0.01 | 1.26 | 0.4522 | 0.4522 | |||||
| MRK / Merck & Co., Inc. | 0.02 | 1.26 | 0.4516 | 0.4516 | |||||
| WM / Waste Management, Inc. | 0.01 | 1.26 | 0.4514 | 0.4514 | |||||
| KVUE / Kenvue Inc. | 0.06 | 1.26 | 0.4719 | 0.4719 | |||||
| AMGN / Amgen Inc. | 0.00 | 1.25 | 0.4468 | 0.4468 | |||||
| ACN / Accenture plc | 0.00 | 1.25 | 0.4468 | 0.4468 | |||||
| LLY / Eli Lilly and Company | 0.00 | 4.76 | 1.24 | -1.12 | 0.4433 | -0.4812 | |||
| EQIX / Equinix, Inc. | 0.00 | 1.17 | 0.4390 | 0.4390 | |||||
| 1EMN / Eastman Chemical Company | 0.01 | 0.96 | 0.3592 | 0.3592 | |||||
| POOL / Pool Corporation | 0.00 | 0.95 | 0.3562 | 0.3562 | |||||
| IDXX / IDEXX Laboratories, Inc. | 0.00 | 0.93 | 0.3337 | 0.3337 | |||||
| BAC / Bank of America Corporation | 0.02 | 0.83 | 0.2959 | 0.2959 | |||||
| EW / Edwards Lifesciences Corporation | 0.01 | 0.76 | 0.2726 | 0.2726 | |||||
| WRB / W. R. Berkley Corporation | 0.01 | 0.74 | 0.2792 | 0.2792 | |||||
| DAL / Delta Air Lines, Inc. | 0.02 | 0.74 | 0.2780 | 0.2780 | |||||
| SJM / The J. M. Smucker Company | 0.01 | 0.74 | 0.2649 | 0.2649 | |||||
| F / Ford Motor Company | 0.07 | 0.72 | 0.2714 | 0.2714 | |||||
| CB / Chubb Limited | 0.00 | 0.72 | 0.2707 | 0.2707 | |||||
| PCG / PG&E Corporation | 0.05 | 0.72 | 0.2700 | 0.2700 | |||||
| RCL / Royal Caribbean Cruises Ltd. | 0.00 | 0.71 | 0.2658 | 0.2658 | |||||
| BKNG / Booking Holdings Inc. | 0.00 | 0.68 | 0.2449 | 0.2449 | |||||
| UAL / United Airlines Holdings, Inc. | 0.01 | 0.65 | 0.2448 | 0.2448 | |||||
| LOW / Lowe's Companies, Inc. | 0.00 | -84.55 | 0.56 | -85.31 | 0.2006 | -2.6137 | |||
| ATO / Atmos Energy Corporation | 0.00 | 0.40 | 0.1487 | 0.1487 | |||||
| FITB / Fifth Third Bancorp | 0.01 | 0.38 | 0.1431 | 0.1431 | |||||
| BSX / Boston Scientific Corporation | 0.00 | -92.64 | 0.33 | -92.17 | 0.1187 | -3.0058 | |||
| NDAQ / Nasdaq, Inc. | 0.00 | 0.32 | 0.1150 | 0.1150 | |||||
| TMUS / T-Mobile US, Inc. | 0.00 | 0.31 | 0.1099 | 0.1099 | |||||
| FAST / Fastenal Company | 0.01 | 0.31 | 0.1153 | 0.1153 | |||||
| LUV / Southwest Airlines Co. | 0.01 | 0.29 | 0.1104 | 0.1104 | |||||
| HASI / HA Sustainable Infrastructure Capital, Inc. | 0.01 | -62.26 | 0.20 | -65.35 | 0.0725 | -0.3587 | |||
| MCK / McKesson Corporation | 0.00 | -100.00 | 0.00 | 0.0000 | |||||
| HCA / HCA Healthcare, Inc. | 0.00 | -100.00 | 0.00 | 0.0000 | |||||
| ED / Consolidated Edison, Inc. | 0.00 | -100.00 | 0.00 | 0.0000 | |||||
| IBM / International Business Machines Corporation | 0.00 | -100.00 | 0.00 | 0.0000 | |||||
| JCI / Johnson Controls International plc | 0.00 | -100.00 | 0.00 | 0.0000 | |||||
| TGT / Target Corporation | 0.00 | -100.00 | 0.00 | 0.0000 | |||||
| CTSH / Cognizant Technology Solutions Corporation | 0.00 | -100.00 | 0.00 | 0.0000 | |||||
| EXPE / Expedia Group, Inc. | 0.00 | -100.00 | 0.00 | 0.0000 | |||||
| PPG / PPG Industries, Inc. | 0.00 | -100.00 | 0.00 | 0.0000 | |||||
| LVS / Las Vegas Sands Corp. | 0.00 | -100.00 | 0.00 | 0.0000 | |||||
| C / Citigroup Inc. | 0.00 | -100.00 | 0.00 | 0.0000 | |||||
| XEL / Xcel Energy Inc. | 0.00 | -100.00 | 0.00 | 0.0000 | |||||
| GS / The Goldman Sachs Group, Inc. | 0.00 | -100.00 | 0.00 | 0.0000 | |||||
| MS / Morgan Stanley | 0.00 | -100.00 | 0.00 | 0.0000 | |||||
| RF / Regions Financial Corporation | 0.00 | -100.00 | 0.00 | 0.0000 | |||||
| GEV / GE Vernova Inc. | 0.00 | -100.00 | 0.00 | 0.0000 | |||||
| BBY / Best Buy Co., Inc. | 0.00 | -100.00 | 0.00 | 0.0000 | |||||
| STT / State Street Corporation | 0.00 | -100.00 | 0.00 | 0.0000 | |||||
| KIM / Kimco Realty Corporation | 0.00 | -100.00 | 0.00 | 0.0000 | |||||
| SW / Smurfit Westrock Plc | 0.00 | -100.00 | 0.00 | 0.0000 | |||||
| HSY / The Hershey Company | 0.00 | -100.00 | 0.00 | 0.0000 |