Statistik Asas
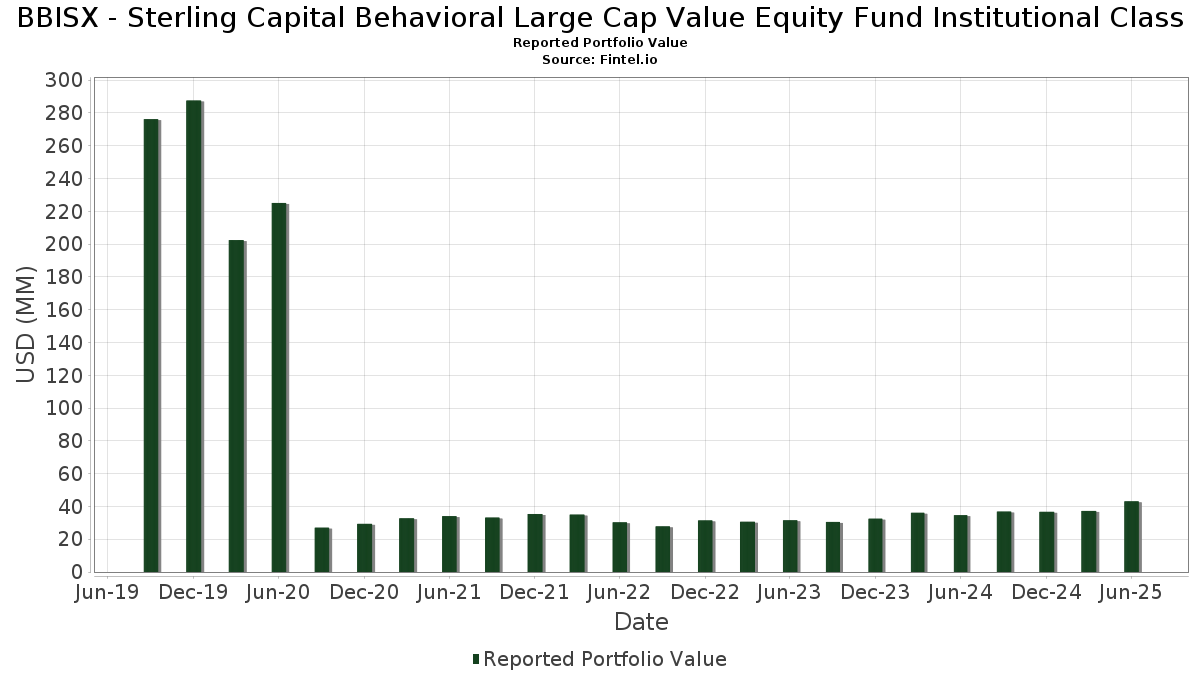
| Nilai Portfolio | $ 43,083,842 |
| Kedudukan Semasa | 106 |
Pegangan Terkini, Prestasi, AUM (dari 13F, 13D)
BBISX - Sterling Capital Behavioral Large Cap Value Equity Fund Institutional Class telah mendedahkan 106 jumlah pegangan dalam pemfailan SEC terkini mereka. Nilai portfolio terkini dikira sebagai $ 43,083,842 USD. Aset Sebenar Di Bawah Pengurusan (AUM) ialah nilai ini ditambah dengan tunai (yang tidak didedahkan). Pegangan teratas BBISX - Sterling Capital Behavioral Large Cap Value Equity Fund Institutional Class ialah JPMorgan Chase & Co. (US:JPM) , International Business Machines Corporation (US:IBM) , Cisco Systems, Inc. (US:CSCO) , Philip Morris International Inc. (US:PM) , and Salesforce, Inc. (US:CRM) . Kedudukan baharu BBISX - Sterling Capital Behavioral Large Cap Value Equity Fund Institutional Class termasuk Salesforce, Inc. (US:CRM) , The Walt Disney Company (US:DIS) , GE Vernova Inc. (US:GEV) , Trane Technologies plc (US:TT) , and Uber Technologies, Inc. (US:UBER) .
Kenaikan Teratas Suku Tahun Ini
Kami menggunakan perubahan dalam peruntukan portfolio kerana ini adalah metrik yang paling bermakna. Perubahan boleh disebabkan oleh perdagangan atau perubahan dalam harga saham.
| Sekuriti | Saham (MM) |
Nilai (MM$) |
Portfolio % | ΔPortfolio % |
|---|---|---|---|---|
| 0.00 | 0.89 | 2.0744 | 2.0744 | |
| 0.01 | 0.89 | 2.0651 | 2.0651 | |
| 0.00 | 0.70 | 1.6173 | 1.6173 | |
| 0.00 | 0.62 | 1.4359 | 1.4359 | |
| 0.01 | 0.58 | 1.3518 | 1.3518 | |
| 0.00 | 0.58 | 1.3492 | 1.3492 | |
| 0.01 | 0.53 | 1.2269 | 1.2269 | |
| 0.00 | 0.62 | 1.4458 | 1.0585 | |
| 0.01 | 0.74 | 1.7054 | 0.9995 | |
| 0.00 | 0.25 | 0.5811 | 0.5811 |
Penurunan Teratas Suku Tahun Ini
Kami menggunakan perubahan dalam peruntukan portfolio kerana ini adalah metrik yang paling bermakna. Perubahan boleh disebabkan oleh perdagangan atau perubahan dalam harga saham.
| Sekuriti | Saham (MM) |
Nilai (MM$) |
Portfolio % | ΔPortfolio % |
|---|---|---|---|---|
| 0.00 | 0.10 | 0.2376 | -1.6708 | |
| 0.00 | 0.20 | 0.4698 | -1.0307 | |
| 0.00 | 0.31 | 0.7091 | -1.0205 | |
| 0.00 | 0.54 | 1.2618 | -0.9082 | |
| 0.00 | 0.36 | 0.8389 | -0.6438 | |
| 0.00 | 0.46 | 1.0724 | -0.5409 | |
| 0.00 | 0.06 | 0.1389 | -0.5155 | |
| 0.00 | 0.00 | -0.4369 | ||
| 0.01 | 0.64 | 1.4783 | -0.3660 | |
| 0.00 | 0.00 | -0.3511 |
13F dan Pemfailan Dana
Borang ini telah difailkan pada 2025-08-27 untuk tempoh pelaporan 2025-06-30. Klik ikon pautan untuk melihat sejarah transaksi penuh.
Tingkatkan untuk membuka data premium dan eksport ke Excel ![]() .
.
| Sekuriti | Jenis | Purata Harga Saham | Saham (MM) |
ΔSaham (%) |
ΔSaham (%) |
Nilai ($MM) |
Portfolio (%) |
ΔPortfolio (%) |
|
|---|---|---|---|---|---|---|---|---|---|
| JPM / JPMorgan Chase & Co. | 0.01 | 4.42 | 1.86 | 23.47 | 4.3073 | 0.2693 | |||
| IBM / International Business Machines Corporation | 0.00 | 4.42 | 1.04 | 23.87 | 2.4202 | 0.1584 | |||
| CSCO / Cisco Systems, Inc. | 0.01 | 7.17 | 1.03 | 20.54 | 2.3971 | 0.0955 | |||
| PM / Philip Morris International Inc. | 0.01 | -3.07 | 0.99 | 11.26 | 2.2928 | -0.0922 | |||
| CRM / Salesforce, Inc. | 0.00 | 0.89 | 2.0744 | 2.0744 | |||||
| T / AT&T Inc. | 0.03 | 4.43 | 0.89 | 6.84 | 2.0661 | -0.1705 | |||
| DIS / The Walt Disney Company | 0.01 | 0.89 | 2.0651 | 2.0651 | |||||
| MS / Morgan Stanley | 0.01 | 10.50 | 0.87 | 33.49 | 2.0252 | 0.2690 | |||
| COF / Capital One Financial Corporation | 0.00 | 11.27 | 0.76 | 31.95 | 1.7735 | 0.2195 | |||
| QCOM / QUALCOMM Incorporated | 0.00 | 53.30 | 0.74 | 58.92 | 1.7157 | 0.4669 | |||
| CVS / CVS Health Corporation | 0.01 | 230.54 | 0.74 | 231.08 | 1.7054 | 0.9995 | |||
| WFC / Wells Fargo & Company | 0.01 | 0.00 | 0.72 | 11.61 | 1.6724 | -0.0613 | |||
| GILD / Gilead Sciences, Inc. | 0.01 | 2.40 | 0.72 | 1.27 | 1.6693 | -0.2368 | |||
| CME / CME Group Inc. | 0.00 | 0.70 | 1.6173 | 1.6173 | |||||
| EMR / Emerson Electric Co. | 0.01 | 4.44 | 0.69 | 27.07 | 1.6018 | 0.1426 | |||
| JCI / Johnson Controls International plc | 0.01 | -4.09 | 0.69 | 26.52 | 1.5952 | 0.1357 | |||
| WMB / The Williams Companies, Inc. | 0.01 | 4.44 | 0.69 | 9.76 | 1.5929 | -0.0859 | |||
| BK / The Bank of New York Mellon Corporation | 0.01 | 4.44 | 0.69 | 13.60 | 1.5890 | -0.0312 | |||
| CI / The Cigna Group | 0.00 | 26.34 | 0.68 | 26.90 | 1.5886 | 0.1409 | |||
| RCL / Royal Caribbean Cruises Ltd. | 0.00 | -5.20 | 0.68 | 44.47 | 1.5767 | 0.3144 | |||
| MO / Altria Group, Inc. | 0.01 | 4.44 | 0.67 | 1.97 | 1.5608 | -0.2091 | |||
| NEM / Newmont Corporation | 0.01 | -13.44 | 0.66 | 35.51 | 1.5404 | 0.2052 | |||
| KMI / Kinder Morgan, Inc. | 0.02 | 4.44 | 0.65 | 7.62 | 1.5090 | -0.1132 | |||
| BMY / Bristol-Myers Squibb Company | 0.01 | 22.18 | 0.64 | -7.28 | 1.4783 | -0.3660 | |||
| KR / The Kroger Co. | 0.01 | 4.44 | 0.63 | 10.66 | 1.4700 | -0.0666 | |||
| TRV / The Travelers Companies, Inc. | 0.00 | 253.03 | 0.62 | 364.93 | 1.4458 | 1.0585 | |||
| CHTR / Charter Communications, Inc. | 0.00 | 4.38 | 0.62 | 15.80 | 1.4450 | 0.0013 | |||
| LNG / Cheniere Energy, Inc. | 0.00 | 4.43 | 0.62 | 9.93 | 1.4391 | -0.0759 | |||
| DUK / Duke Energy Corporation | 0.01 | -0.85 | 0.62 | -4.03 | 1.4368 | -0.2961 | |||
| GEV / GE Vernova Inc. | 0.00 | 0.62 | 1.4359 | 1.4359 | |||||
| AMGN / Amgen Inc. | 0.00 | 34.16 | 0.60 | 16.41 | 1.3987 | -0.0093 | |||
| GM / General Motors Company | 0.01 | 4.44 | 0.60 | 9.27 | 1.3958 | -0.0819 | |||
| ALL / The Allstate Corporation | 0.00 | 57.10 | 0.59 | 52.73 | 1.3643 | 0.3308 | |||
| OKE / ONEOK, Inc. | 0.01 | 0.58 | 1.3518 | 1.3518 | |||||
| TT / Trane Technologies plc | 0.00 | 0.58 | 1.3492 | 1.3492 | |||||
| SPG / Simon Property Group, Inc. | 0.00 | 13.89 | 0.58 | 10.25 | 1.3482 | -0.0666 | |||
| MCK / McKesson Corporation | 0.00 | -11.43 | 0.57 | -3.54 | 1.3307 | -0.2656 | |||
| DELL / Dell Technologies Inc. | 0.00 | 1.31 | 0.57 | 4.81 | 1.3165 | -0.1539 | |||
| O / Realty Income Corporation | 0.01 | 4.44 | 0.56 | 3.72 | 1.2922 | -0.1492 | |||
| COR / Cencora, Inc. | 0.00 | -7.28 | 0.55 | 0.00 | 1.2671 | -0.1991 | |||
| ABBV / AbbVie Inc. | 0.00 | -24.07 | 0.54 | -32.67 | 1.2618 | -0.9082 | |||
| UBER / Uber Technologies, Inc. | 0.01 | 0.53 | 1.2269 | 1.2269 | |||||
| PNC / The PNC Financial Services Group, Inc. | 0.00 | -17.03 | 0.47 | -12.03 | 1.0869 | -0.3421 | |||
| HCA / HCA Healthcare, Inc. | 0.00 | -30.63 | 0.46 | -23.13 | 1.0724 | -0.5409 | |||
| EXC / Exelon Corporation | 0.01 | 17.16 | 0.45 | 10.27 | 1.0477 | -0.0502 | |||
| SO / The Southern Company | 0.00 | 24.06 | 0.39 | 62.40 | 0.9115 | 0.1441 | |||
| AFL / Aflac Incorporated | 0.00 | -30.99 | 0.36 | -34.60 | 0.8389 | -0.6438 | |||
| USB / U.S. Bancorp | 0.01 | 4.44 | 0.35 | 11.94 | 0.8067 | -0.0270 | |||
| VZ / Verizon Communications Inc. | 0.01 | -8.20 | 0.32 | -12.57 | 0.7434 | -0.2388 | |||
| GS / The Goldman Sachs Group, Inc. | 0.00 | -63.39 | 0.31 | -52.64 | 0.7091 | -1.0205 | |||
| KMB / Kimberly-Clark Corporation | 0.00 | 17.93 | 0.27 | 7.11 | 0.6294 | -0.0518 | |||
| MTZ / MasTec, Inc. | 0.00 | 0.25 | 0.5811 | 0.5811 | |||||
| NTRS / Northern Trust Corporation | 0.00 | 0.25 | 0.5734 | 0.5734 | |||||
| FTI / TechnipFMC plc | 0.01 | 4.45 | 0.24 | 13.74 | 0.5573 | -0.0107 | |||
| TPR / Tapestry, Inc. | 0.00 | 26.87 | 0.24 | 58.67 | 0.5529 | 0.1486 | |||
| VIRT / Virtu Financial, Inc. | 0.01 | 4.44 | 0.24 | 22.92 | 0.5479 | 0.0313 | |||
| MTG / MGIC Investment Corporation | 0.01 | 4.43 | 0.23 | 17.59 | 0.5428 | 0.0076 | |||
| SYF / Synchrony Financial | 0.00 | 4.44 | 0.22 | 31.36 | 0.5165 | 0.0627 | |||
| RL / Ralph Lauren Corporation | 0.00 | 4.40 | 0.21 | 29.70 | 0.4981 | 0.0539 | |||
| FOX / Fox Corporation | 0.00 | 4.44 | 0.21 | 2.40 | 0.4953 | -0.0648 | |||
| GTES / Gates Industrial Corporation plc | 0.01 | 4.46 | 0.21 | 31.25 | 0.4871 | 0.0558 | |||
| EME / EMCOR Group, Inc. | 0.00 | 44.81 | 0.21 | 111.11 | 0.4851 | 0.2173 | |||
| CCK / Crown Holdings, Inc. | 0.00 | 4.44 | 0.20 | 20.83 | 0.4715 | 0.0188 | |||
| TNL / Travel + Leisure Co. | 0.00 | 4.44 | 0.20 | 16.09 | 0.4701 | 0.0030 | |||
| PH / Parker-Hannifin Corporation | 0.00 | -68.48 | 0.20 | -63.86 | 0.4698 | -1.0307 | |||
| USFD / US Foods Holding Corp. | 0.00 | 4.46 | 0.20 | 23.46 | 0.4646 | 0.0272 | |||
| BEN / Franklin Resources, Inc. | 0.01 | 0.20 | 0.4641 | 0.4641 | |||||
| CF / CF Industries Holdings, Inc. | 0.00 | 100.93 | 0.20 | 121.35 | 0.4588 | 0.2124 | |||
| STT / State Street Corporation | 0.00 | 4.44 | 0.20 | 23.90 | 0.4585 | 0.0309 | |||
| FOXA / Fox Corporation | 0.00 | 19.76 | 0.20 | 18.67 | 0.4576 | 0.0111 | |||
| DDS / Dillard's, Inc. | 0.00 | 67.86 | 0.20 | 63.33 | 0.4555 | 0.1262 | |||
| ADT / ADT Inc. | 0.02 | 4.44 | 0.20 | 8.33 | 0.4540 | -0.0293 | |||
| GEN / Gen Digital Inc. | 0.01 | 4.45 | 0.19 | 15.48 | 0.4515 | 0.0000 | |||
| PAG / Penske Automotive Group, Inc. | 0.00 | 13.00 | 0.19 | 21.25 | 0.4503 | -0.0429 | |||
| ULTA / Ulta Beauty, Inc. | 0.00 | 0.19 | 0.4449 | 0.4449 | |||||
| EPR / EPR Properties | 0.00 | 4.44 | 0.19 | 15.76 | 0.4445 | -0.0001 | |||
| Federated Hermes Treasury Oligations Fund / STIV (US31423R5000) | 0.19 | 352.38 | 0.4408 | 0.3271 | |||||
| GAP / The Gap, Inc. | 0.01 | 4.45 | 0.19 | 10.65 | 0.4343 | -0.0203 | |||
| UAL / United Airlines Holdings, Inc. | 0.00 | 4.44 | 0.19 | 20.65 | 0.4340 | 0.0171 | |||
| CUZ / Cousins Properties Incorporated | 0.01 | 4.44 | 0.18 | 6.40 | 0.4255 | -0.0375 | |||
| SLGN / Silgan Holdings Inc. | 0.00 | 4.46 | 0.18 | 10.30 | 0.4240 | -0.0191 | |||
| CRUS / Cirrus Logic, Inc. | 0.00 | 4.46 | 0.18 | 9.09 | 0.4193 | -0.0246 | |||
| EXPE / Expedia Group, Inc. | 0.00 | 4.51 | 0.18 | 4.68 | 0.4170 | -0.0430 | |||
| EBAY / eBay Inc. | 0.00 | 4.46 | 0.18 | 14.74 | 0.4167 | -0.0031 | |||
| ALSN / Allison Transmission Holdings, Inc. | 0.00 | 4.47 | 0.18 | 3.51 | 0.4120 | -0.0475 | |||
| VICI / VICI Properties Inc. | 0.01 | 4.44 | 0.18 | 4.76 | 0.4087 | -0.0443 | |||
| THG / The Hanover Insurance Group, Inc. | 0.00 | 4.39 | 0.17 | 1.76 | 0.4030 | -0.0544 | |||
| CART / Maplebear Inc. | 0.00 | 4.44 | 0.17 | 18.62 | 0.4000 | 0.0093 | |||
| ETSY / Etsy, Inc. | 0.00 | 0.17 | 0.3886 | 0.3886 | |||||
| RITM / Rithm Capital Corp. | 0.01 | 4.44 | 0.16 | 2.61 | 0.3658 | -0.0451 | |||
| OHI / Omega Healthcare Investors, Inc. | 0.00 | 4.44 | 0.15 | 0.66 | 0.3542 | -0.0535 | |||
| PPC / Pilgrim's Pride Corporation | 0.00 | 4.45 | 0.15 | -13.87 | 0.3476 | -0.1190 | |||
| CL / Colgate-Palmolive Company | 0.00 | 76.74 | 0.14 | 55.06 | 0.3204 | 0.0781 | |||
| AXS / AXIS Capital Holdings Limited | 0.00 | 4.44 | 0.14 | 7.94 | 0.3169 | -0.0220 | |||
| MOS / The Mosaic Company | 0.00 | 0.13 | 0.3114 | 0.3114 | |||||
| LKQ / LKQ Corporation | 0.00 | 0.13 | 0.3107 | 0.3107 | |||||
| C / Citigroup Inc. | 0.00 | 4.44 | 0.12 | 26.32 | 0.2784 | 0.0212 | |||
| AVGO / Broadcom Inc. | 0.00 | 50.00 | 0.12 | 150.00 | 0.2685 | 0.1427 | |||
| RPRX / Royalty Pharma plc | 0.00 | -43.52 | 0.11 | -35.12 | 0.2549 | -0.1962 | |||
| INGR / Ingredion Incorporated | 0.00 | 4.55 | 0.11 | 4.81 | 0.2532 | -0.0261 | |||
| CMCSA / Comcast Corporation | 0.00 | -83.01 | 0.10 | -84.57 | 0.2376 | -1.6708 | |||
| CNXC / Concentrix Corporation | 0.00 | 281.05 | 0.10 | 106.52 | 0.2219 | 0.0785 | |||
| TKO / TKO Group Holdings, Inc. | 0.01 | 0.08 | 0.1924 | 0.1924 | |||||
| LOW / Lowe's Companies, Inc. | 0.00 | -74.79 | 0.06 | -72.81 | 0.1389 | -0.5155 | |||
| HRB / H&R Block, Inc. | 0.00 | 4.46 | 0.05 | 4.44 | 0.1104 | -0.0119 | |||
| ORI / Old Republic International Corporation | 0.00 | 4.43 | 0.05 | 2.22 | 0.1071 | -0.0139 | |||
| MAT / Mattel, Inc. | 0.00 | -100.00 | 0.00 | -100.00 | -0.4369 | ||||
| SOLV / Solventum Corporation | 0.00 | -100.00 | 0.00 | -100.00 | -0.2122 | ||||
| MDT / Medtronic plc | 0.00 | -100.00 | 0.00 | -100.00 | -0.1326 | ||||
| AMCR / Amcor plc | 0.00 | -100.00 | 0.00 | -100.00 | -0.3511 |