Statistik Asas
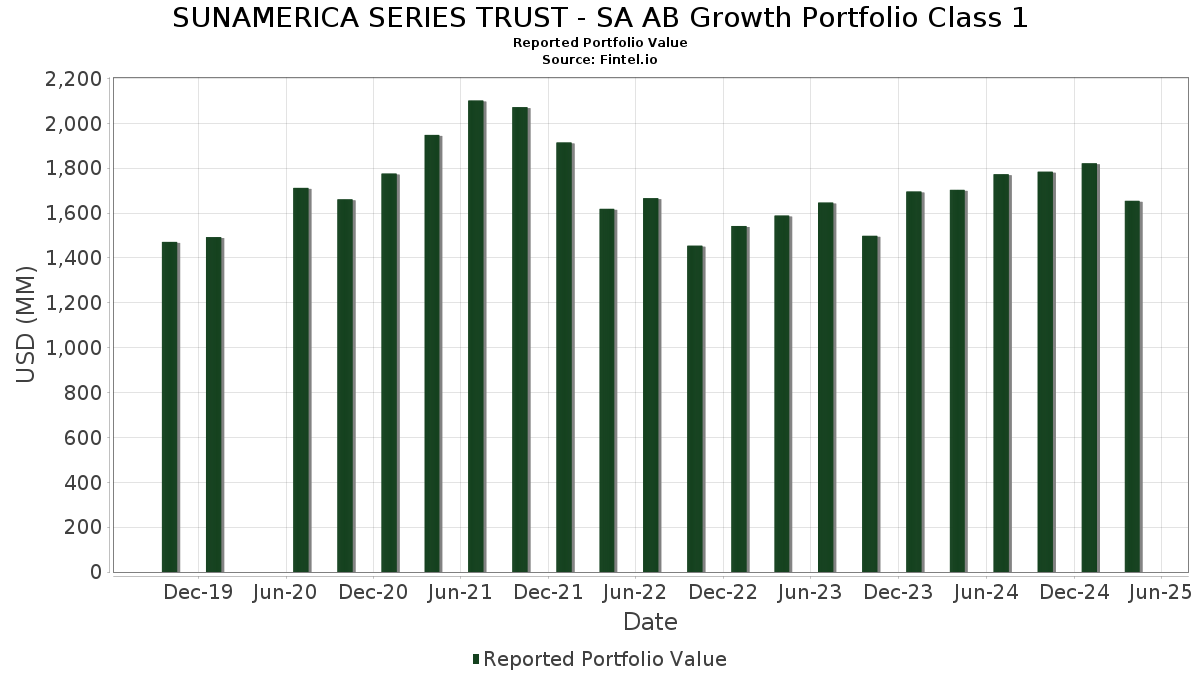
| Nilai Portfolio | $ 1,654,468,199 |
| Kedudukan Semasa | 55 |
Pegangan Terkini, Prestasi, AUM (dari 13F, 13D)
SUNAMERICA SERIES TRUST - SA AB Growth Portfolio Class 1 telah mendedahkan 55 jumlah pegangan dalam pemfailan SEC terkini mereka. Nilai portfolio terkini dikira sebagai $ 1,654,468,199 USD. Aset Sebenar Di Bawah Pengurusan (AUM) ialah nilai ini ditambah dengan tunai (yang tidak didedahkan). Pegangan teratas SUNAMERICA SERIES TRUST - SA AB Growth Portfolio Class 1 ialah NVIDIA Corporation (US:NVDA) , Microsoft Corporation (US:MSFT) , Amazon.com, Inc. (US:AMZN) , Meta Platforms, Inc. (US:META) , and Netflix, Inc. (US:NFLX) . Kedudukan baharu SUNAMERICA SERIES TRUST - SA AB Growth Portfolio Class 1 termasuk The Progressive Corporation (US:PGR) , McKesson Corporation (US:MCK) , Texas Roadhouse, Inc. (US:TXRH) , .
Kenaikan Teratas Suku Tahun Ini
Kami menggunakan perubahan dalam peruntukan portfolio kerana ini adalah metrik yang paling bermakna. Perubahan boleh disebabkan oleh perdagangan atau perubahan dalam harga saham.
| Sekuriti | Saham (MM) |
Nilai (MM$) |
Portfolio % | ΔPortfolio % |
|---|---|---|---|---|
| 0.06 | 17.50 | 1.0431 | 1.0431 | |
| 0.04 | 15.83 | 0.9436 | 0.9436 | |
| 0.02 | 14.35 | 0.8557 | 0.8557 | |
| 0.06 | 58.31 | 3.4764 | 0.8338 | |
| 0.08 | 86.75 | 5.1722 | 0.7509 | |
| 0.68 | 40.90 | 2.4388 | 0.6856 | |
| 0.34 | 66.27 | 3.9509 | 0.5063 | |
| 0.12 | 27.63 | 1.6471 | 0.3057 | |
| 0.04 | 22.73 | 1.3549 | 0.2825 | |
| 0.02 | 21.01 | 1.2529 | 0.2610 |
Penurunan Teratas Suku Tahun Ini
Kami menggunakan perubahan dalam peruntukan portfolio kerana ini adalah metrik yang paling bermakna. Perubahan boleh disebabkan oleh perdagangan atau perubahan dalam harga saham.
| Sekuriti | Saham (MM) |
Nilai (MM$) |
Portfolio % | ΔPortfolio % |
|---|---|---|---|---|
| 0.53 | 97.97 | 5.8409 | -1.1903 | |
| 0.51 | 82.31 | 4.9074 | -0.9493 | |
| 0.16 | 87.86 | 5.2384 | -0.9033 | |
| 0.28 | 23.20 | 1.3835 | -0.6184 | |
| 0.07 | 18.34 | 1.0935 | -0.4972 | |
| 0.04 | 9.97 | 0.5947 | -0.4708 | |
| 0.15 | 24.24 | 1.4454 | -0.4131 | |
| 0.32 | 127.24 | 7.5861 | -0.3842 | |
| 1.22 | 132.59 | 7.9053 | -0.3651 | |
| 0.04 | 9.53 | 0.5682 | -0.3427 |
13F dan Pemfailan Dana
Borang ini telah difailkan pada 2025-06-27 untuk tempoh pelaporan 2025-04-30. Klik ikon pautan untuk melihat sejarah transaksi penuh.
Tingkatkan untuk membuka data premium dan eksport ke Excel ![]() .
.
| Sekuriti | Jenis | Purata Harga Saham | Saham (MM) |
ΔSaham (%) |
ΔSaham (%) |
Nilai ($MM) |
Portfolio (%) |
ΔPortfolio (%) |
|
|---|---|---|---|---|---|---|---|---|---|
| NVDA / NVIDIA Corporation | 1.22 | -3.69 | 132.59 | -12.63 | 7.9053 | -0.3651 | |||
| MSFT / Microsoft Corporation | 0.32 | -8.64 | 127.24 | -13.00 | 7.5861 | -0.3842 | |||
| AMZN / Amazon.com, Inc. | 0.53 | -2.14 | 97.97 | -24.07 | 5.8409 | -1.1903 | |||
| META / Meta Platforms, Inc. | 0.16 | -2.13 | 87.86 | -22.04 | 5.2384 | -0.9033 | |||
| NFLX / Netflix, Inc. | 0.08 | -7.71 | 86.75 | 6.93 | 5.1722 | 0.7509 | |||
| V / Visa Inc. | 0.24 | -7.33 | 83.14 | -6.33 | 4.9569 | 0.1201 | |||
| GOOG / Alphabet Inc. | 0.51 | -2.13 | 82.31 | -23.41 | 4.9074 | -0.9493 | |||
| AVGO / Broadcom Inc. | 0.34 | 20.53 | 66.27 | 4.84 | 3.9509 | 0.5063 | |||
| LLY / Eli Lilly and Company | 0.06 | 8.49 | 58.31 | 20.24 | 3.4764 | 0.8338 | |||
| COST / Costco Wholesale Corporation | 0.05 | -17.60 | 51.89 | -16.37 | 3.0939 | -0.2876 | |||
| HD / The Home Depot, Inc. | 0.12 | -2.83 | 43.34 | -14.97 | 2.5842 | -0.1938 | |||
| MNST / Monster Beverage Corporation | 0.68 | 3.02 | 40.90 | 27.15 | 2.4388 | 0.6856 | |||
| ISRG / Intuitive Surgical, Inc. | 0.07 | 3.60 | 33.81 | -6.56 | 2.0160 | 0.0440 | |||
| CPRT / Copart, Inc. | 0.53 | -16.95 | 32.21 | -12.51 | 1.9202 | -0.0859 | |||
| CMG / Chipotle Mexican Grill, Inc. | 0.57 | 6.96 | 28.77 | -7.39 | 1.7155 | 0.0223 | |||
| CBOE / Cboe Global Markets, Inc. | 0.12 | 3.39 | 27.63 | 12.23 | 1.6471 | 0.3057 | |||
| VRSK / Verisk Analytics, Inc. | 0.09 | 4.65 | 26.95 | 7.92 | 1.6066 | 0.2460 | |||
| SHW / The Sherwin-Williams Company | 0.07 | 4.65 | 25.48 | 3.12 | 1.5190 | 0.1726 | |||
| TXN / Texas Instruments Incorporated | 0.15 | -18.00 | 24.24 | -28.91 | 1.4454 | -0.4131 | |||
| TSCO / Tractor Supply Company | 0.47 | 14.74 | 23.73 | 6.84 | 1.4148 | 0.2045 | |||
| ANET / Arista Networks Inc | 0.28 | -11.52 | 23.20 | -36.83 | 1.3835 | -0.6184 | |||
| VRTX / Vertex Pharmaceuticals Incorporated | 0.04 | 4.64 | 22.73 | 15.47 | 1.3549 | 0.2825 | |||
| OTIS / Otis Worldwide Corporation | 0.23 | -3.73 | 22.51 | -2.87 | 1.3422 | 0.0792 | |||
| MSI / Motorola Solutions, Inc. | 0.05 | 4.66 | 22.26 | -1.78 | 1.3272 | 0.0921 | |||
| QCOM / QUALCOMM Incorporated | 0.15 | -2.76 | 22.17 | -16.52 | 1.3217 | -0.1255 | |||
| VEEV / Veeva Systems Inc. | 0.09 | 4.46 | 21.57 | 4.65 | 1.2858 | 0.1628 | |||
| NOW / ServiceNow, Inc. | 0.02 | 23.11 | 21.01 | 15.46 | 1.2529 | 0.2610 | |||
| UNH / UnitedHealth Group Incorporated | 0.05 | 4.65 | 20.44 | -20.63 | 1.2186 | -0.1847 | |||
| TSM / Taiwan Semiconductor Manufacturing Company Limited - Depositary Receipt (Common Stock) | 0.11 | 0.27 | 18.93 | -20.15 | 1.1286 | -0.1632 | |||
| LULU / lululemon athletica inc. | 0.07 | -3.88 | 18.34 | -37.17 | 1.0935 | -0.4972 | |||
| PGR / The Progressive Corporation | 0.06 | 17.50 | 1.0431 | 1.0431 | |||||
| AMAT / Applied Materials, Inc. | 0.12 | 4.64 | 17.39 | -12.56 | 1.0368 | -0.0470 | |||
| CDNS / Cadence Design Systems, Inc. | 0.05 | 23.15 | 15.99 | 23.20 | 0.9533 | 0.2460 | |||
| SYK / Stryker Corporation | 0.04 | 15.83 | 0.9436 | 0.9436 | |||||
| WAT / Waters Corporation | 0.04 | 12.60 | 15.37 | -5.76 | 0.9165 | 0.0276 | |||
| RACE / Ferrari N.V. | 0.03 | 5.71 | 14.39 | 13.92 | 0.8577 | 0.1695 | |||
| MCK / McKesson Corporation | 0.02 | 14.35 | 0.8557 | 0.8557 | |||||
| MTD / Mettler-Toledo International Inc. | 0.01 | 30.01 | 12.52 | 2.01 | 0.7465 | 0.0776 | |||
| AXON / Axon Enterprise, Inc. | 0.02 | 13.08 | 12.13 | 6.34 | 0.7232 | 0.1016 | |||
| SNPS / Synopsys, Inc. | 0.02 | 5.71 | 11.43 | -7.66 | 0.6812 | 0.0069 | |||
| CH1134540470 / On Holding AG | 0.24 | 14.91 | 11.40 | -7.67 | 0.6797 | 0.0068 | |||
| ZTS / Zoetis Inc. | 0.07 | -32.22 | 10.83 | -37.97 | 0.6457 | -0.3058 | |||
| APP / AppLovin Corporation | 0.04 | -29.98 | 9.97 | -48.98 | 0.5947 | -0.4708 | |||
| SAIA / Saia, Inc. | 0.04 | 12.18 | 9.53 | -42.99 | 0.5682 | -0.3427 | |||
| CELH / Celsius Holdings, Inc. | 0.25 | 5.68 | 8.65 | 47.91 | 0.5159 | 0.1971 | |||
| URI / United Rentals, Inc. | 0.01 | -33.73 | 8.39 | -44.80 | 0.5003 | -0.3281 | |||
| SHOP / Shopify Inc. | 0.09 | 31.49 | 8.23 | 6.95 | 0.4907 | 0.0713 | |||
| ALAB / Astera Labs, Inc. | 0.12 | 32.60 | 7.99 | -14.61 | 0.4763 | -0.0336 | |||
| TREX / Trex Company, Inc. | 0.14 | -26.40 | 7.86 | -41.58 | 0.4687 | -0.2645 | |||
| RDDT / Reddit, Inc. | 0.06 | 13.22 | 7.51 | -33.86 | 0.4477 | -0.1710 | |||
| MANH / Manhattan Associates, Inc. | 0.04 | -23.90 | 7.17 | -35.29 | 0.4274 | -0.1763 | |||
| GMAB / Genmab A/S - Depositary Receipt (Common Stock) | 0.29 | 5.69 | 6.11 | 13.64 | 0.3642 | 0.0713 | |||
| ASML / ASML Holding N.V. - Depositary Receipt (Common Stock) | 0.01 | -36.55 | 5.11 | -42.67 | 0.3044 | -0.1808 | |||
| TXRH / Texas Roadhouse, Inc. | 0.03 | 4.18 | 0.2490 | 0.2490 | |||||
| US003CVR0169 / CONTRA ABIOMED INC | 0.03 | 0.00 | 0.07 | 7.35 | 0.0044 | 0.0007 |