Statistik Asas
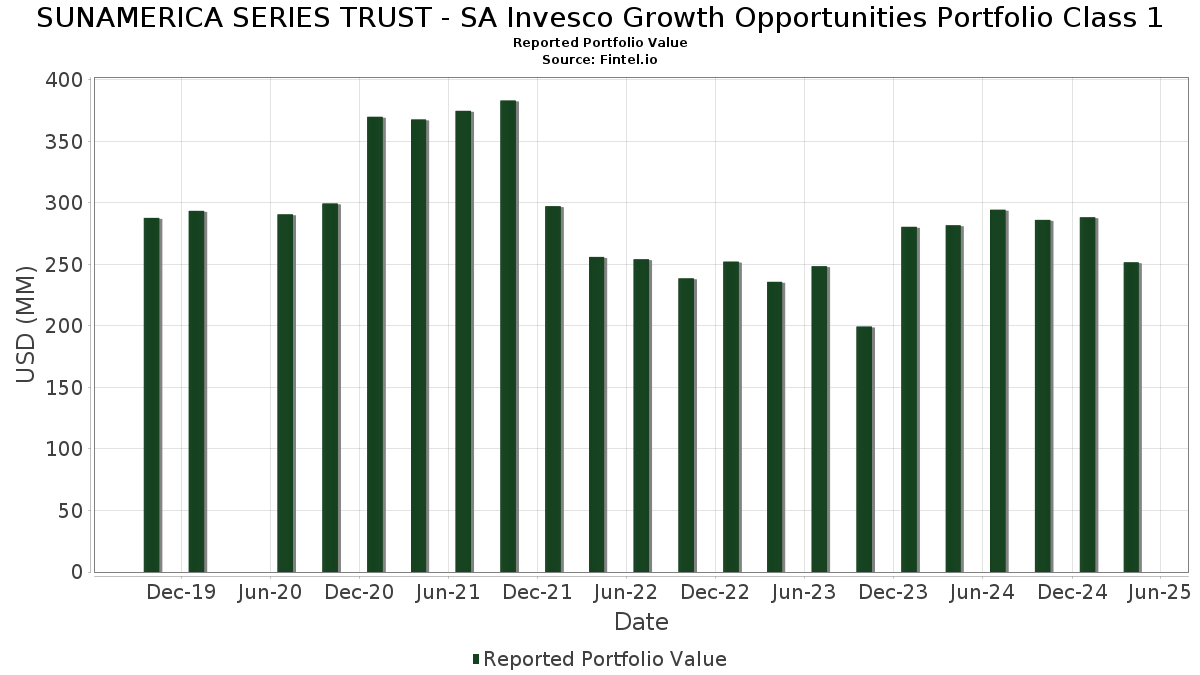
| Nilai Portfolio | $ 251,640,747 |
| Kedudukan Semasa | 111 |
Pegangan Terkini, Prestasi, AUM (dari 13F, 13D)
SUNAMERICA SERIES TRUST - SA Invesco Growth Opportunities Portfolio Class 1 telah mendedahkan 111 jumlah pegangan dalam pemfailan SEC terkini mereka. Nilai portfolio terkini dikira sebagai $ 251,640,747 USD. Aset Sebenar Di Bawah Pengurusan (AUM) ialah nilai ini ditambah dengan tunai (yang tidak didedahkan). Pegangan teratas SUNAMERICA SERIES TRUST - SA Invesco Growth Opportunities Portfolio Class 1 ialah Encompass Health Corporation (US:EHC) , Clean Harbors, Inc. (US:CLH) , TMX Group Limited (CA:X) , ADMA Biologics, Inc. (US:ADMA) , and Prestige Consumer Healthcare Inc. (US:PBH) . Kedudukan baharu SUNAMERICA SERIES TRUST - SA Invesco Growth Opportunities Portfolio Class 1 termasuk Mr. Cooper Group Inc. (US:COOP) , APi Group Corporation (US:APG) , Commvault Systems, Inc. (US:CVLT) , ESCO Technologies Inc. (US:ESE) , and Kratos Defense & Security Solutions, Inc. (GB:0JS0) .
Kenaikan Teratas Suku Tahun Ini
Kami menggunakan perubahan dalam peruntukan portfolio kerana ini adalah metrik yang paling bermakna. Perubahan boleh disebabkan oleh perdagangan atau perubahan dalam harga saham.
| Sekuriti | Saham (MM) |
Nilai (MM$) |
Portfolio % | ΔPortfolio % |
|---|---|---|---|---|
| 0.04 | 2.33 | 0.8923 | 0.8923 | |
| 0.02 | 2.28 | 0.8717 | 0.8717 | |
| 0.06 | 2.19 | 0.8395 | 0.8395 | |
| 0.01 | 2.17 | 0.8298 | 0.8298 | |
| 0.01 | 1.98 | 0.7600 | 0.7600 | |
| 0.06 | 1.95 | 0.7464 | 0.7464 | |
| 0.06 | 1.94 | 0.7438 | 0.7438 | |
| 0.05 | 1.93 | 0.7374 | 0.7374 | |
| 0.04 | 1.89 | 0.7220 | 0.7220 | |
| 0.05 | 1.75 | 0.6709 | 0.6709 |
Penurunan Teratas Suku Tahun Ini
Kami menggunakan perubahan dalam peruntukan portfolio kerana ini adalah metrik yang paling bermakna. Perubahan boleh disebabkan oleh perdagangan atau perubahan dalam harga saham.
| Sekuriti | Saham (MM) |
Nilai (MM$) |
Portfolio % | ΔPortfolio % |
|---|---|---|---|---|
| 0.00 | 0.00 | -1.2030 | ||
| 0.01 | 1.09 | 0.4173 | -0.8803 | |
| 0.00 | 0.00 | -0.7741 | ||
| 0.02 | 2.52 | 0.9661 | -0.6909 | |
| 0.02 | 0.65 | 0.2487 | -0.6490 | |
| 0.00 | 0.00 | -0.6194 | ||
| 0.03 | 0.57 | 0.2198 | -0.5059 | |
| 0.04 | 1.77 | 0.6777 | -0.4860 | |
| 0.09 | 1.80 | 0.6907 | -0.4605 | |
| 0.03 | 1.61 | 0.6154 | -0.4535 |
13F dan Pemfailan Dana
Borang ini telah difailkan pada 2025-06-27 untuk tempoh pelaporan 2025-04-30. Klik ikon pautan untuk melihat sejarah transaksi penuh.
Tingkatkan untuk membuka data premium dan eksport ke Excel ![]() .
.
| Sekuriti | Jenis | Purata Harga Saham | Saham (MM) |
ΔSaham (%) |
ΔSaham (%) |
Nilai ($MM) |
Portfolio (%) |
ΔPortfolio (%) |
|
|---|---|---|---|---|---|---|---|---|---|
| EHC / Encompass Health Corporation | 0.04 | 10.05 | 4.31 | 29.70 | 1.6505 | 0.5180 | |||
| CLH / Clean Harbors, Inc. | 0.02 | 10.05 | 4.12 | 1.05 | 1.5775 | 0.1883 | |||
| X / TMX Group Limited | 0.10 | -26.97 | 3.93 | -4.36 | 1.5044 | 0.1044 | |||
| ADMA / ADMA Biologics, Inc. | 0.16 | 10.05 | 3.86 | 62.20 | 1.4789 | 0.6675 | |||
| PBH / Prestige Consumer Healthcare Inc. | 0.05 | 10.05 | 3.75 | 16.46 | 1.4360 | 0.3386 | |||
| CRS / Carpenter Technology Corporation | 0.02 | 10.06 | 3.63 | 11.52 | 1.3896 | 0.2807 | |||
| POST / Post Holdings, Inc. | 0.03 | 10.06 | 3.60 | 17.33 | 1.3794 | 0.3331 | |||
| ROLL / RBC Bearings Inc. | 0.01 | 10.06 | 3.59 | 3.70 | 1.3740 | 0.1948 | |||
| LRN / Stride, Inc. | 0.03 | 10.05 | 3.57 | 16.06 | 1.3670 | 0.3188 | |||
| LNTH / Lantheus Holdings, Inc. | 0.03 | 10.06 | 3.52 | 24.13 | 1.3493 | 0.3820 | |||
| CVCO / Cavco Industries, Inc. | 0.01 | 10.05 | 3.49 | 6.86 | 1.3351 | 0.2232 | |||
| HLNE / Hamilton Lane Incorporated | 0.02 | 10.05 | 3.38 | 6.82 | 1.2945 | 0.2160 | |||
| QTWO / Q2 Holdings, Inc. | 0.04 | -4.07 | 3.30 | -20.12 | 1.2619 | -0.1438 | |||
| OLLI / Ollie's Bargain Outlet Holdings, Inc. | 0.03 | 21.91 | 3.25 | 16.02 | 1.2453 | 0.2900 | |||
| FSS / Federal Signal Corporation | 0.04 | 10.05 | 2.94 | -8.85 | 1.1241 | 0.0267 | |||
| AIT / Applied Industrial Technologies, Inc. | 0.01 | 10.06 | 2.93 | 2.98 | 1.1235 | 0.1526 | |||
| BRBR / BellRing Brands, Inc. | 0.04 | 10.06 | 2.92 | 9.77 | 1.1181 | 0.2116 | |||
| MMSI / Merit Medical Systems, Inc. | 0.03 | 10.06 | 2.91 | -4.53 | 1.1125 | 0.0755 | |||
| INSM / Insmed Incorporated | 0.04 | 36.98 | 2.89 | 28.78 | 1.1054 | 0.3416 | |||
| PFSI / PennyMac Financial Services, Inc. | 0.03 | 10.05 | 2.88 | 2.42 | 1.1013 | 0.1446 | |||
| ITGR / Integer Holdings Corporation | 0.02 | 10.05 | 2.85 | -2.26 | 1.0921 | 0.0978 | |||
| ASND / Ascendis Pharma A/S - Depositary Receipt (Common Stock) | 0.02 | 10.06 | 2.85 | 43.55 | 1.0918 | 0.4150 | |||
| BFAM / Bright Horizons Family Solutions Inc. | 0.02 | 10.06 | 2.84 | 12.59 | 1.0892 | 0.2283 | |||
| STEP / StepStone Group Inc. | 0.06 | 10.06 | 2.78 | -14.10 | 1.0638 | -0.0384 | |||
| ESAB / ESAB Corporation | 0.02 | 10.06 | 2.77 | 6.75 | 1.0599 | 0.1764 | |||
| MUSA / Murphy USA Inc. | 0.01 | 10.02 | 2.75 | 9.08 | 1.0539 | 0.1941 | |||
| THC / Tenet Healthcare Corporation | 0.02 | 10.05 | 2.72 | 11.67 | 1.0409 | 0.2114 | |||
| WAL / Western Alliance Bancorporation | 0.04 | 10.06 | 2.69 | -12.67 | 1.0290 | -0.0198 | |||
| PIPR / Piper Sandler Companies | 0.01 | 10.05 | 2.68 | -16.35 | 1.0268 | -0.0652 | |||
| GKOS / Glaukos Corporation | 0.03 | 10.05 | 2.66 | -33.71 | 1.0177 | -0.3482 | |||
| ACIW / ACI Worldwide, Inc. | 0.05 | 10.06 | 2.62 | 9.68 | 1.0024 | 0.1890 | |||
| ITRI / Itron, Inc. | 0.02 | 10.05 | 2.58 | 14.08 | 0.9896 | 0.2177 | |||
| TBBK / The Bancorp, Inc. | 0.05 | 10.05 | 2.57 | -12.92 | 0.9834 | -0.0216 | |||
| CYBR / CyberArk Software Ltd. | 0.01 | -5.59 | 2.55 | -10.37 | 0.9765 | 0.0069 | |||
| BLFS / BioLife Solutions, Inc. | 0.11 | 10.05 | 2.55 | -2.82 | 0.9748 | 0.0821 | |||
| TLN / Talen Energy Corporation | 0.01 | 10.06 | 2.54 | 6.72 | 0.9729 | 0.1620 | |||
| AZEK / The AZEK Company Inc. | 0.05 | 4.70 | 2.54 | 1.32 | 0.9715 | 0.1180 | |||
| CWST / Casella Waste Systems, Inc. | 0.02 | -80.66 | 2.52 | -47.88 | 0.9661 | -0.6909 | |||
| PLNT / Planet Fitness, Inc. | 0.03 | 30.74 | 2.50 | 14.36 | 0.9572 | 0.2122 | |||
| HQY / HealthEquity, Inc. | 0.03 | 10.06 | 2.49 | -14.58 | 0.9533 | -0.0396 | |||
| DSGX / The Descartes Systems Group Inc. | 0.02 | 10.05 | 2.48 | 0.16 | 0.9493 | 0.1057 | |||
| MTSI / MACOM Technology Solutions Holdings, Inc. | 0.02 | -9.09 | 2.47 | -28.70 | 0.9460 | -0.2344 | |||
| SHAK / Shake Shack Inc. | 0.03 | 10.05 | 2.47 | -18.27 | 0.9459 | -0.0839 | |||
| CART / Maplebear Inc. | 0.06 | 10.06 | 2.38 | -9.07 | 0.9099 | 0.0194 | |||
| TXRH / Texas Roadhouse, Inc. | 0.01 | 10.06 | 2.37 | 0.89 | 0.9078 | 0.1069 | |||
| WNS / WNS (Holdings) Limited | 0.04 | 2.33 | 0.8923 | 0.8923 | |||||
| CWAN / Clearwater Analytics Holdings, Inc. | 0.10 | 10.06 | 2.31 | -11.15 | 0.8854 | -0.0011 | |||
| ZWS / Zurn Elkay Water Solutions Corporation | 0.07 | 10.05 | 2.30 | -5.24 | 0.8798 | 0.0536 | |||
| MOGA / Moog, Inc. - Class A | 0.01 | 10.05 | 2.29 | 1.33 | 0.8772 | 0.1068 | |||
| GH / Guardant Health, Inc. | 0.05 | -5.42 | 2.28 | 27.16 | 0.8732 | 0.2741 | |||
| COOP / Mr. Cooper Group Inc. | 0.02 | 2.28 | 0.8717 | 0.8717 | |||||
| SITM / SiTime Corporation | 0.02 | 10.49 | 2.27 | -20.55 | 0.8674 | -0.1040 | |||
| CBZ / CBIZ, Inc. | 0.03 | 10.05 | 2.26 | -12.65 | 0.8646 | -0.0163 | |||
| CLBT / Cellebrite DI Ltd. | 0.11 | 70.56 | 2.25 | 40.44 | 0.8607 | 0.3152 | |||
| HALO / Halozyme Therapeutics, Inc. | 0.04 | -37.03 | 2.23 | -30.02 | 0.8535 | -0.2105 | |||
| MDGL / Madrigal Pharmaceuticals, Inc. | 0.01 | 10.05 | 2.20 | 9.78 | 0.8429 | 0.1595 | |||
| WH / Wyndham Hotels & Resorts, Inc. | 0.03 | 10.06 | 2.20 | -10.61 | 0.8421 | 0.0038 | |||
| APG / APi Group Corporation | 0.06 | 2.19 | 0.8395 | 0.8395 | |||||
| TRNO / Terreno Realty Corporation | 0.04 | 10.06 | 2.19 | -5.24 | 0.8379 | 0.0511 | |||
| CVLT / Commvault Systems, Inc. | 0.01 | 2.17 | 0.8298 | 0.8298 | |||||
| RGEN / Repligen Corporation | 0.02 | 10.06 | 2.16 | -8.65 | 0.8289 | 0.0216 | |||
| NVT / nVent Electric plc | 0.04 | 10.05 | 2.12 | -7.13 | 0.8126 | 0.0337 | |||
| PAR / PAR Technology Corporation | 0.04 | 10.05 | 2.09 | -11.46 | 0.7985 | -0.0040 | |||
| DOCN / DigitalOcean Holdings, Inc. | 0.07 | 10.06 | 2.06 | -18.03 | 0.7870 | -0.0672 | |||
| EXLS / ExlService Holdings, Inc. | 0.04 | 211.68 | 2.05 | -15.31 | 0.7862 | -0.2234 | |||
| AWI / Armstrong World Industries, Inc. | 0.01 | 28.54 | 2.04 | 161.83 | 0.7802 | 0.5158 | |||
| BOOT / Boot Barn Holdings, Inc. | 0.02 | 10.06 | 2.02 | -28.61 | 0.7740 | -0.1907 | |||
| TMDX / TransMedics Group, Inc. | 0.02 | 10.06 | 2.02 | 49.89 | 0.7733 | 0.3143 | |||
| NCNO / nCino, Inc. | 0.09 | 10.05 | 2.00 | -24.92 | 0.7651 | -0.1418 | |||
| FTI / TechnipFMC plc | 0.07 | -24.27 | 2.00 | -29.03 | 0.7642 | -0.1937 | |||
| ROAD / Construction Partners, Inc. | 0.02 | -35.75 | 1.99 | -34.37 | 0.7622 | -0.2711 | |||
| ESE / ESCO Technologies Inc. | 0.01 | 1.98 | 0.7600 | 0.7600 | |||||
| BPMC / Blueprint Medicines Corporation | 0.02 | 10.06 | 1.96 | -12.49 | 0.7512 | -0.0125 | |||
| VCEL / Vericel Corporation | 0.05 | 10.05 | 1.95 | -28.52 | 0.7475 | -0.1831 | |||
| 0JS0 / Kratos Defense & Security Solutions, Inc. | 0.06 | 1.95 | 0.7464 | 0.7464 | |||||
| ATMU / Atmus Filtration Technologies Inc. | 0.06 | 1.94 | 0.7438 | 0.7438 | |||||
| NPO / Enpro Inc. | 0.01 | 10.06 | 1.94 | -11.45 | 0.7434 | -0.0037 | |||
| VERX / Vertex, Inc. | 0.05 | 1.93 | 0.7374 | 0.7374 | |||||
| PCOR / Procore Technologies, Inc. | 0.03 | -16.80 | 1.92 | -32.98 | 0.7354 | -0.2410 | |||
| SITE / SiteOne Landscape Supply, Inc. | 0.02 | 160.49 | 1.92 | 110.31 | 0.7345 | 0.4235 | |||
| 855 / Upstart Holdings, Inc. | 0.04 | 1.89 | 0.7220 | 0.7220 | |||||
| ROOT / Root, Inc. | 0.01 | -22.39 | 1.88 | 11.19 | 0.7192 | 0.1436 | |||
| ESI / Element Solutions Inc | 0.09 | -32.48 | 1.80 | -46.60 | 0.6907 | -0.4605 | |||
| EXP / Eagle Materials Inc. | 0.01 | -37.20 | 1.80 | -44.64 | 0.6883 | -0.4177 | |||
| BILL / BILL Holdings, Inc. | 0.04 | 10.06 | 1.77 | -48.17 | 0.6777 | -0.4860 | |||
| AR / Antero Resources Corporation | 0.05 | 1.75 | 0.6709 | 0.6709 | |||||
| CARG / CarGurus, Inc. | 0.06 | 21.16 | 1.74 | -13.58 | 0.6652 | -0.0198 | |||
| POWI / Power Integrations, Inc. | 0.04 | 11.01 | 1.72 | -25.34 | 0.6591 | -0.1112 | |||
| LSCC / Lattice Semiconductor Corporation | 0.03 | 64.98 | 1.70 | 17.63 | 0.6493 | 0.1419 | |||
| SAIA / Saia, Inc. | 0.01 | 10.06 | 1.69 | -44.07 | 0.6469 | -0.3822 | |||
| ECG / Everus Construction Group, Inc. | 0.04 | 10.06 | 1.69 | -35.65 | 0.6464 | -0.2473 | |||
| UFPT / UFP Technologies, Inc. | 0.01 | 10.05 | 1.65 | -16.46 | 0.6337 | -0.0412 | |||
| EGP / EastGroup Properties, Inc. | 0.01 | 10.05 | 1.61 | 6.06 | 0.6162 | 0.0990 | |||
| INTA / Intapp, Inc. | 0.03 | -32.69 | 1.61 | -48.77 | 0.6154 | -0.4535 | |||
| RRC / Range Resources Corporation | 0.05 | 10.06 | 1.56 | 0.84 | 0.5966 | 0.0700 | |||
| AVPT / AvePoint, Inc. | 0.09 | 1.53 | 0.5841 | 0.5841 | |||||
| PR / Permian Resources Corporation | 0.13 | 10.06 | 1.48 | -11.33 | 0.5665 | -0.0022 | |||
| AGYS / Agilysys, Inc. | 0.02 | 10.06 | 1.47 | -9.25 | 0.5632 | 0.0106 | |||
| PI / Impinj, Inc. | 0.02 | 215.44 | 1.44 | 129.14 | 0.5513 | 0.3371 | |||
| TNL / Travel + Leisure Co. | 0.03 | 10.05 | 1.33 | -11.04 | 0.5090 | -0.0003 | |||
| HMDPF / Hammond Power Solutions Inc. | 0.02 | -3.77 | 1.26 | -10.84 | 0.4822 | 0.0009 | |||
| TTAN / ServiceTitan, Inc. | 0.01 | 137.38 | 1.20 | 167.04 | 0.4593 | 0.3062 | |||
| LOAR / Loar Holdings Inc. | 0.01 | 10.06 | 1.16 | 30.92 | 0.4430 | 0.1420 | |||
| FRPT / Freshpet, Inc. | 0.01 | -37.76 | 1.09 | -71.40 | 0.4173 | -0.8803 | |||
| CDNA / CareDx, Inc | 0.06 | 187.31 | 1.07 | 108.16 | 0.4107 | 0.2351 | |||
| FTAI / FTAI Aviation Ltd. | 0.01 | 10.06 | 1.07 | 17.27 | 0.4083 | 0.0985 | |||
| HLIT / Harmonic Inc. | 0.12 | 10.06 | 1.03 | -12.38 | 0.3958 | -0.0062 | |||
| ALHC / Alignment Healthcare, Inc. | 0.05 | 0.91 | 0.3497 | 0.3497 | |||||
| WING / Wingstop Inc. | 0.00 | 10.08 | 0.76 | -2.43 | 0.2923 | 0.0256 | |||
| BRZE / Braze, Inc. | 0.02 | -63.58 | 0.65 | -75.36 | 0.2487 | -0.6490 | |||
| SG / Sweetgreen, Inc. | 0.03 | -54.45 | 0.57 | -73.04 | 0.2198 | -0.5059 | |||
| TSEM / Tower Semiconductor Ltd. | 0.00 | -100.00 | 0.00 | -100.00 | -0.6194 | ||||
| OS / OneStream, Inc. | 0.00 | -100.00 | 0.00 | -100.00 | -0.2361 | ||||
| FLR / Fluor Corporation | 0.00 | -100.00 | 0.00 | -100.00 | -0.7741 | ||||
| CLS / Celestica Inc. | 0.00 | -100.00 | 0.00 | -100.00 | -1.2030 |