Statistik Asas
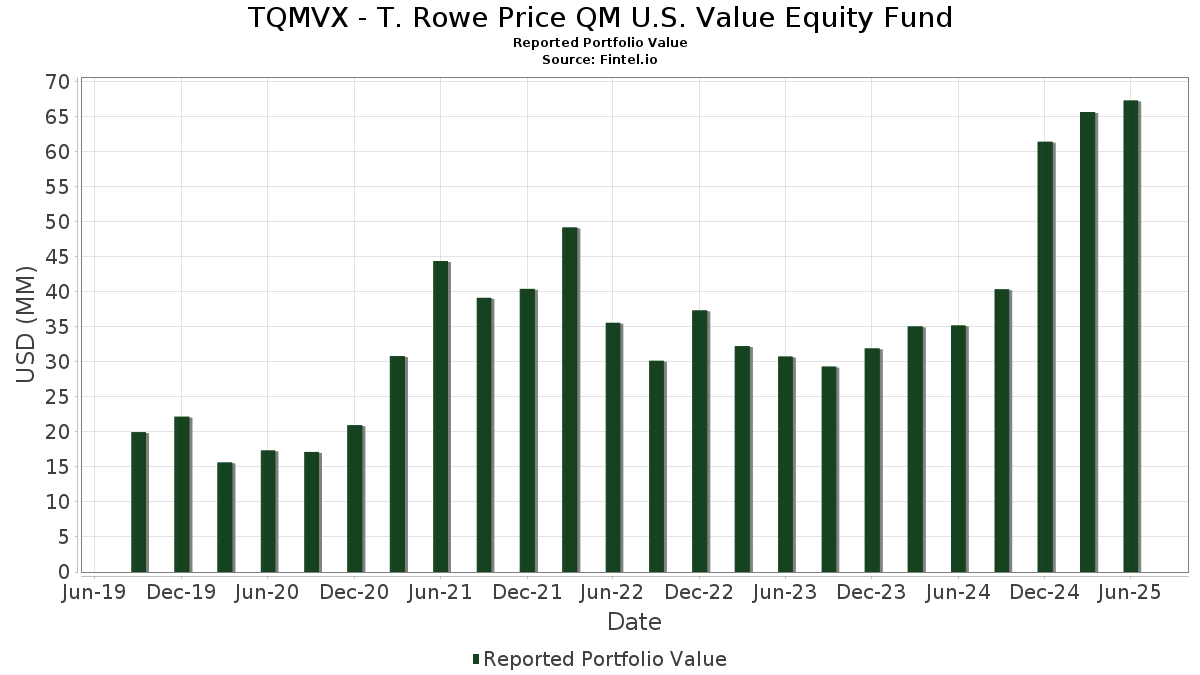
| Nilai Portfolio | $ 67,299,615 |
| Kedudukan Semasa | 149 |
Pegangan Terkini, Prestasi, AUM (dari 13F, 13D)
TQMVX - T. Rowe Price QM U.S. Value Equity Fund telah mendedahkan 149 jumlah pegangan dalam pemfailan SEC terkini mereka. Nilai portfolio terkini dikira sebagai $ 67,299,615 USD. Aset Sebenar Di Bawah Pengurusan (AUM) ialah nilai ini ditambah dengan tunai (yang tidak didedahkan). Pegangan teratas TQMVX - T. Rowe Price QM U.S. Value Equity Fund ialah Alphabet Inc. (US:GOOGL) , T. Rowe Price Government Reserve Fund (US:US76105Y1091) , Berkshire Hathaway Inc. (US:BRK.B) , Bank of America Corporation (US:BAC) , and JPMorgan Chase & Co. (US:JPM) . Kedudukan baharu TQMVX - T. Rowe Price QM U.S. Value Equity Fund termasuk Amazon.com, Inc. (US:AMZN) , Linde plc (US:LIN) , U.S. Bancorp (US:USB) , American Express Company (US:AXP) , and Deere & Company (US:DE) .
Kenaikan Teratas Suku Tahun Ini
Kami menggunakan perubahan dalam peruntukan portfolio kerana ini adalah metrik yang paling bermakna. Perubahan boleh disebabkan oleh perdagangan atau perubahan dalam harga saham.
| Sekuriti | Saham (MM) |
Nilai (MM$) |
Portfolio % | ΔPortfolio % |
|---|---|---|---|---|
| 0.01 | 1.58 | 2.3615 | 2.3615 | |
| 0.01 | 1.23 | 1.8313 | 1.8313 | |
| 1.56 | 1.56 | 2.3181 | 1.5049 | |
| 0.01 | 1.00 | 1.4933 | 1.0139 | |
| 0.01 | 0.53 | 0.7906 | 0.7906 | |
| 0.00 | 0.53 | 0.7833 | 0.7833 | |
| 0.00 | 0.48 | 0.7174 | 0.7174 | |
| 0.00 | 0.70 | 1.0452 | 0.6950 | |
| 0.01 | 0.45 | 0.6731 | 0.6731 | |
| 0.00 | 0.44 | 0.6514 | 0.6514 |
Penurunan Teratas Suku Tahun Ini
Kami menggunakan perubahan dalam peruntukan portfolio kerana ini adalah metrik yang paling bermakna. Perubahan boleh disebabkan oleh perdagangan atau perubahan dalam harga saham.
| Sekuriti | Saham (MM) |
Nilai (MM$) |
Portfolio % | ΔPortfolio % |
|---|---|---|---|---|
| 0.00 | 0.68 | 1.0150 | -1.0799 | |
| 0.00 | 0.09 | 0.1371 | -1.0607 | |
| 0.00 | 0.10 | 0.1457 | -1.0080 | |
| 0.00 | 0.21 | 0.3116 | -0.8779 | |
| 0.00 | 0.11 | 0.1647 | -0.8317 | |
| 0.00 | 1.49 | 2.2243 | -0.8076 | |
| 0.00 | 0.12 | 0.1731 | -0.7482 | |
| 0.00 | 0.22 | 0.3254 | -0.6076 | |
| 0.00 | 0.09 | 0.1327 | -0.5834 | |
| 0.00 | 0.07 | 0.1012 | -0.5787 |
13F dan Pemfailan Dana
Borang ini telah difailkan pada 2025-08-26 untuk tempoh pelaporan 2025-06-30. Klik ikon pautan untuk melihat sejarah transaksi penuh.
Tingkatkan untuk membuka data premium dan eksport ke Excel ![]() .
.
| Sekuriti | Jenis | Purata Harga Saham | Saham (MM) |
ΔSaham (%) |
ΔSaham (%) |
Nilai ($MM) |
Portfolio (%) |
ΔPortfolio (%) |
|
|---|---|---|---|---|---|---|---|---|---|
| GOOGL / Alphabet Inc. | 0.01 | 1.58 | 2.3615 | 2.3615 | |||||
| US76105Y1091 / T. Rowe Price Government Reserve Fund | 1.56 | 192.49 | 1.56 | 192.84 | 2.3181 | 1.5049 | |||
| BRK.B / Berkshire Hathaway Inc. | 0.00 | -17.46 | 1.49 | -24.72 | 2.2243 | -0.8076 | |||
| BAC / Bank of America Corporation | 0.03 | 0.00 | 1.48 | 13.38 | 2.2109 | 0.2102 | |||
| JPM / JPMorgan Chase & Co. | 0.00 | -19.30 | 1.31 | -4.66 | 1.9511 | -0.1481 | |||
| AMZN / Amazon.com, Inc. | 0.01 | 1.23 | 1.8313 | 1.8313 | |||||
| C / Citigroup Inc. | 0.01 | 0.00 | 1.16 | 19.90 | 1.7349 | 0.2502 | |||
| CRM / Salesforce, Inc. | 0.00 | 34.84 | 1.02 | 36.95 | 1.5259 | 0.3831 | |||
| SCHW / The Charles Schwab Corporation | 0.01 | 378.85 | 1.00 | 495.83 | 1.4933 | 1.0139 | |||
| QCOM / QUALCOMM Incorporated | 0.01 | 38.49 | 0.99 | 43.59 | 1.4692 | 0.4192 | |||
| LOW / Lowe's Companies, Inc. | 0.00 | 0.00 | 0.97 | -4.90 | 1.4479 | -0.1139 | |||
| PG / The Procter & Gamble Company | 0.01 | 32.80 | 0.91 | 24.18 | 1.3557 | 0.2352 | |||
| GILD / Gilead Sciences, Inc. | 0.01 | -11.22 | 0.90 | -12.16 | 1.3465 | -0.2264 | |||
| WFC / Wells Fargo & Company | 0.01 | 0.00 | 0.90 | 11.65 | 1.3440 | 0.1083 | |||
| CI / The Cigna Group | 0.00 | 27.40 | 0.86 | 27.98 | 1.2831 | 0.2546 | |||
| BK / The Bank of New York Mellon Corporation | 0.01 | -3.83 | 0.82 | 4.44 | 1.2271 | 0.0218 | |||
| MET / MetLife, Inc. | 0.01 | 51.41 | 0.79 | 51.74 | 1.1721 | 0.3790 | |||
| XOM / Exxon Mobil Corporation | 0.01 | 0.00 | 0.77 | -9.34 | 1.1437 | -0.1511 | |||
| WMT / Walmart Inc. | 0.01 | 19.90 | 0.77 | 33.51 | 1.1415 | 0.2644 | |||
| CSX / CSX Corporation | 0.02 | 0.00 | 0.75 | 10.90 | 1.1230 | 0.0837 | |||
| HIG / The Hartford Insurance Group, Inc. | 0.01 | -4.21 | 0.75 | -1.83 | 1.1174 | -0.0500 | |||
| LDOS / Leidos Holdings, Inc. | 0.00 | 0.00 | 0.75 | 17.03 | 1.1167 | 0.1366 | |||
| LHX / L3Harris Technologies, Inc. | 0.00 | 0.00 | 0.73 | 19.97 | 1.0843 | 0.1559 | |||
| TE CONNECTIVITY PLC / EC (IE000IVNQZ81) | 0.00 | 0.00 | 0.72 | 19.40 | 1.0738 | 0.1506 | |||
| SSNC / SS&C Technologies Holdings, Inc. | 0.01 | -4.40 | 0.72 | -5.27 | 1.0729 | -0.0889 | |||
| THC / Tenet Healthcare Corporation | 0.00 | -8.84 | 0.71 | 19.22 | 1.0549 | 0.1474 | |||
| META / Meta Platforms, Inc. | 0.00 | 181.07 | 0.70 | 594.06 | 1.0452 | 0.6950 | |||
| UNH / UnitedHealth Group Incorporated | 0.00 | 44.78 | 0.70 | -13.75 | 1.0374 | -0.1970 | |||
| ABBV / AbbVie Inc. | 0.00 | 135.02 | 0.69 | 108.13 | 1.0306 | 0.5227 | |||
| EQH / Equitable Holdings, Inc. | 0.01 | 0.00 | 0.69 | 7.66 | 1.0284 | 0.0485 | |||
| PM / Philip Morris International Inc. | 0.00 | -56.67 | 0.68 | -50.33 | 1.0150 | -1.0799 | |||
| AZO / AutoZone, Inc. | 0.00 | 143.24 | 0.67 | 257.22 | 0.9960 | 0.3474 | |||
| VST / Vistra Corp. | 0.00 | 0.00 | 0.65 | 65.23 | 0.9707 | 0.3671 | |||
| NOC / Northrop Grumman Corporation | 0.00 | 0.00 | 0.65 | -2.41 | 0.9688 | -0.0492 | |||
| EOG / EOG Resources, Inc. | 0.01 | 108.05 | 0.65 | 94.31 | 0.9681 | 0.4562 | |||
| KMB / Kimberly-Clark Corporation | 0.00 | -12.06 | 0.64 | -20.22 | 0.9529 | -0.2737 | |||
| JNJ / Johnson & Johnson | 0.00 | 25.08 | 0.62 | 15.13 | 0.9312 | 0.1018 | |||
| VLO / Valero Energy Corporation | 0.00 | 89.14 | 0.60 | 92.63 | 0.8970 | 0.4189 | |||
| CSCO / Cisco Systems, Inc. | 0.01 | 126.45 | 0.60 | 154.70 | 0.8890 | 0.5307 | |||
| EXC / Exelon Corporation | 0.01 | 10.46 | 0.60 | 4.02 | 0.8882 | 0.0126 | |||
| MCK / McKesson Corporation | 0.00 | 0.00 | 0.59 | 8.87 | 0.8793 | 0.0506 | |||
| CVX / Chevron Corporation | 0.00 | 44.78 | 0.59 | 23.84 | 0.8764 | 0.1507 | |||
| RNR / RenaissanceRe Holdings Ltd. | 0.00 | 0.00 | 0.58 | 1.22 | 0.8679 | -0.0121 | |||
| US21871X1090 / Corebridge Financial, Inc. | 0.02 | 0.00 | 0.57 | 12.60 | 0.8530 | 0.0746 | |||
| GDDY / GoDaddy Inc. | 0.00 | 0.00 | 0.56 | 0.00 | 0.8296 | -0.0221 | |||
| CVS / CVS Health Corporation | 0.01 | 869.88 | 0.56 | 753.85 | 0.8277 | 0.6209 | |||
| ON / ON Semiconductor Corporation | 0.01 | 0.53 | 0.7906 | 0.7906 | |||||
| LIN / Linde plc | 0.00 | 0.53 | 0.7833 | 0.7833 | |||||
| MPC / Marathon Petroleum Corporation | 0.00 | -6.02 | 0.52 | 7.02 | 0.7732 | 0.0328 | |||
| ETR / Entergy Corporation | 0.01 | -11.32 | 0.51 | -13.76 | 0.7669 | -0.1458 | |||
| T / AT&T Inc. | 0.02 | 71.56 | 0.50 | 75.52 | 0.7488 | 0.3111 | |||
| CMI / Cummins Inc. | 0.00 | 0.00 | 0.50 | 4.40 | 0.7430 | 0.0133 | |||
| TMO / Thermo Fisher Scientific Inc. | 0.00 | 0.00 | 0.48 | -18.47 | 0.7174 | -0.1860 | |||
| GS / The Goldman Sachs Group, Inc. | 0.00 | 0.48 | 0.7174 | 0.7174 | |||||
| KVUE / Kenvue Inc. | 0.02 | -11.48 | 0.48 | -22.74 | 0.7143 | -0.2344 | |||
| MCD / McDonald's Corporation | 0.00 | 276.74 | 0.47 | 252.99 | 0.7055 | 0.5001 | |||
| GPN / Global Payments Inc. | 0.01 | 0.00 | 0.46 | -18.26 | 0.6881 | -0.1757 | |||
| LAMR / Lamar Advertising Company | 0.00 | 0.00 | 0.46 | 6.73 | 0.6858 | 0.0260 | |||
| USB / U.S. Bancorp | 0.01 | 0.45 | 0.6731 | 0.6731 | |||||
| COR / Cencora, Inc. | 0.00 | 0.00 | 0.45 | 7.71 | 0.6673 | 0.0322 | |||
| AEE / Ameren Corporation | 0.00 | 0.00 | 0.45 | -4.28 | 0.6667 | -0.0485 | |||
| STT / State Street Corporation | 0.00 | -13.97 | 0.44 | 2.10 | 0.6542 | -0.0027 | |||
| AXP / American Express Company | 0.00 | 0.44 | 0.6514 | 0.6514 | |||||
| LVS / Las Vegas Sands Corp. | 0.01 | 58.37 | 0.44 | 78.69 | 0.6511 | 0.2765 | |||
| VZ / Verizon Communications Inc. | 0.01 | 45.18 | 0.43 | 38.59 | 0.6425 | 0.1664 | |||
| BKNG / Booking Holdings Inc. | 0.00 | 0.00 | 0.41 | 25.78 | 0.6040 | 0.1108 | |||
| KEY / KeyCorp | 0.02 | 0.00 | 0.40 | 8.92 | 0.6009 | 0.0349 | |||
| VTR / Ventas, Inc. | 0.01 | 0.00 | 0.38 | -8.13 | 0.5734 | -0.0673 | |||
| CPAY / Corpay, Inc. | 0.00 | 0.00 | 0.38 | -4.96 | 0.5722 | -0.0449 | |||
| ZBH / Zimmer Biomet Holdings, Inc. | 0.00 | 0.00 | 0.38 | -19.36 | 0.5652 | -0.1545 | |||
| JBL / Jabil Inc. | 0.00 | 0.00 | 0.38 | 60.26 | 0.5598 | 0.2014 | |||
| ELV / Elevance Health, Inc. | 0.00 | 0.00 | 0.37 | -10.58 | 0.5554 | -0.0819 | |||
| HBAN / Huntington Bancshares Incorporated | 0.02 | 0.00 | 0.37 | 11.75 | 0.5537 | 0.0449 | |||
| TXT / Textron Inc. | 0.00 | 0.00 | 0.37 | 11.11 | 0.5528 | 0.0424 | |||
| BAH / Booz Allen Hamilton Holding Corporation | 0.00 | 0.00 | 0.37 | -0.54 | 0.5496 | -0.0168 | |||
| DE / Deere & Company | 0.00 | 0.37 | 0.5457 | 0.5457 | |||||
| ACN / Accenture plc | 0.00 | 84.59 | 0.37 | 77.18 | 0.5444 | 0.2285 | |||
| PH / Parker-Hannifin Corporation | 0.00 | -25.82 | 0.36 | 32.97 | 0.5414 | -0.3480 | |||
| NXPI / NXP Semiconductors N.V. | 0.00 | 0.00 | 0.35 | 14.90 | 0.5181 | 0.0556 | |||
| PYPL / PayPal Holdings, Inc. | 0.00 | 100.00 | 0.34 | 127.81 | 0.5140 | 0.2825 | |||
| ULTA / Ulta Beauty, Inc. | 0.00 | 124.62 | 0.34 | 162.31 | 0.5090 | 0.0771 | |||
| SWK / Stanley Black & Decker, Inc. | 0.01 | 0.00 | 0.34 | -11.95 | 0.5057 | -0.0832 | |||
| NEE / NextEra Energy, Inc. | 0.00 | 168.13 | 0.34 | 162.02 | 0.5050 | 0.3076 | |||
| TMUS / T-Mobile US, Inc. | 0.00 | 150.71 | 0.34 | 124.00 | 0.5022 | 0.2721 | |||
| UPS / United Parcel Service, Inc. | 0.00 | -33.67 | 0.33 | -39.03 | 0.4890 | -0.3354 | |||
| PPC / Pilgrim's Pride Corporation | 0.01 | 0.00 | 0.33 | -17.51 | 0.4855 | -0.1182 | |||
| CMCSA / Comcast Corporation | 0.01 | -24.29 | 0.32 | -26.86 | 0.4840 | -0.1943 | |||
| ADP / Automatic Data Processing, Inc. | 0.00 | 0.00 | 0.32 | 0.94 | 0.4827 | -0.0080 | |||
| CEG / Constellation Energy Corporation | 0.00 | 0.00 | 0.32 | 60.20 | 0.4811 | 0.1727 | |||
| AMAT / Applied Materials, Inc. | 0.00 | 0.00 | 0.32 | 25.90 | 0.4721 | 0.0881 | |||
| SHEL / Shell plc - Depositary Receipt (Common Stock) | 0.00 | -9.78 | 0.31 | -13.37 | 0.4647 | -0.0854 | |||
| ALL / The Allstate Corporation | 0.00 | -24.03 | 0.31 | 20.78 | 0.4591 | -0.2573 | |||
| TTE / TotalEnergies SE - Depositary Receipt (Common Stock) | 0.01 | -18.16 | 0.31 | -22.28 | 0.4579 | -0.1471 | |||
| VTRS / Viatris Inc. | 0.03 | -41.49 | 0.30 | -40.00 | 0.4476 | -0.3181 | |||
| 76105YYY8 / T ROWE PRICE GOVERNMENT RESERVE INVESTMENT FUND - Collateral | 0.30 | -22.47 | 0.30 | -22.54 | 0.4463 | -0.1444 | |||
| DHR / Danaher Corporation | 0.00 | 0.29 | 0.4387 | 0.4387 | |||||
| SU / Suncor Energy Inc. | 0.01 | -32.01 | 0.29 | -34.32 | 0.4293 | -0.2405 | |||
| FLEX / Flex Ltd. | 0.01 | 0.00 | 0.27 | 50.83 | 0.4078 | 0.1305 | |||
| CNI / Canadian National Railway Company | 0.00 | 0.00 | 0.27 | 6.83 | 0.3970 | 0.0154 | |||
| SLB / Schlumberger Limited | 0.01 | 0.00 | 0.26 | -19.20 | 0.3905 | -0.1050 | |||
| MU / Micron Technology, Inc. | 0.00 | -30.55 | 0.26 | 35.45 | 0.3821 | -0.2327 | |||
| NSC / Norfolk Southern Corporation | 0.00 | -13.72 | 0.26 | -13.56 | 0.3815 | -0.4610 | |||
| RS / Reliance, Inc. | 0.00 | 0.00 | 0.26 | 8.51 | 0.3813 | 0.0214 | |||
| DOV / Dover Corporation | 0.00 | 0.00 | 0.25 | 4.53 | 0.3788 | 0.0061 | |||
| FIS / Fidelity National Information Services, Inc. | 0.00 | 0.00 | 0.25 | 8.62 | 0.3770 | 0.0221 | |||
| FTV / Fortive Corporation | 0.00 | 90.13 | 0.25 | 35.48 | 0.3770 | 0.0914 | |||
| VICI / VICI Properties Inc. | 0.01 | 0.00 | 0.24 | 0.00 | 0.3594 | -0.0096 | |||
| FE / FirstEnergy Corp. | 0.01 | 0.00 | 0.24 | -0.41 | 0.3593 | -0.0109 | |||
| AVB / AvalonBay Communities, Inc. | 0.00 | 36.99 | 0.23 | 30.17 | 0.3482 | 0.0731 | |||
| FCX / Freeport-McMoRan Inc. | 0.01 | 0.23 | 0.3418 | 0.3418 | |||||
| MO / Altria Group, Inc. | 0.00 | -63.37 | 0.22 | -64.20 | 0.3254 | -0.6076 | |||
| UNM / Unum Group | 0.00 | 0.00 | 0.21 | -0.95 | 0.3126 | -0.0110 | |||
| CL / Colgate-Palmolive Company | 0.00 | -72.29 | 0.21 | -73.10 | 0.3116 | -0.8779 | |||
| ALSN / Allison Transmission Holdings, Inc. | 0.00 | 0.00 | 0.21 | -0.48 | 0.3104 | -0.0104 | |||
| PCG / PG&E Corporation | 0.01 | -24.56 | 0.21 | -38.94 | 0.3095 | -0.2094 | |||
| DTE / DTE Energy Company | 0.00 | 0.21 | 0.3080 | 0.3080 | |||||
| AMD / Advanced Micro Devices, Inc. | 0.00 | 0.20 | 0.3003 | 0.3003 | |||||
| HON / Honeywell International Inc. | 0.00 | 0.00 | 0.20 | 9.89 | 0.2992 | 0.0200 | |||
| ZBRA / Zebra Technologies Corporation | 0.00 | 54.76 | 0.20 | 69.49 | 0.2988 | 0.1172 | |||
| HD / The Home Depot, Inc. | 0.00 | 98.18 | 0.20 | 99.00 | 0.2978 | 0.1437 | |||
| CCK / Crown Holdings, Inc. | 0.00 | 0.20 | 0.2947 | 0.2947 | |||||
| AVY / Avery Dennison Corporation | 0.00 | 0.20 | 0.2929 | 0.2929 | |||||
| FTI / TechnipFMC plc | 0.01 | -62.55 | 0.19 | -59.24 | 0.2862 | -0.4353 | |||
| APP / AppLovin Corporation | 0.00 | 0.17 | 0.2557 | 0.2557 | |||||
| NEM / Newmont Corporation | 0.00 | 0.17 | 0.2544 | 0.2544 | |||||
| ROK / Rockwell Automation, Inc. | 0.00 | 0.17 | 0.2525 | 0.2525 | |||||
| PFE / Pfizer Inc. | 0.01 | 0.17 | 0.2471 | 0.2471 | |||||
| BKR / Baker Hughes Company | 0.00 | -9.05 | 0.15 | -3.80 | 0.2274 | -0.1648 | |||
| TSM / Taiwan Semiconductor Manufacturing Company Limited - Depositary Receipt (Common Stock) | 0.00 | 9.66 | 0.15 | 81.93 | 0.2262 | -0.0109 | |||
| ESS / Essex Property Trust, Inc. | 0.00 | 0.00 | 0.15 | -7.45 | 0.2230 | -0.0245 | |||
| BBWI / Bath & Body Works, Inc. | 0.00 | -66.14 | 0.15 | -66.67 | 0.2188 | -0.4524 | |||
| CAT / Caterpillar Inc. | 0.00 | 0.14 | 0.2025 | 0.2025 | |||||
| DG / Dollar General Corporation | 0.00 | 0.13 | 0.1978 | 0.1978 | |||||
| DD / DuPont de Nemours, Inc. | 0.00 | 0.13 | 0.1963 | 0.1963 | |||||
| BMY / Bristol-Myers Squibb Company | 0.00 | 0.00 | 0.12 | -23.93 | 0.1852 | -0.0652 | |||
| EQR / Equity Residential | 0.00 | 0.00 | 0.12 | -5.34 | 0.1851 | -0.0163 | |||
| CTVA / Corteva, Inc. | 0.00 | -78.91 | 0.12 | -75.15 | 0.1844 | -0.5731 | |||
| MS / Morgan Stanley | 0.00 | -46.64 | 0.12 | -35.83 | 0.1801 | -0.1068 | |||
| FDX / FedEx Corporation | 0.00 | -79.32 | 0.12 | -80.73 | 0.1731 | -0.7482 | |||
| MMM / 3M Company | 0.00 | -83.63 | 0.11 | -83.10 | 0.1647 | -0.8317 | |||
| KDP / Keurig Dr Pepper Inc. | 0.00 | 0.10 | 0.1503 | 0.1503 | |||||
| TGT / Target Corporation | 0.00 | -54.84 | 0.10 | -57.45 | 0.1501 | -0.2108 | |||
| XEL / Xcel Energy Inc. | 0.00 | -86.53 | 0.10 | -87.14 | 0.1457 | -1.0080 | |||
| CHTR / Charter Communications, Inc. | 0.00 | -89.41 | 0.09 | -88.38 | 0.1371 | -1.0607 | |||
| SYF / Synchrony Financial | 0.00 | -84.92 | 0.09 | -80.98 | 0.1327 | -0.5834 | |||
| RAL / Ralliant Corporation | 0.00 | 0.08 | 0.1169 | 0.1169 | |||||
| SNY / Sanofi - Depositary Receipt (Common Stock) | 0.00 | -82.46 | 0.07 | -84.91 | 0.1012 | -0.5787 | |||
| FWONA / Formula One Group | 0.00 | 0.07 | 0.0991 | 0.0991 | |||||
| BLDR / Builders FirstSource, Inc. | 0.00 | -77.84 | 0.03 | -79.62 | 0.0485 | -0.1921 |