Statistik Asas
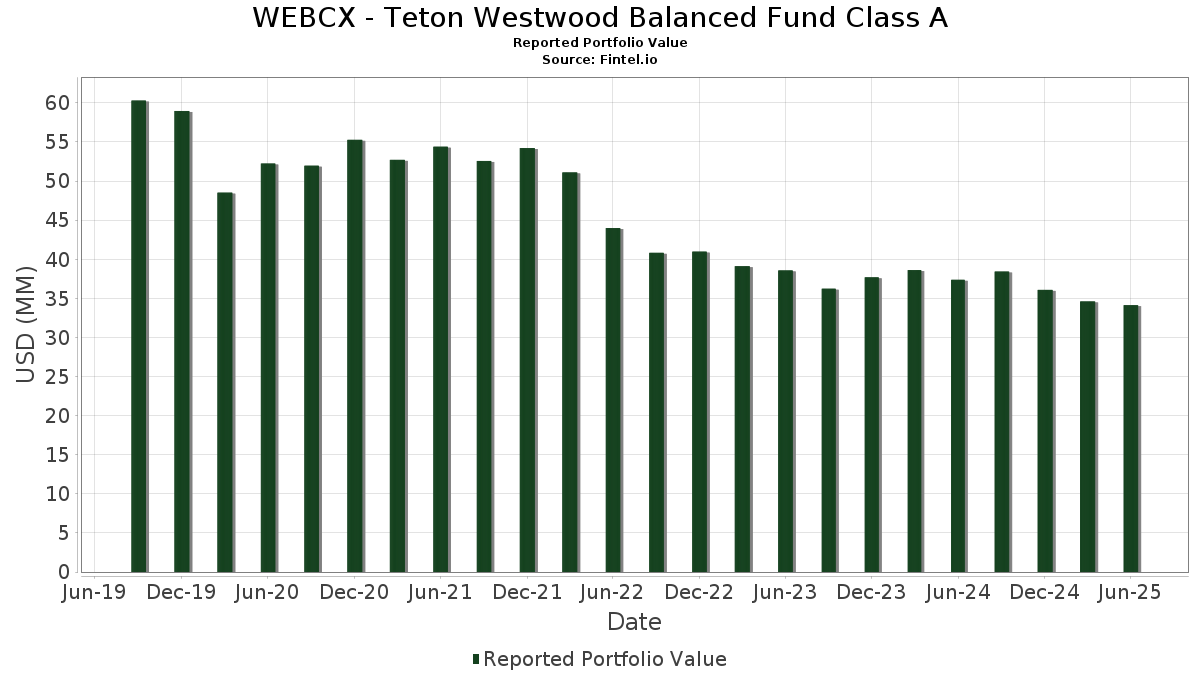
| Nilai Portfolio | $ 34,123,756 |
| Kedudukan Semasa | 100 |
Pegangan Terkini, Prestasi, AUM (dari 13F, 13D)
WEBCX - Teton Westwood Balanced Fund Class A telah mendedahkan 100 jumlah pegangan dalam pemfailan SEC terkini mereka. Nilai portfolio terkini dikira sebagai $ 34,123,756 USD. Aset Sebenar Di Bawah Pengurusan (AUM) ialah nilai ini ditambah dengan tunai (yang tidak didedahkan). Pegangan teratas WEBCX - Teton Westwood Balanced Fund Class A ialah AP Moller - Maersk A/S (DK:US00203QAE70) , JPMorgan Chase & Co. (US:JPM) , The Walt Disney Company (US:DIS) , Abbott Laboratories (US:ABT) , and Microsoft Corporation (US:MSFT) . Kedudukan baharu WEBCX - Teton Westwood Balanced Fund Class A termasuk AP Moller - Maersk A/S (DK:US00203QAE70) , Cabot Corp. (US:US127055AL59) , Bank of Montreal (CA:US06368FAJ84) , Owl Rock Capital Corp (US:US69121KAE47) , and Veralto Corporation (US:VLTO) .
Kenaikan Teratas Suku Tahun Ini
Kami menggunakan perubahan dalam peruntukan portfolio kerana ini adalah metrik yang paling bermakna. Perubahan boleh disebabkan oleh perdagangan atau perubahan dalam harga saham.
| Sekuriti | Saham (MM) |
Nilai (MM$) |
Portfolio % | ΔPortfolio % |
|---|---|---|---|---|
| 0.00 | 0.54 | 1.6067 | 1.6067 | |
| 0.00 | 0.40 | 1.1656 | 1.1656 | |
| 0.01 | 0.38 | 1.1120 | 1.1120 | |
| 0.38 | 0.38 | 1.1074 | 1.0957 | |
| 0.01 | 0.72 | 2.1366 | 0.7071 | |
| 0.24 | 0.7070 | 0.7070 | ||
| 0.01 | 0.45 | 1.3150 | 0.6678 | |
| 0.00 | 0.21 | 0.6159 | 0.6159 | |
| 0.00 | 0.45 | 1.3134 | 0.6042 | |
| 0.00 | 0.40 | 1.1712 | 0.5968 |
Penurunan Teratas Suku Tahun Ini
Kami menggunakan perubahan dalam peruntukan portfolio kerana ini adalah metrik yang paling bermakna. Perubahan boleh disebabkan oleh perdagangan atau perubahan dalam harga saham.
| Sekuriti | Saham (MM) |
Nilai (MM$) |
Portfolio % | ΔPortfolio % |
|---|---|---|---|---|
| 0.00 | 0.64 | 1.8850 | -0.8393 | |
| 0.00 | 0.37 | 1.0987 | -0.8029 | |
| 0.00 | 0.39 | 1.1602 | -0.6274 | |
| 0.00 | 0.34 | 1.0114 | -0.6148 | |
| 0.17 | 0.4969 | -0.4644 | ||
| 0.00 | 0.40 | 1.1917 | -0.3635 | |
| 0.01 | 0.69 | 2.0228 | -0.3453 | |
| 0.00 | 0.40 | 1.1886 | -0.3329 | |
| 0.00 | 0.36 | 1.0555 | -0.2511 | |
| 0.00 | 0.41 | 1.1957 | -0.2003 |
13F dan Pemfailan Dana
Borang ini telah difailkan pada 2025-08-29 untuk tempoh pelaporan 2025-06-30. Klik ikon pautan untuk melihat sejarah transaksi penuh.
Tingkatkan untuk membuka data premium dan eksport ke Excel ![]() .
.
| Sekuriti | Jenis | Purata Harga Saham | Saham (MM) |
ΔSaham (%) |
ΔSaham (%) |
Nilai ($MM) |
Portfolio (%) |
ΔPortfolio (%) |
|
|---|---|---|---|---|---|---|---|---|---|
| United States Treasury Note/Bond / DBT (US91282CLF67) | 1.12 | 0.45 | 3.3132 | 0.0984 | |||||
| US00203QAE70 / AP Moller - Maersk A/S | 0.88 | 0.92 | 2.5907 | 0.0869 | |||||
| JPM / JPMorgan Chase & Co. | 0.00 | -4.91 | 0.75 | 12.43 | 2.2170 | 0.2936 | |||
| DIS / The Walt Disney Company | 0.01 | 15.98 | 0.72 | 45.67 | 2.1366 | 0.7071 | |||
| ABT / Abbott Laboratories | 0.01 | -18.78 | 0.69 | -16.77 | 2.0228 | -0.3453 | |||
| MSFT / Microsoft Corporation | 0.00 | -49.09 | 0.64 | -32.52 | 1.8850 | -0.8393 | |||
| UNP / Union Pacific Corporation | 0.00 | -6.19 | 0.62 | -8.59 | 1.8198 | -0.1221 | |||
| ICE / Intercontinental Exchange, Inc. | 0.00 | 19.00 | 0.55 | 26.61 | 1.6297 | 0.3744 | |||
| V / Visa Inc. | 0.00 | 0.00 | 0.55 | 1.29 | 1.6198 | 0.0610 | |||
| TXN / Texas Instruments Incorporated | 0.00 | 0.54 | 1.6067 | 1.6067 | |||||
| NVDA / NVIDIA Corporation | 0.00 | -26.79 | 0.51 | 6.68 | 1.5087 | 0.1304 | |||
| AMZN / Amazon.com, Inc. | 0.00 | 18.71 | 0.51 | 36.73 | 1.5062 | 0.4335 | |||
| WM / Waste Management, Inc. | 0.00 | 0.00 | 0.51 | -1.17 | 1.5008 | 0.0204 | |||
| US127055AL59 / Cabot Corp. | 0.50 | 1.64 | 1.4682 | 0.0621 | |||||
| GOOGL / Alphabet Inc. | 0.00 | 0.00 | 0.50 | 14.06 | 1.4604 | 0.2110 | |||
| US06368FAJ84 / Bank of Montreal | 0.49 | 0.83 | 1.4408 | 0.0490 | |||||
| PGR / The Progressive Corporation | 0.00 | 1.12 | 0.48 | -4.55 | 1.4221 | -0.0320 | |||
| WFC / Wells Fargo & Company | 0.01 | 0.00 | 0.45 | 11.66 | 1.3274 | 0.1678 | |||
| MRVL / Marvell Technology, Inc. | 0.01 | 57.58 | 0.45 | 97.78 | 1.3150 | 0.6678 | |||
| GD / General Dynamics Corporation | 0.00 | 68.73 | 0.45 | 80.89 | 1.3134 | 0.6042 | |||
| ACN / Accenture plc | 0.00 | 0.00 | 0.44 | -4.32 | 1.3090 | -0.0234 | |||
| HSY / The Hershey Company | 0.00 | 0.00 | 0.43 | -2.91 | 1.2778 | -0.0061 | |||
| GS / The Goldman Sachs Group, Inc. | 0.00 | -16.64 | 0.41 | 7.81 | 1.2231 | 0.1189 | |||
| PLD / Prologis, Inc. | 0.00 | 12.69 | 0.41 | 5.91 | 1.2171 | 0.0973 | |||
| WMT / Walmart Inc. | 0.00 | 4.34 | 0.41 | 16.00 | 1.1999 | 0.1932 | |||
| SO / The Southern Company | 0.00 | -16.38 | 0.41 | -16.49 | 1.1957 | -0.2003 | |||
| TMUS / T-Mobile US, Inc. | 0.00 | -16.37 | 0.40 | -25.19 | 1.1917 | -0.3635 | |||
| AJG / Arthur J. Gallagher & Co. | 0.00 | -3.96 | 0.40 | -11.04 | 1.1914 | -0.1129 | |||
| DRI / Darden Restaurants, Inc. | 0.00 | -27.40 | 0.40 | -23.82 | 1.1886 | -0.3329 | |||
| HUBB / Hubbell Incorporated | 0.00 | 0.00 | 0.40 | 23.31 | 1.1876 | 0.2495 | |||
| US69121KAE47 / Owl Rock Capital Corp | 0.40 | 0.76 | 1.1754 | 0.0379 | |||||
| BWXT / BWX Technologies, Inc. | 0.00 | -20.53 | 0.40 | 16.03 | 1.1739 | 0.1876 | |||
| VRTX / Vertex Pharmaceuticals Incorporated | 0.00 | 116.50 | 0.40 | 99.50 | 1.1712 | 0.5968 | |||
| VLTO / Veralto Corporation | 0.00 | 0.40 | 1.1656 | 1.1656 | |||||
| ORLY / O'Reilly Automotive, Inc. | 0.00 | 905.76 | 0.39 | -36.71 | 1.1602 | -0.6274 | |||
| US172967NG21 / Citigroup Inc | 0.39 | 0.77 | 1.1538 | 0.0362 | |||||
| SSB / SouthState Corporation | 0.00 | 0.00 | 0.39 | -0.76 | 1.1535 | 0.0192 | |||
| US912810RS96 / United States Treas Bds Bond | 0.39 | -2.01 | 1.1531 | 0.0065 | |||||
| BLD / TopBuild Corp. | 0.00 | 0.00 | 0.39 | 6.06 | 1.1381 | 0.0929 | |||
| BAC / Bank of America Corporation | 0.01 | -11.46 | 0.38 | 0.26 | 1.1235 | 0.0325 | |||
| ADC / Agree Realty Corporation | 0.01 | 0.38 | 1.1120 | 1.1120 | |||||
| CRM / Salesforce, Inc. | 0.00 | 0.00 | 0.38 | 1.63 | 1.1082 | 0.0449 | |||
| DIRXX / Dreyfus Treasury Securities Cash Management - Dreyfus Treasury Securities Cash Management Institutional Shares | 0.38 | 8,787.22 | 0.38 | 9,275.00 | 1.1074 | 1.0957 | |||
| US404280DQ93 / HSBC Holdings PLC | 0.37 | -0.53 | 1.1014 | 0.0215 | |||||
| JNJ / Johnson & Johnson | 0.00 | -38.84 | 0.37 | -43.72 | 1.0987 | -0.8029 | |||
| WEC / WEC Energy Group, Inc. | 0.00 | 0.00 | 0.37 | -4.38 | 1.0958 | -0.0216 | |||
| CHD / Church & Dwight Co., Inc. | 0.00 | -9.79 | 0.36 | -21.37 | 1.0555 | -0.2511 | |||
| BRK.B / Berkshire Hathaway Inc. | 0.00 | -33.52 | 0.34 | -39.47 | 1.0114 | -0.6148 | |||
| CVX / Chevron Corporation | 0.00 | 0.00 | 0.33 | -14.47 | 0.9772 | -0.1359 | |||
| XOM / Exxon Mobil Corporation | 0.00 | 0.00 | 0.32 | -9.55 | 0.9525 | -0.0720 | |||
| US24703DBL47 / Dell International LLC/EMC Corp. | 0.31 | 1.31 | 0.9145 | 0.0340 | |||||
| US30063PAB13 / Exas 3/8 3/15/27 Bond | 0.31 | 3.68 | 0.9144 | 0.0542 | |||||
| US912810TJ79 / United States Treasury Note/Bond | 0.30 | -2.31 | 0.8747 | 0.0011 | |||||
| FCT / Fincantieri S.p.A. | 0.28 | 1.09 | 0.8239 | 0.0289 | |||||
| US72147KAK43 / Pilgrim's Pride Corp 6.250%, Due 07/01/33 | 0.26 | 2.33 | 0.7804 | 0.0358 | |||||
| US832696AT51 / JM SMUCKER CO SR UNSECURED 03/50 3.55 | 0.26 | -2.96 | 0.7737 | -0.0026 | |||||
| MPT Operating Partnership LP / MPT Finance Corp / DBT (US55342UAQ76) | 0.26 | 2.76 | 0.7716 | 0.0388 | |||||
| US68389XCJ28 / Oracle Corp | 0.26 | 1.57 | 0.7664 | 0.0315 | |||||
| US912810RK60 / United States Treas Bds Bond | 0.26 | -1.91 | 0.7591 | 0.0054 | |||||
| Performance Food Group Inc / DBT (US71376LAF76) | 0.26 | 2.82 | 0.7549 | 0.0395 | |||||
| US226373AR90 / Crestwood Midstream Partners LP / Crestwood Midstream Finance Corp | 0.25 | 0.00 | 0.7492 | 0.0180 | |||||
| A19QHV / Plains All American Pipeline, L.P. - Preferred Security | 0.25 | 1.20 | 0.7432 | 0.0266 | |||||
| NEE / NextEra Energy, Inc. | 0.00 | 0.00 | 0.25 | -1.97 | 0.7364 | 0.0032 | |||
| US55336VBQ23 / MPLX LP | 0.25 | 1.64 | 0.7342 | 0.0307 | |||||
| US06051GKD06 / Bank of America Corp | 0.24 | 2.54 | 0.7147 | 0.0334 | |||||
| BCC / Boise Cascade Company | 0.00 | -13.58 | 0.24 | -23.49 | 0.7123 | -0.1956 | |||
| Golub Capital Private Credit Fund / DBT (US38179RAD70) | 0.24 | 0.7070 | 0.7070 | ||||||
| US12543DBN93 / CHS/Community Health Systems Inc | 0.24 | 7.69 | 0.7042 | 0.0665 | |||||
| US29279FAA75 / Energy Transfer Operating LP | 0.23 | 0.00 | 0.6853 | 0.0168 | |||||
| US756109BL76 / Realty Income Corp | 0.23 | 2.20 | 0.6850 | 0.0300 | |||||
| US11135FAQ46 / CORPORATE BONDS | 0.23 | 1.76 | 0.6822 | 0.0289 | |||||
| US720186AP00 / PIEDMONT NATURAL GAS CO REGD 5.05000000 | 0.23 | -0.43 | 0.6776 | 0.0151 | |||||
| APH / Amphenol Corporation | 0.00 | -17.43 | 0.23 | 24.31 | 0.6652 | 0.1435 | |||
| US02005NBT63 / Ally Financial Inc | 0.22 | 1.38 | 0.6519 | 0.0224 | |||||
| Bank of America Corp / DBT (US06051GMD87) | 0.21 | 2.44 | 0.6203 | 0.0295 | |||||
| Bank of America Corp / DBT (US06051GMD87) | 0.21 | 2.44 | 0.6203 | 0.0295 | |||||
| MCK / McKesson Corporation | 0.00 | 0.21 | 0.6159 | 0.6159 | |||||
| US46284VAP67 / Iron Mountain, Inc. | 0.21 | 1.47 | 0.6110 | 0.0223 | |||||
| DE / Deere & Company | 0.00 | 0.20 | 0.5863 | 0.5863 | |||||
| S1TT34 / State Street Corporation - Depositary Receipt (Common Stock) | 0.20 | 1.54 | 0.5853 | 0.0239 | |||||
| S1TT34 / State Street Corporation - Depositary Receipt (Common Stock) | 0.20 | 1.54 | 0.5853 | 0.0239 | |||||
| US55342UAJ34 / MPT Operating Partnership LP | 0.20 | 3.68 | 0.5813 | 0.0330 | |||||
| AMT / American Tower Corporation | 0.00 | 0.20 | 0.5762 | 0.5762 | |||||
| US126650DG21 / CVS Health Corp | 0.19 | 2.15 | 0.5606 | 0.0240 | |||||
| US912810RT79 / United States Treas Bds Bond | 0.19 | -1.58 | 0.5517 | 0.0028 | |||||
| US466313AL75 / Jabil Inc | 0.19 | 0.54 | 0.5501 | 0.0167 | |||||
| ADBE / Adobe Inc. | 0.00 | 0.18 | 0.5420 | 0.5420 | |||||
| US161175BV50 / Charter Communications Operating LLC / Charter Communications Operating Capital | 0.18 | 6.51 | 0.5316 | 0.0436 | |||||
| PEP / PepsiCo, Inc. | 0.00 | -11.12 | 0.18 | -21.83 | 0.5292 | -0.1300 | |||
| MPWR / Monolithic Power Systems, Inc. | 0.00 | -5.24 | 0.17 | 19.58 | 0.5069 | 0.0933 | |||
| US053332BA96 / AUTOZONE INC 1.65% 01/15/2031 | 0.17 | 1.79 | 0.5058 | 0.0226 | |||||
| US29273VAM28 / Energy Transfer LP | 0.17 | -49.70 | 0.4969 | -0.4644 | |||||
| CDNS / Cadence Design Systems, Inc. | 0.00 | -24.01 | 0.17 | -8.33 | 0.4889 | -0.0288 | |||
| ENB.PRN / Enbridge Inc. - Preferred Security | 0.16 | 0.4848 | 0.4848 | ||||||
| EOG / EOG Resources, Inc. | 0.00 | -17.16 | 0.16 | -22.55 | 0.4667 | -0.1222 | |||
| US68389XCK90 / ORACLE CORPORATION | 0.15 | 1.35 | 0.4437 | 0.0169 | |||||
| US11120VAK98 / Brixmor Operating Partnership LP | 0.14 | 2.16 | 0.4188 | 0.0185 | |||||
| US912810SU34 / United States Treasury Note/Bond | 0.13 | -2.22 | 0.3903 | 0.0005 | |||||
| US25278XAV10 / Diamondback Energy Inc | 0.10 | 1.00 | 0.2985 | 0.0102 | |||||
| US17888HAA14 / Civitas Resources Inc | 0.01 | 0.00 | 0.0302 | 0.0006 |