Statistik Asas
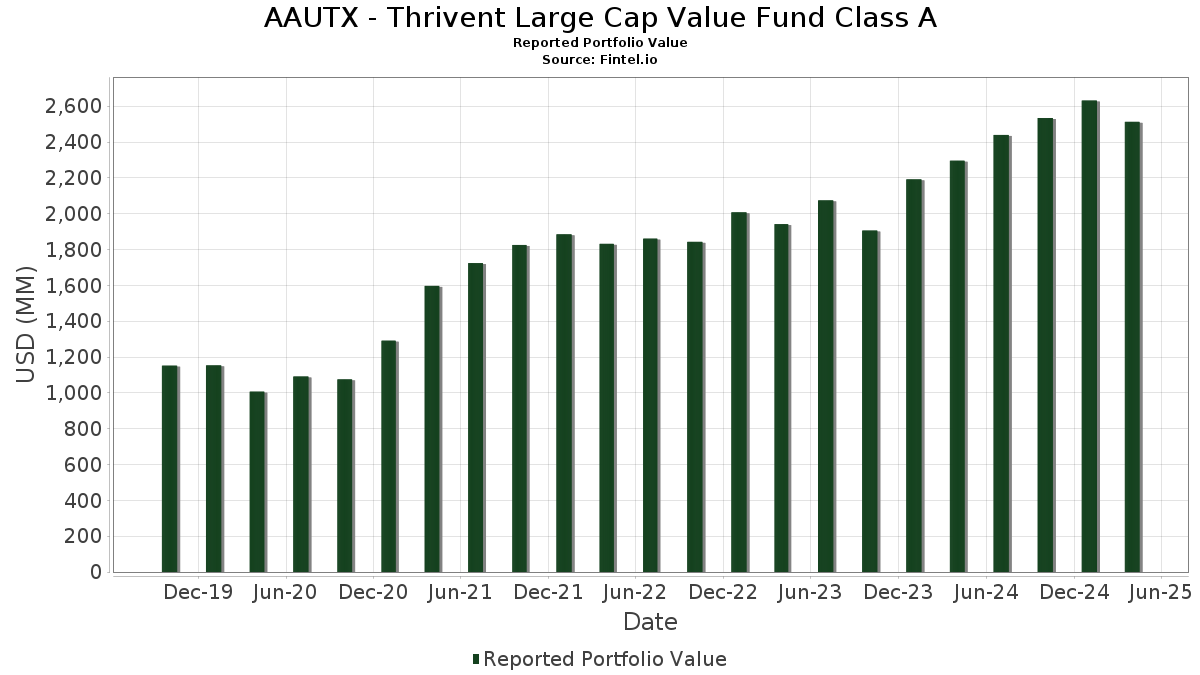
| Nilai Portfolio | $ 2,512,524,047 |
| Kedudukan Semasa | 86 |
Pegangan Terkini, Prestasi, AUM (dari 13F, 13D)
AAUTX - Thrivent Large Cap Value Fund Class A telah mendedahkan 86 jumlah pegangan dalam pemfailan SEC terkini mereka. Nilai portfolio terkini dikira sebagai $ 2,512,524,047 USD. Aset Sebenar Di Bawah Pengurusan (AUM) ialah nilai ini ditambah dengan tunai (yang tidak didedahkan). Pegangan teratas AAUTX - Thrivent Large Cap Value Fund Class A ialah Wells Fargo & Company (US:WFC) , Microsoft Corporation (US:MSFT) , Exxon Mobil Corporation (US:XOM) , Bank of America Corporation (US:BAC) , and Johnson & Johnson (US:JNJ) . Kedudukan baharu AAUTX - Thrivent Large Cap Value Fund Class A termasuk State Street Institutional Investment Trust - State Street Institutional US Govt Money Market Fnd Premier Cls (US:GVMXX) , Cencora, Inc. (US:COR) , Micron Technology, Inc. (US:MU) , BioMarin Pharmaceutical Inc. (US:BMRN) , and .
Kenaikan Teratas Suku Tahun Ini
Kami menggunakan perubahan dalam peruntukan portfolio kerana ini adalah metrik yang paling bermakna. Perubahan boleh disebabkan oleh perdagangan atau perubahan dalam harga saham.
| Sekuriti | Saham (MM) |
Nilai (MM$) |
Portfolio % | ΔPortfolio % |
|---|---|---|---|---|
| 55.28 | 55.28 | 2.2212 | 2.2212 | |
| 0.18 | 69.54 | 2.7943 | 1.4107 | |
| 27.02 | 27.02 | 1.0858 | 1.0858 | |
| 0.06 | 18.86 | 0.7577 | 0.7577 | |
| 0.16 | 12.18 | 0.4895 | 0.4895 | |
| 0.18 | 11.55 | 0.4642 | 0.4642 | |
| 0.24 | 30.03 | 1.2067 | 0.4612 | |
| 0.14 | 34.66 | 1.3925 | 0.4029 | |
| 1.17 | 51.48 | 2.0683 | 0.3229 | |
| 0.20 | 23.81 | 0.9569 | 0.3203 |
Penurunan Teratas Suku Tahun Ini
Kami menggunakan perubahan dalam peruntukan portfolio kerana ini adalah metrik yang paling bermakna. Perubahan boleh disebabkan oleh perdagangan atau perubahan dalam harga saham.
| Sekuriti | Saham (MM) |
Nilai (MM$) |
Portfolio % | ΔPortfolio % |
|---|---|---|---|---|
| 0.10 | 24.24 | 0.9738 | -0.8672 | |
| 0.16 | 12.12 | 0.4870 | -0.4104 | |
| 0.23 | 24.78 | 0.9957 | -0.3440 | |
| 0.07 | 38.04 | 1.5286 | -0.2828 | |
| 0.50 | 22.83 | 0.9175 | -0.2816 | |
| 0.21 | 33.97 | 1.3648 | -0.2815 | |
| 0.15 | 27.07 | 1.0875 | -0.2693 | |
| 1.52 | 60.57 | 2.4337 | -0.2334 | |
| 0.72 | 9.38 | 0.3768 | -0.2332 | |
| 2.67 | 13.49 | 0.5419 | -0.2006 |
13F dan Pemfailan Dana
Borang ini telah difailkan pada 2025-06-26 untuk tempoh pelaporan 2025-04-30. Klik ikon pautan untuk melihat sejarah transaksi penuh.
Tingkatkan untuk membuka data premium dan eksport ke Excel ![]() .
.
| Sekuriti | Jenis | Purata Harga Saham | Saham (MM) |
ΔSaham (%) |
ΔSaham (%) |
Nilai ($MM) |
Portfolio (%) |
ΔPortfolio (%) |
|
|---|---|---|---|---|---|---|---|---|---|
| WFC / Wells Fargo & Company | 1.15 | 0.00 | 81.97 | -9.89 | 3.2938 | -0.1565 | |||
| MSFT / Microsoft Corporation | 0.18 | 100.19 | 69.54 | 90.64 | 2.7943 | 1.4107 | |||
| XOM / Exxon Mobil Corporation | 0.63 | 0.00 | 66.37 | -1.12 | 2.6668 | 0.1209 | |||
| BAC / Bank of America Corporation | 1.52 | 0.00 | 60.57 | -13.87 | 2.4337 | -0.2334 | |||
| JNJ / Johnson & Johnson | 0.37 | 0.00 | 57.88 | 2.73 | 2.3255 | 0.1888 | |||
| GVMXX / State Street Institutional Investment Trust - State Street Institutional US Govt Money Market Fnd Premier Cls | 55.28 | 55.28 | 2.2212 | 2.2212 | |||||
| CSCO / Cisco Systems, Inc. | 0.95 | 0.00 | 55.11 | -4.74 | 2.2144 | 0.0202 | |||
| ETR / Entergy Corporation | 0.62 | 0.00 | 51.76 | 2.58 | 2.0797 | 0.1659 | |||
| VZ / Verizon Communications Inc. | 1.17 | 0.00 | 51.48 | 11.86 | 2.0683 | 0.3229 | |||
| JPM / JPMorgan Chase & Co. | 0.21 | 0.00 | 50.66 | -8.48 | 2.0357 | -0.0641 | |||
| SCHW / The Charles Schwab Corporation | 0.59 | 14.14 | 48.02 | 12.32 | 1.9295 | 0.3079 | |||
| DUK / Duke Energy Corporation | 0.39 | 0.00 | 47.17 | 8.96 | 1.8954 | 0.2533 | |||
| UNH / UnitedHealth Group Incorporated | 0.11 | 16.53 | 46.35 | -11.62 | 1.8626 | -0.1268 | |||
| MRK / Merck & Co., Inc. | 0.49 | 21.43 | 41.57 | 4.69 | 1.6703 | 0.1643 | |||
| SYY / Sysco Corporation | 0.55 | 0.00 | 39.40 | -2.08 | 1.5833 | 0.0569 | |||
| QCOM / QUALCOMM Incorporated | 0.26 | 0.00 | 39.33 | -14.15 | 1.5803 | -0.1573 | |||
| CF / CF Industries Holdings, Inc. | 0.49 | 33.74 | 38.71 | 13.66 | 1.5554 | 0.2637 | |||
| META / Meta Platforms, Inc. | 0.07 | 0.00 | 38.04 | -20.34 | 1.5286 | -0.2828 | |||
| EPD / Enterprise Products Partners L.P. - Limited Partnership | 1.22 | 0.00 | 36.45 | -8.42 | 1.4646 | -0.0451 | |||
| HON / Honeywell International Inc. | 0.17 | 0.00 | 36.29 | -5.91 | 1.4580 | -0.0047 | |||
| NUE / Nucor Corporation | 0.30 | 22.93 | 35.32 | 14.26 | 1.4191 | 0.2467 | |||
| LH / Labcorp Holdings Inc. | 0.14 | 37.66 | 34.66 | 32.82 | 1.3925 | 0.4029 | |||
| CB / Chubb Limited | 0.12 | 0.00 | 34.39 | 5.22 | 1.3819 | 0.1422 | |||
| GOOG / Alphabet Inc. | 0.21 | 0.00 | 33.97 | -21.75 | 1.3648 | -0.2815 | |||
| 05935 / Samsung Electronics Co Ltd | 0.86 | 0.00 | 33.66 | 9.25 | 1.3525 | 0.1839 | |||
| KVUE / Kenvue Inc. | 1.40 | 8.47 | 33.01 | 20.24 | 1.3264 | 0.2851 | |||
| SNY / Sanofi - Depositary Receipt (Common Stock) | 0.59 | 0.00 | 32.39 | 1.12 | 1.3014 | 0.0866 | |||
| SNX / TD SYNNEX Corporation | 0.29 | 25.78 | 32.32 | -2.20 | 1.2987 | 0.0452 | |||
| DAL / Delta Air Lines, Inc. | 0.77 | 35.29 | 31.87 | -16.27 | 1.2805 | -0.1632 | |||
| COP / ConocoPhillips | 0.36 | 0.00 | 31.84 | -9.82 | 1.2795 | -0.0599 | |||
| LOW / Lowe's Companies, Inc. | 0.14 | 0.00 | 30.42 | -14.03 | 1.2223 | -0.1198 | |||
| DHI / D.R. Horton, Inc. | 0.24 | 71.61 | 30.03 | 52.80 | 1.2067 | 0.4612 | |||
| CCI / Crown Castle Inc. | 0.28 | 0.00 | 29.61 | 18.46 | 1.1898 | 0.2417 | |||
| PEG / Public Service Enterprise Group Incorporated | 0.36 | 0.00 | 29.04 | -4.32 | 1.1669 | 0.0157 | |||
| ZBH / Zimmer Biomet Holdings, Inc. | 0.28 | 0.00 | 28.60 | -5.87 | 1.1493 | -0.0033 | |||
| CNH / CNH Industrial N.V. | 2.47 | 0.00 | 28.55 | -10.17 | 1.1473 | -0.0583 | |||
| CI / The Cigna Group | 0.08 | 0.00 | 28.02 | 15.58 | 1.1260 | 0.2064 | |||
| LHX / L3Harris Technologies, Inc. | 0.13 | 0.00 | 27.80 | 3.78 | 1.1172 | 0.1010 | |||
| CMCSA / Comcast Corporation | 0.81 | 0.00 | 27.56 | 1.61 | 1.1075 | 0.0786 | |||
| COF / Capital One Financial Corporation | 0.15 | -14.50 | 27.07 | -24.34 | 1.0875 | -0.2693 | |||
| Thrivent Cash Management Trust / STIV (N/A) | 27.02 | 27.02 | 1.0858 | 1.0858 | |||||
| MET / MetLife, Inc. | 0.36 | 0.00 | 26.81 | -12.88 | 1.0775 | -0.0899 | |||
| SONY / Sony Group Corporation - Depositary Receipt (Common Stock) | 1.03 | 0.00 | 26.78 | 18.13 | 1.0761 | 0.2162 | |||
| DFS / Discover Financial Services | 0.15 | 0.00 | 26.67 | -9.16 | 1.0717 | -0.0419 | |||
| BK / The Bank of New York Mellon Corporation | 0.33 | 0.00 | 26.42 | -6.43 | 1.0615 | -0.0093 | |||
| GD / General Dynamics Corporation | 0.10 | -10.83 | 26.40 | -5.58 | 1.0609 | 0.0003 | |||
| CEG / Constellation Energy Corporation | 0.12 | 10.39 | 26.25 | -17.78 | 1.0549 | -0.1562 | |||
| TSM / Taiwan Semiconductor Manufacturing Company Limited - Depositary Receipt (Common Stock) | 0.16 | 0.00 | 26.25 | -20.37 | 1.0547 | -0.1955 | |||
| ICE / Intercontinental Exchange, Inc. | 0.15 | 0.00 | 25.83 | 5.09 | 1.0379 | 0.1056 | |||
| AIG / American International Group, Inc. | 0.31 | 0.00 | 25.65 | 10.67 | 1.0307 | 0.1516 | |||
| GILD / Gilead Sciences, Inc. | 0.23 | -35.99 | 24.78 | -29.84 | 0.9957 | -0.3440 | |||
| IBM / International Business Machines Corporation | 0.10 | -47.20 | 24.24 | -50.07 | 0.9738 | -0.8672 | |||
| BKNG / Booking Holdings Inc. | 0.00 | 0.00 | 24.03 | 7.63 | 0.9657 | 0.1188 | |||
| FCNCA / First Citizens BancShares, Inc. | 0.01 | 12.28 | 23.82 | -9.39 | 0.9570 | -0.0400 | |||
| SJM / The J. M. Smucker Company | 0.20 | 30.44 | 23.81 | 41.89 | 0.9569 | 0.3203 | |||
| FLS / Flowserve Corporation | 0.50 | 0.00 | 22.83 | -27.77 | 0.9175 | -0.2816 | |||
| KEY / KeyCorp | 1.54 | 0.00 | 22.78 | -17.46 | 0.9153 | -0.1315 | |||
| HR / Healthcare Realty Trust Incorporated | 1.46 | 15.60 | 22.65 | 7.18 | 0.9100 | 0.1085 | |||
| J / Jacobs Solutions Inc. | 0.17 | 0.00 | 21.56 | -11.65 | 0.8663 | -0.0593 | |||
| VST / Vistra Corp. | 0.16 | 14.03 | 20.52 | -12.04 | 0.8244 | -0.0602 | |||
| WH / Wyndham Hotels & Resorts, Inc. | 0.23 | 34.04 | 19.99 | 8.88 | 0.8033 | 0.1068 | |||
| ALL / The Allstate Corporation | 0.10 | 0.00 | 19.84 | 3.15 | 0.7973 | 0.0677 | |||
| UPS / United Parcel Service, Inc. | 0.21 | 0.00 | 19.84 | -16.57 | 0.7972 | -0.1048 | |||
| CSX / CSX Corporation | 0.70 | 0.00 | 19.68 | -14.60 | 0.7907 | -0.0833 | |||
| CTVA / Corteva, Inc. | 0.32 | 0.00 | 19.54 | -5.03 | 0.7853 | 0.0048 | |||
| COR / Cencora, Inc. | 0.06 | 18.86 | 0.7577 | 0.7577 | |||||
| CBRE / CBRE Group, Inc. | 0.15 | 0.00 | 17.86 | -15.59 | 0.7175 | -0.0848 | |||
| DVN / Devon Energy Corporation | 0.58 | -11.92 | 17.62 | -21.45 | 0.7080 | -0.1428 | |||
| MPC / Marathon Petroleum Corporation | 0.12 | 0.00 | 16.98 | -5.70 | 0.6825 | -0.0007 | |||
| JBHT / J.B. Hunt Transport Services, Inc. | 0.13 | 0.00 | 16.70 | -23.74 | 0.6709 | -0.1595 | |||
| HXL / Hexcel Corporation | 0.33 | 60.29 | 15.90 | 19.16 | 0.6389 | 0.1328 | |||
| SHEL / Shell plc | 0.23 | 0.00 | 14.64 | -2.08 | 0.5884 | 0.0212 | |||
| WBD / Warner Bros. Discovery, Inc. | 1.67 | 20.86 | 14.50 | 0.37 | 0.5827 | 0.0347 | |||
| CAT / Caterpillar Inc. | 0.05 | 0.00 | 14.06 | -16.74 | 0.5651 | -0.0756 | |||
| APTV / Aptiv PLC | 0.24 | 0.00 | 13.85 | -8.59 | 0.5566 | -0.0182 | |||
| COTY / Coty Inc. | 2.67 | 0.00 | 13.49 | -31.11 | 0.5419 | -0.2006 | |||
| HAL / Halliburton Company | 0.64 | 14.68 | 12.77 | -12.65 | 0.5129 | -0.0414 | |||
| MMC / Marsh & McLennan Companies, Inc. | 0.05 | 0.00 | 12.39 | 3.96 | 0.4978 | 0.0458 | |||
| MU / Micron Technology, Inc. | 0.16 | 12.18 | 0.4895 | 0.4895 | |||||
| EMN / Eastman Chemical Company | 0.16 | -33.70 | 12.12 | -48.77 | 0.4870 | -0.4104 | |||
| AVB / AvalonBay Communities, Inc. | 0.06 | 0.00 | 11.78 | -5.21 | 0.4732 | 0.0020 | |||
| BMRN / BioMarin Pharmaceutical Inc. | 0.18 | 11.55 | 0.4642 | 0.4642 | |||||
| AMTM / Amentum Holdings, Inc. | 0.51 | 0.00 | 11.16 | 4.06 | 0.4484 | 0.0416 | |||
| AMGN / Amgen Inc. | 0.04 | 0.00 | 10.90 | 1.93 | 0.4381 | 0.0324 | |||
| AVTR / Avantor, Inc. | 0.72 | 0.00 | 9.38 | -41.70 | 0.3768 | -0.2332 | |||
| COLM / Columbia Sportswear Company | 0.12 | 0.00 | 7.74 | -29.59 | 0.3109 | -0.1059 |