Statistik Asas
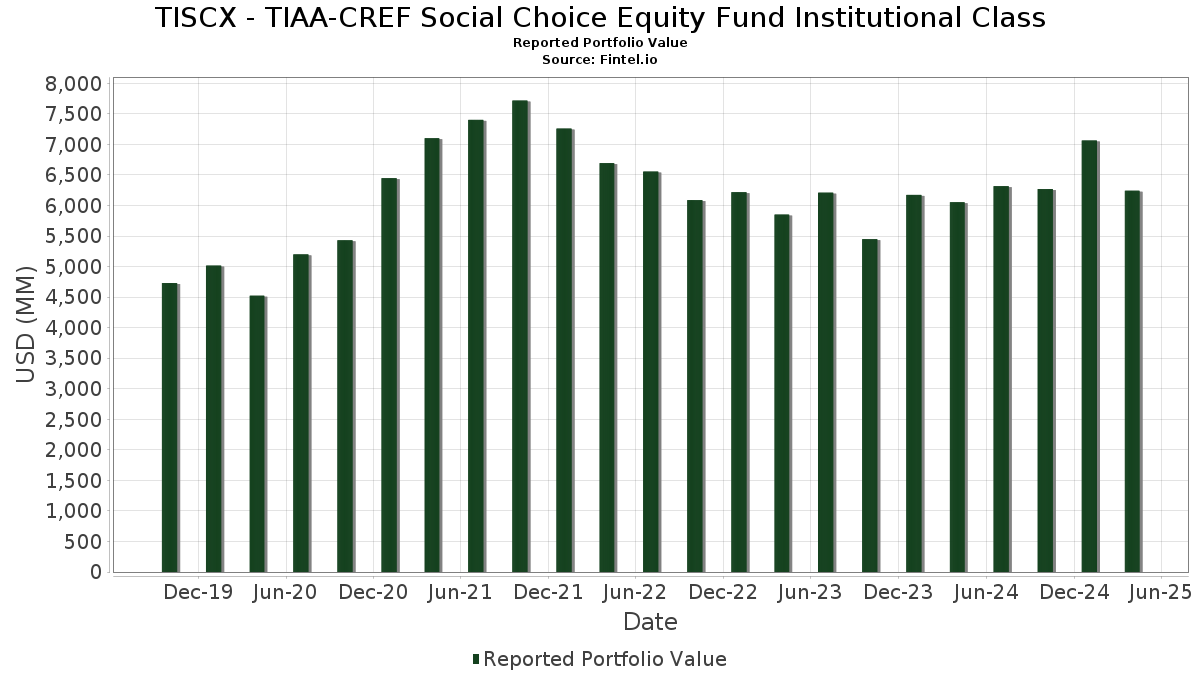
| Nilai Portfolio | $ 6,241,888,492 |
| Kedudukan Semasa | 128 |
Pegangan Terkini, Prestasi, AUM (dari 13F, 13D)
TISCX - TIAA-CREF Social Choice Equity Fund Institutional Class telah mendedahkan 128 jumlah pegangan dalam pemfailan SEC terkini mereka. Nilai portfolio terkini dikira sebagai $ 6,241,888,492 USD. Aset Sebenar Di Bawah Pengurusan (AUM) ialah nilai ini ditambah dengan tunai (yang tidak didedahkan). Pegangan teratas TISCX - TIAA-CREF Social Choice Equity Fund Institutional Class ialah Microsoft Corporation (US:MSFT) , NVIDIA Corporation (US:NVDA) , Eli Lilly and Company (US:LLY) , JPMorgan Chase & Co. (US:JPM) , and Visa Inc. (US:V) . Kedudukan baharu TISCX - TIAA-CREF Social Choice Equity Fund Institutional Class termasuk Costco Wholesale Corporation (US:COST) , DoorDash, Inc. (US:DASH) , Federal Home Loan Bank (FHLB) (US:US313385GD27) , Edison International (US:EIX) , and Union Pacific Corporation (US:UNP) .
Kenaikan Teratas Suku Tahun Ini
Kami menggunakan perubahan dalam peruntukan portfolio kerana ini adalah metrik yang paling bermakna. Perubahan boleh disebabkan oleh perdagangan atau perubahan dalam harga saham.
| Sekuriti | Saham (MM) |
Nilai (MM$) |
Portfolio % | ΔPortfolio % |
|---|---|---|---|---|
| 0.10 | 104.02 | 1.6744 | 1.6744 | |
| 0.20 | 43.20 | 0.6955 | 0.6955 | |
| 1.08 | 50.77 | 0.8173 | 0.6002 | |
| 32.13 | 0.5171 | 0.5171 | ||
| 30.80 | 0.4958 | 0.4958 | ||
| 0.38 | 57.46 | 0.9249 | 0.3570 | |
| 0.46 | 20.85 | 0.3357 | 0.3165 | |
| 0.16 | 139.44 | 2.2446 | 0.2826 | |
| 0.35 | 37.29 | 0.6003 | 0.2747 | |
| 0.33 | 43.70 | 0.7035 | 0.2524 |
Penurunan Teratas Suku Tahun Ini
Kami menggunakan perubahan dalam peruntukan portfolio kerana ini adalah metrik yang paling bermakna. Perubahan boleh disebabkan oleh perdagangan atau perubahan dalam harga saham.
| Sekuriti | Saham (MM) |
Nilai (MM$) |
Portfolio % | ΔPortfolio % |
|---|---|---|---|---|
| 0.00 | 0.00 | -0.8021 | ||
| 0.06 | 8.81 | 0.1418 | -0.5154 | |
| 0.20 | 80.91 | 1.3024 | -0.3708 | |
| 0.10 | 23.06 | 0.3712 | -0.3692 | |
| 0.07 | 6.84 | 0.1101 | -0.2888 | |
| 0.01 | 4.41 | 0.0710 | -0.2733 | |
| 0.61 | 17.03 | 0.2741 | -0.2573 | |
| 0.01 | 0.44 | 0.0071 | -0.2572 | |
| 0.02 | 1.86 | 0.0299 | -0.2391 | |
| 0.04 | 4.75 | 0.0765 | -0.1744 |
13F dan Pemfailan Dana
Borang ini telah difailkan pada 2025-06-26 untuk tempoh pelaporan 2025-04-30. Klik ikon pautan untuk melihat sejarah transaksi penuh.
Tingkatkan untuk membuka data premium dan eksport ke Excel ![]() .
.
| Sekuriti | Jenis | Purata Harga Saham | Saham (MM) |
ΔSaham (%) |
ΔSaham (%) |
Nilai ($MM) |
Portfolio (%) |
ΔPortfolio (%) |
|
|---|---|---|---|---|---|---|---|---|---|
| MSFT / Microsoft Corporation | 1.09 | -5.30 | 429.98 | -9.81 | 6.9217 | 0.1693 | |||
| NVDA / NVIDIA Corporation | 3.62 | -3.68 | 394.47 | -12.62 | 6.3501 | -0.0439 | |||
| LLY / Eli Lilly and Company | 0.16 | -9.19 | 139.44 | 0.65 | 2.2446 | 0.2826 | |||
| JPM / JPMorgan Chase & Co. | 0.55 | -4.89 | 135.46 | -12.96 | 2.1806 | -0.0235 | |||
| V / Visa Inc. | 0.36 | -8.27 | 124.69 | -7.28 | 2.0071 | 0.1026 | |||
| NFLX / Netflix, Inc. | 0.10 | -12.23 | 110.38 | 1.69 | 1.7768 | 0.2396 | |||
| MA / Mastercard Incorporated | 0.19 | -6.70 | 106.58 | -7.94 | 1.7157 | 0.0760 | |||
| COST / Costco Wholesale Corporation | 0.10 | 104.02 | 1.6744 | 1.6744 | |||||
| PG / The Procter & Gamble Company | 0.58 | -8.66 | 93.74 | -10.54 | 1.5089 | 0.0250 | |||
| HD / The Home Depot, Inc. | 0.26 | -0.92 | 92.91 | -13.30 | 1.4957 | -0.0221 | |||
| KO / The Coca-Cola Company | 1.12 | -16.14 | 81.14 | -4.16 | 1.3062 | 0.1072 | |||
| UNH / UnitedHealth Group Incorporated | 0.20 | -9.70 | 80.91 | -31.52 | 1.3024 | -0.3708 | |||
| CRM / Salesforce, Inc. | 0.29 | 6.48 | 78.21 | -16.26 | 1.2589 | -0.0638 | |||
| MCD / McDonald's Corporation | 0.24 | -11.59 | 76.30 | -2.11 | 1.2282 | 0.1243 | |||
| IBM / International Business Machines Corporation | 0.31 | -12.34 | 74.62 | -17.10 | 1.2013 | -0.0736 | |||
| NOW / ServiceNow, Inc. | 0.07 | 2.14 | 71.51 | -4.22 | 1.1512 | 0.0938 | |||
| INTU / Intuit Inc. | 0.11 | -8.54 | 70.63 | -4.59 | 1.1370 | 0.0885 | |||
| BKNG / Booking Holdings Inc. | 0.01 | -8.92 | 70.05 | -1.96 | 1.1276 | 0.1157 | |||
| PGR / The Progressive Corporation | 0.24 | -16.23 | 67.70 | -4.23 | 1.0898 | 0.0886 | |||
| SPGI / S&P Global Inc. | 0.13 | -5.58 | 67.15 | -9.44 | 1.0809 | 0.0308 | |||
| GS / The Goldman Sachs Group, Inc. | 0.12 | -1.00 | 66.80 | -15.35 | 1.0752 | -0.0423 | |||
| PEP / PepsiCo, Inc. | 0.47 | -8.77 | 64.31 | -17.92 | 1.0353 | -0.0744 | |||
| AMGN / Amgen Inc. | 0.22 | -5.40 | 64.26 | -3.58 | 1.0344 | 0.0906 | |||
| TJX / The TJX Companies, Inc. | 0.50 | -12.06 | 64.07 | -9.31 | 1.0315 | 0.0308 | |||
| AXP / American Express Company | 0.24 | 1.25 | 63.92 | -15.03 | 1.0290 | -0.0364 | |||
| VRTX / Vertex Pharmaceuticals Incorporated | 0.12 | -5.73 | 63.66 | 4.03 | 1.0247 | 0.1581 | |||
| ADBE / Adobe Inc. | 0.17 | -2.21 | 63.19 | -16.17 | 1.0173 | -0.0504 | |||
| ETN / Eaton Corporation plc | 0.21 | 12.48 | 63.12 | 1.43 | 1.0162 | 0.1348 | |||
| AMAT / Applied Materials, Inc. | 0.42 | 8.73 | 62.56 | -9.14 | 1.0071 | 0.0319 | |||
| MS / Morgan Stanley | 0.53 | -0.84 | 61.65 | -17.32 | 0.9924 | -0.0636 | |||
| ADP / Automatic Data Processing, Inc. | 0.20 | -10.14 | 61.34 | -10.86 | 0.9874 | 0.0129 | |||
| CAT / Caterpillar Inc. | 0.20 | 2.75 | 60.77 | -14.45 | 0.9783 | -0.0278 | |||
| TXN / Texas Instruments Incorporated | 0.38 | -3.98 | 60.25 | -16.75 | 0.9699 | -0.0551 | |||
| DHR / Danaher Corporation | 0.29 | 0.00 | 58.74 | -10.51 | 0.9455 | 0.0160 | |||
| CDNS / Cadence Design Systems, Inc. | 0.20 | 0.00 | 58.23 | 0.04 | 0.9373 | 0.1130 | |||
| WELL / Welltower Inc. | 0.38 | 28.15 | 57.46 | 43.28 | 0.9249 | 0.3570 | |||
| LRCX / Lam Research Corporation | 0.79 | -1.92 | 56.56 | -13.27 | 0.9104 | -0.0132 | |||
| MMC / Marsh & McLennan Companies, Inc. | 0.25 | -15.59 | 56.45 | -12.25 | 0.9087 | -0.0023 | |||
| EQIX / Equinix, Inc. | 0.06 | 0.00 | 55.90 | -5.79 | 0.8999 | 0.0595 | |||
| VZ / Verizon Communications Inc. | 1.26 | 4.21 | 55.68 | 16.57 | 0.8964 | 0.2198 | |||
| MCO / Moody's Corporation | 0.12 | -2.47 | 55.28 | -11.52 | 0.8899 | 0.0051 | |||
| MCK / McKesson Corporation | 0.08 | -25.02 | 54.76 | -10.14 | 0.8816 | 0.0184 | |||
| ECL / Ecolab Inc. | 0.22 | -9.54 | 54.19 | -9.09 | 0.8723 | 0.0281 | |||
| AXON / Axon Enterprise, Inc. | 0.09 | -5.47 | 53.77 | -11.11 | 0.8655 | 0.0089 | |||
| WDAY / Workday, Inc. | 0.22 | 1.21 | 52.98 | -5.38 | 0.8528 | 0.0599 | |||
| CPRT / Copart, Inc. | 0.87 | -4.72 | 52.89 | 0.37 | 0.8513 | 0.1051 | |||
| ADSK / Autodesk, Inc. | 0.19 | -2.42 | 52.84 | -14.04 | 0.8505 | -0.0200 | |||
| SNPS / Synopsys, Inc. | 0.11 | 0.55 | 52.53 | -12.17 | 0.8455 | -0.0014 | |||
| TTWO / Take-Two Interactive Software, Inc. | 0.22 | -7.85 | 52.04 | 15.90 | 0.8378 | 0.2018 | |||
| DFS / Discover Financial Services | 0.28 | 0.00 | 52.00 | -9.16 | 0.8371 | 0.0264 | |||
| PWR / Quanta Services, Inc. | 0.18 | 25.05 | 51.92 | 18.99 | 0.8358 | 0.2178 | |||
| INTC / Intel Corporation | 2.56 | -11.77 | 51.48 | -8.73 | 0.8287 | 0.0299 | |||
| NXPI / NXP Semiconductors N.V. | 0.28 | 6.38 | 51.46 | -5.99 | 0.8283 | 0.0532 | |||
| ITW / Illinois Tool Works Inc. | 0.21 | 0.00 | 51.23 | -7.43 | 0.8247 | 0.0409 | |||
| EXC / Exelon Corporation | 1.08 | 182.52 | 50.77 | 231.26 | 0.8173 | 0.6002 | |||
| NEM / Newmont Corporation | 0.96 | -28.55 | 50.71 | -11.89 | 0.8163 | 0.0012 | |||
| TRV / The Travelers Companies, Inc. | 0.19 | 0.00 | 50.49 | 7.73 | 0.8128 | 0.1490 | |||
| EA / Electronic Arts Inc. | 0.34 | -1.86 | 49.88 | 15.85 | 0.8029 | 0.1932 | |||
| PLD / Prologis, Inc. | 0.48 | 0.00 | 49.15 | -14.30 | 0.7912 | -0.0210 | |||
| EBAY / eBay Inc. | 0.70 | 0.00 | 47.57 | 1.01 | 0.7658 | 0.0988 | |||
| AMP / Ameriprise Financial, Inc. | 0.10 | 0.00 | 47.43 | -13.31 | 0.7634 | -0.0114 | |||
| KEYS / Keysight Technologies, Inc. | 0.32 | 2.39 | 47.12 | -16.52 | 0.7585 | -0.0409 | |||
| DE / Deere & Company | 0.10 | 0.00 | 47.07 | -2.73 | 0.7577 | 0.0724 | |||
| ZTS / Zoetis Inc. | 0.30 | 0.00 | 46.59 | -8.48 | 0.7501 | 0.0290 | |||
| CMCSA / Comcast Corporation | 1.36 | -26.91 | 46.35 | -25.74 | 0.7462 | -0.1379 | |||
| PYPL / PayPal Holdings, Inc. | 0.70 | -0.55 | 45.80 | -26.08 | 0.7373 | -0.1402 | |||
| OKE / ONEOK, Inc. | 0.55 | 1.34 | 45.53 | -14.32 | 0.7329 | -0.0196 | |||
| HPE / Hewlett Packard Enterprise Company | 2.76 | 23.40 | 44.83 | -5.54 | 0.7216 | 0.0495 | |||
| LYV / Live Nation Entertainment, Inc. | 0.33 | 49.88 | 43.70 | 37.21 | 0.7035 | 0.2524 | |||
| HPQ / HP Inc. | 1.70 | 9.96 | 43.44 | -13.49 | 0.6992 | -0.0118 | |||
| RCL / Royal Caribbean Cruises Ltd. | 0.20 | 43.20 | 0.6955 | 0.6955 | |||||
| BKR / Baker Hughes Company | 1.21 | -0.47 | 42.87 | -23.70 | 0.6902 | -0.1057 | |||
| SBUX / Starbucks Corporation | 0.52 | 0.00 | 41.25 | -25.66 | 0.6641 | -0.1218 | |||
| HCA / HCA Healthcare, Inc. | 0.12 | 0.00 | 40.39 | 4.60 | 0.6501 | 0.1033 | |||
| IR / Ingersoll Rand Inc. | 0.52 | 0.00 | 39.32 | -19.58 | 0.6329 | -0.0595 | |||
| GILD / Gilead Sciences, Inc. | 0.35 | 47.98 | 37.29 | 62.21 | 0.6003 | 0.2747 | |||
| C / Citigroup Inc. | 0.53 | 0.00 | 36.24 | -16.02 | 0.5833 | -0.0278 | |||
| GWW / W.W. Grainger, Inc. | 0.03 | -16.24 | 32.94 | -19.27 | 0.5302 | -0.0476 | |||
| BK / The Bank of New York Mellon Corporation | 0.41 | 0.00 | 32.62 | -6.42 | 0.5250 | 0.0314 | |||
| CBRE / CBRE Group, Inc. | 0.26 | 0.00 | 32.22 | -15.59 | 0.5186 | -0.0219 | |||
| TRMB / Trimble Inc. | 0.52 | -4.92 | 32.14 | -21.18 | 0.5173 | -0.0602 | |||
| CME E-Mini Standard & Poor's 500 Index Future / DE (N/A) | 32.13 | 0.5171 | 0.5171 | ||||||
| BK / The Bank of New York Mellon Corporation - Depositary Receipt (Common Stock) | 30.80 | 0.4958 | 0.4958 | ||||||
| VRSK / Verisk Analytics, Inc. | 0.10 | 0.00 | 29.18 | 3.13 | 0.4698 | 0.0690 | |||
| IDXX / IDEXX Laboratories, Inc. | 0.07 | 0.00 | 29.09 | 2.51 | 0.4682 | 0.0664 | |||
| FSLR / First Solar, Inc. | 0.23 | -5.54 | 28.34 | -29.05 | 0.4563 | -0.1095 | |||
| PH / Parker-Hannifin Corporation | 0.05 | -4.02 | 27.60 | 114.45 | 0.4443 | 0.2513 | |||
| EW / Edwards Lifesciences Corporation | 0.36 | 0.00 | 27.33 | 4.20 | 0.4399 | 0.0685 | |||
| CARR / Carrier Global Corporation | 0.43 | -10.00 | 27.02 | -13.91 | 0.4350 | -0.0095 | |||
| TGT / Target Corporation | 0.25 | 0.00 | 24.64 | -29.88 | 0.3966 | -0.1010 | |||
| WBD / Warner Bros. Discovery, Inc. | 2.78 | 119.49 | 24.10 | 158.56 | 0.3880 | 0.2337 | |||
| ODFL / Old Dominion Freight Line, Inc. | 0.15 | 0.00 | 23.20 | -17.42 | 0.3734 | -0.0244 | |||
| LOW / Lowe's Companies, Inc. | 0.10 | -48.69 | 23.06 | -55.89 | 0.3712 | -0.3692 | |||
| NWSA / News Corporation | 0.80 | -5.75 | 21.57 | -9.10 | 0.3473 | 0.0112 | |||
| TT / Trane Technologies plc | 0.06 | 0.00 | 21.42 | 5.67 | 0.3448 | 0.0577 | |||
| SYF / Synchrony Financial | 0.41 | 61.09 | 21.28 | 21.32 | 0.3426 | 0.0941 | |||
| IP / International Paper Company | 0.46 | 1,778.71 | 20.85 | 1,443.45 | 0.3357 | 0.3165 | |||
| CSX / CSX Corporation | 0.61 | -46.86 | 17.03 | -54.62 | 0.2741 | -0.2573 | |||
| IRM / Iron Mountain Incorporated | 0.18 | -7.84 | 16.10 | -18.64 | 0.2591 | -0.0211 | |||
| EXPE / Expedia Group, Inc. | 0.10 | -14.13 | 15.03 | -21.17 | 0.2419 | -0.0281 | |||
| AMT / American Tower Corporation | 0.06 | 0.00 | 13.62 | 21.88 | 0.2192 | 0.0610 | |||
| BMY / Bristol-Myers Squibb Company | 0.27 | 0.00 | 13.43 | -14.84 | 0.2161 | -0.0072 | |||
| FOXA / Fox Corporation | 0.27 | 0.00 | 13.28 | -2.71 | 0.2137 | 0.0204 | |||
| FOX / Fox Corporation | 0.28 | -5.54 | 12.84 | -10.13 | 0.2066 | 0.0044 | |||
| DECK / Deckers Outdoor Corporation | 0.10 | -17.94 | 11.41 | -48.72 | 0.1837 | -0.1315 | |||
| NDAQ / Nasdaq, Inc. | 0.14 | 0.00 | 10.76 | -7.45 | 0.1733 | 0.0086 | |||
| XYL / Xylem Inc. | 0.08 | 0.00 | 9.66 | -2.80 | 0.1555 | 0.0148 | |||
| COO / The Cooper Companies, Inc. | 0.11 | -35.27 | 9.38 | -45.25 | 0.1510 | -0.0916 | |||
| PAYX / Paychex, Inc. | 0.06 | 0.00 | 9.15 | -0.38 | 0.1474 | 0.0172 | |||
| NULC / Nushares ETF Trust - Nuveen ESG Large-Cap ETF | 0.20 | 0.00 | 8.82 | -5.70 | 0.1420 | 0.0095 | |||
| PTC / PTC Inc. | 0.06 | -76.30 | 8.81 | -81.02 | 0.1418 | -0.5154 | |||
| DASH / DoorDash, Inc. | 0.04 | 8.25 | 0.1329 | 0.1329 | |||||
| PODD / Insulet Corporation | 0.03 | 0.00 | 7.79 | -9.38 | 0.1254 | 0.0037 | |||
| CL / Colgate-Palmolive Company | 0.07 | -77.17 | 6.84 | -75.73 | 0.1101 | -0.2888 | |||
| WST / West Pharmaceutical Services, Inc. | 0.03 | 0.00 | 5.76 | -38.14 | 0.0928 | -0.0392 | |||
| US313385GD27 / Federal Home Loan Bank (FHLB) | 4.98 | 0.0802 | 0.0802 | ||||||
| A / Agilent Technologies, Inc. | 0.04 | -62.23 | 4.75 | -73.18 | 0.0765 | -0.1744 | |||
| POOL / Pool Corporation | 0.02 | 0.00 | 4.71 | -14.84 | 0.0758 | -0.0025 | |||
| APTV / Aptiv PLC | 0.08 | 0.00 | 4.68 | -8.57 | 0.0754 | 0.0028 | |||
| STE / STERIS plc | 0.02 | -65.58 | 4.50 | -64.94 | 0.0724 | -0.1093 | |||
| ANSS / ANSYS, Inc. | 0.01 | -80.25 | 4.41 | -81.86 | 0.0710 | -0.2733 | |||
| EIX / Edison International | 0.08 | 4.40 | 0.0709 | 0.0709 | |||||
| ES / Eversource Energy | 0.03 | -53.82 | 2.02 | -62.03 | 0.0326 | -0.0538 | |||
| HIG / The Hartford Insurance Group, Inc. | 0.02 | -91.12 | 1.86 | -90.23 | 0.0299 | -0.2391 | |||
| UNP / Union Pacific Corporation | 0.00 | 0.49 | 0.0079 | 0.0079 | |||||
| BLL / Ball Corp. | 0.01 | -97.46 | 0.44 | -97.64 | 0.0071 | -0.2572 | |||
| LKQ / LKQ Corporation | 0.00 | 0.00 | 0.00 | 0.0000 | 0.0000 | ||||
| US8575093013 / State Street Navigator Securities Lending Government Money Market Portfolio | 0.00 | -99.97 | 0.00 | -100.00 | 0.0000 | -0.0199 | |||
| FIS / Fidelity National Information Services, Inc. | 0.00 | -100.00 | 0.00 | -100.00 | -0.0167 | ||||
| YUM / Yum! Brands, Inc. | 0.00 | -100.00 | 0.00 | -100.00 | -0.0660 | ||||
| ABNB / Airbnb, Inc. | 0.00 | -100.00 | 0.00 | -100.00 | -0.8021 | ||||
| ORLY / O'Reilly Automotive, Inc. | 0.00 | -100.00 | 0.00 | -100.00 | -0.0624 |