Statistik Asas
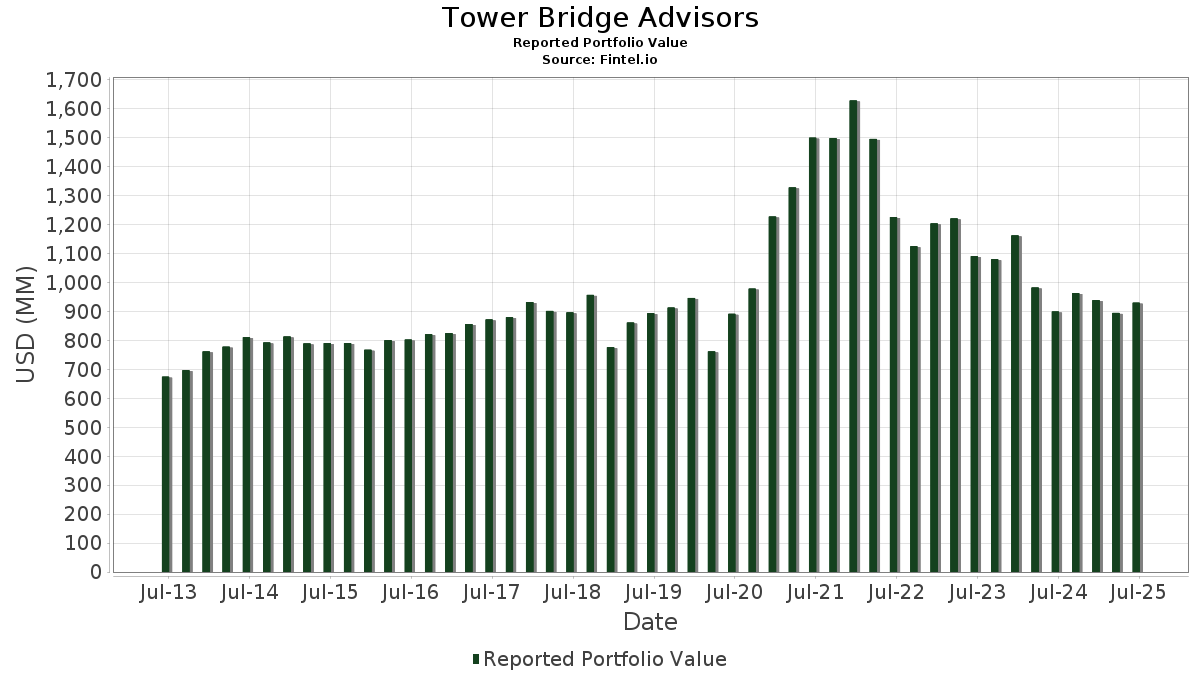
| Nilai Portfolio | $ 930,239,156 |
| Kedudukan Semasa | 191 |
Pegangan Terkini, Prestasi, AUM (dari 13F, 13D)
Tower Bridge Advisors telah mendedahkan 191 jumlah pegangan dalam pemfailan SEC terkini mereka. Nilai portfolio terkini dikira sebagai $ 930,239,156 USD. Aset Sebenar Di Bawah Pengurusan (AUM) ialah nilai ini ditambah dengan tunai (yang tidak didedahkan). Pegangan teratas Tower Bridge Advisors ialah Microsoft Corporation (US:MSFT) , Apple Inc. (US:AAPL) , Broadcom Inc. (US:AVGO) , Oracle Corporation (US:ORCL) , and JPMorgan Chase & Co. (US:JPM) . Kedudukan baharu Tower Bridge Advisors termasuk NiSource Inc. (DE:NOU) , Fidelity National Financial, Inc. (US:FNF) , Agnico Eagle Mines Limited (US:AEM) , Alamos Gold Inc. (DE:1AL) , and Sandoz Group AG - Depositary Receipt (Common Stock) (US:SDZNY) .
Kenaikan Teratas Suku Tahun Ini
Kami menggunakan perubahan dalam peruntukan portfolio kerana ini adalah metrik yang paling bermakna. Perubahan boleh disebabkan oleh perdagangan atau perubahan dalam harga saham.
| Sekuriti | Saham (MM) |
Nilai (MM$) |
Portfolio % | ΔPortfolio % |
|---|---|---|---|---|
| 0.15 | 76.00 | 8.1700 | 1.6020 | |
| 0.14 | 38.58 | 4.1470 | 1.4745 | |
| 0.18 | 38.41 | 4.1289 | 1.2333 | |
| 0.13 | 36.77 | 3.9524 | 0.3625 | |
| 0.05 | 7.46 | 0.8022 | 0.3469 | |
| 0.02 | 14.40 | 1.5483 | 0.3109 | |
| 0.14 | 13.49 | 1.4498 | 0.3008 | |
| 0.04 | 12.98 | 1.3956 | 0.3008 | |
| 0.20 | 34.72 | 3.7323 | 0.2538 | |
| 0.05 | 10.83 | 1.1646 | 0.2067 |
Penurunan Teratas Suku Tahun Ini
Kami menggunakan perubahan dalam peruntukan portfolio kerana ini adalah metrik yang paling bermakna. Perubahan boleh disebabkan oleh perdagangan atau perubahan dalam harga saham.
| Sekuriti | Saham (MM) |
Nilai (MM$) |
Portfolio % | ΔPortfolio % |
|---|---|---|---|---|
| 0.02 | 7.32 | 0.7864 | -0.9164 | |
| 0.22 | 45.70 | 4.9130 | -0.7619 | |
| 0.04 | 7.68 | 0.8255 | -0.4389 | |
| 0.01 | 1.42 | 0.1528 | -0.3963 | |
| 0.04 | 14.49 | 1.5575 | -0.3565 | |
| 0.09 | 12.09 | 1.2992 | -0.3316 | |
| 0.09 | 14.11 | 1.5168 | -0.2718 | |
| 0.07 | 19.59 | 2.1062 | -0.2610 | |
| 0.07 | 10.79 | 1.1600 | -0.2597 | |
| 0.03 | 10.75 | 1.1561 | -0.2426 |
13F dan Pemfailan Dana
Borang ini telah difailkan pada 2025-08-11 untuk tempoh pelaporan 2025-06-30. Klik ikon pautan untuk melihat sejarah transaksi penuh.
Tingkatkan untuk membuka data premium dan eksport ke Excel ![]() .
.
| Sekuriti | Jenis | Purata Harga Saham | Saham (MM) |
ΔSaham (%) |
ΔSaham (%) |
Nilai ($MM) |
Portfolio (%) |
ΔPortfolio (%) |
|
|---|---|---|---|---|---|---|---|---|---|
| MSFT / Microsoft Corporation | 0.15 | -2.42 | 76.00 | 29.29 | 8.1700 | 1.6020 | |||
| AAPL / Apple Inc. | 0.22 | -2.58 | 45.70 | -10.02 | 4.9130 | -0.7619 | |||
| AVGO / Broadcom Inc. | 0.14 | -2.04 | 38.58 | 61.29 | 4.1470 | 1.4745 | |||
| ORCL / Oracle Corporation | 0.18 | -5.22 | 38.41 | 48.21 | 4.1289 | 1.2333 | |||
| JPM / JPMorgan Chase & Co. | 0.13 | -3.18 | 36.77 | 14.43 | 3.9524 | 0.3625 | |||
| GOOG / Alphabet Inc. | 0.20 | -1.78 | 34.72 | 11.52 | 3.7323 | 0.2538 | |||
| V / Visa Inc. | 0.06 | -0.00 | 22.21 | 1.31 | 2.3872 | -0.0620 | |||
| MCD / McDonald's Corporation | 0.07 | -1.13 | 19.59 | -7.52 | 2.1062 | -0.2610 | |||
| ACN / Accenture plc | 0.06 | -2.87 | 18.44 | -6.97 | 1.9821 | -0.2324 | |||
| J / Jacobs Solutions Inc. | 0.12 | -0.92 | 16.05 | 7.74 | 1.7258 | 0.0608 | |||
| RTX / RTX Corporation | 0.11 | -0.80 | 15.57 | 9.36 | 1.6739 | 0.0829 | |||
| AON / Aon plc | 0.04 | -5.39 | 14.49 | -15.42 | 1.5575 | -0.3565 | |||
| META / Meta Platforms, Inc. | 0.02 | 1.56 | 14.40 | 30.06 | 1.5483 | 0.3109 | |||
| JNJ / Johnson & Johnson | 0.09 | -4.30 | 14.11 | -11.86 | 1.5168 | -0.2718 | |||
| LRCX / Lam Research Corporation | 0.14 | -2.05 | 13.49 | 31.15 | 1.4498 | 0.3008 | |||
| ETN / Eaton Corporation plc | 0.04 | 0.89 | 12.98 | 32.50 | 1.3956 | 0.3008 | |||
| PG / The Procter & Gamble Company | 0.08 | -2.55 | 12.90 | -8.90 | 1.3869 | -0.1954 | |||
| TMUS / T-Mobile US, Inc. | 0.05 | 1.51 | 12.72 | -9.32 | 1.3671 | -0.1999 | |||
| PEP / PepsiCo, Inc. | 0.09 | -5.97 | 12.09 | -17.19 | 1.2992 | -0.3316 | |||
| SCHW / The Charles Schwab Corporation | 0.12 | 6.81 | 11.32 | 24.50 | 1.2165 | 0.2009 | |||
| AMZN / Amazon.com, Inc. | 0.05 | 9.59 | 10.83 | 26.36 | 1.1646 | 0.2067 | |||
| IQV / IQVIA Holdings Inc. | 0.07 | -4.99 | 10.79 | -15.07 | 1.1600 | -0.2597 | |||
| TMO / Thermo Fisher Scientific Inc. | 0.03 | 5.44 | 10.75 | -14.08 | 1.1561 | -0.2426 | |||
| XOM / Exxon Mobil Corporation | 0.10 | -2.34 | 10.71 | -11.47 | 1.1511 | -0.2004 | |||
| KO / The Coca-Cola Company | 0.15 | -3.56 | 10.69 | -4.72 | 1.1491 | -0.1045 | |||
| LOW / Lowe's Companies, Inc. | 0.05 | -4.01 | 10.38 | -8.69 | 1.1155 | -0.1542 | |||
| GOOGL / Alphabet Inc. | 0.06 | -1.05 | 10.34 | 12.77 | 1.1110 | 0.0869 | |||
| COST / Costco Wholesale Corporation | 0.01 | -0.59 | 9.61 | 4.05 | 1.0330 | 0.0011 | |||
| TOL / Toll Brothers, Inc. | 0.08 | -3.30 | 9.03 | 4.52 | 0.9710 | 0.0054 | |||
| DHR / Danaher Corporation | 0.05 | -1.96 | 9.03 | -5.53 | 0.9704 | -0.0972 | |||
| NVS / Novartis AG - Depositary Receipt (Common Stock) | 0.07 | -4.61 | 9.00 | 3.55 | 0.9671 | -0.0037 | |||
| MCO / Moody's Corporation | 0.02 | -4.64 | 8.61 | 2.72 | 0.9254 | -0.0111 | |||
| CVX / Chevron Corporation | 0.06 | -2.47 | 8.29 | -16.52 | 0.8909 | -0.2184 | |||
| ICE / Intercontinental Exchange, Inc. | 0.04 | 9.90 | 7.97 | 16.90 | 0.8566 | 0.0949 | |||
| HD / The Home Depot, Inc. | 0.02 | -4.09 | 7.69 | -4.06 | 0.8266 | -0.0688 | |||
| BDX / Becton, Dickinson and Company | 0.04 | -9.76 | 7.68 | -32.14 | 0.8255 | -0.4389 | |||
| NVDA / NVIDIA Corporation | 0.05 | 25.62 | 7.46 | 83.12 | 0.8022 | 0.3469 | |||
| ABBV / AbbVie Inc. | 0.04 | 0.35 | 7.45 | -11.10 | 0.8005 | -0.1354 | |||
| OKE / ONEOK, Inc. | 0.09 | 6.87 | 7.40 | -12.08 | 0.7957 | -0.1449 | |||
| UNH / UnitedHealth Group Incorporated | 0.02 | -19.42 | 7.32 | -52.00 | 0.7864 | -0.9164 | |||
| CME / CME Group Inc. | 0.03 | -2.31 | 7.12 | 1.48 | 0.7655 | -0.0185 | |||
| WSO / Watsco, Inc. | 0.02 | -4.08 | 7.09 | -16.65 | 0.7618 | -0.1883 | |||
| HON / Honeywell International Inc. | 0.03 | 1.84 | 7.06 | 12.00 | 0.7585 | 0.0546 | |||
| NEE / NextEra Energy, Inc. | 0.10 | 16.98 | 6.72 | 14.56 | 0.7223 | 0.0669 | |||
| PH / Parker-Hannifin Corporation | 0.01 | 3.01 | 6.69 | 18.38 | 0.7186 | 0.0876 | |||
| BRK.B / Berkshire Hathaway Inc. | 0.01 | 0.00 | 6.62 | -8.78 | 0.7115 | -0.0993 | |||
| LEN / Lennar Corporation | 0.06 | -5.42 | 6.55 | -8.85 | 0.7039 | -0.0988 | |||
| ABT / Abbott Laboratories | 0.05 | 2.73 | 6.33 | 5.32 | 0.6809 | 0.0090 | |||
| WMT / Walmart Inc. | 0.06 | -5.81 | 6.25 | 4.90 | 0.6719 | 0.0062 | |||
| LHX / L3Harris Technologies, Inc. | 0.02 | 0.93 | 5.44 | 20.95 | 0.5847 | 0.0823 | |||
| AXP / American Express Company | 0.02 | 29.54 | 5.33 | 53.57 | 0.5730 | 0.1852 | |||
| LLY / Eli Lilly and Company | 0.01 | -1.80 | 5.32 | -7.30 | 0.5716 | -0.0694 | |||
| BRO / Brown & Brown, Inc. | 0.05 | 11.71 | 5.07 | -0.45 | 0.5446 | -0.0240 | |||
| UNP / Union Pacific Corporation | 0.02 | 0.95 | 4.90 | -1.69 | 0.5266 | -0.0301 | |||
| ADI / Analog Devices, Inc. | 0.02 | 1.38 | 4.88 | 19.66 | 0.5249 | 0.0690 | |||
| WM / Waste Management, Inc. | 0.02 | 0.00 | 4.79 | -1.16 | 0.5151 | -0.0266 | |||
| SPGI / S&P Global Inc. | 0.01 | 0.34 | 4.56 | 4.13 | 0.4905 | 0.0009 | |||
| ADBE / Adobe Inc. | 0.01 | -7.35 | 4.54 | -6.55 | 0.4879 | -0.0547 | |||
| TPL / Texas Pacific Land Corporation | 0.00 | 0.00 | 4.51 | -20.27 | 0.4846 | -0.1471 | |||
| MDLZ / Mondelez International, Inc. | 0.06 | -2.86 | 4.37 | -3.45 | 0.4698 | -0.0359 | |||
| EPD / Enterprise Products Partners L.P. - Limited Partnership | 0.14 | -1.09 | 4.26 | -10.16 | 0.4581 | -0.0719 | |||
| DE / Deere & Company | 0.01 | -0.61 | 4.14 | 7.66 | 0.4456 | 0.0155 | |||
| AMGN / Amgen Inc. | 0.01 | 6.29 | 4.13 | -4.75 | 0.4437 | -0.0404 | |||
| APD / Air Products and Chemicals, Inc. | 0.01 | -0.97 | 4.02 | -5.28 | 0.4317 | -0.0421 | |||
| CSCO / Cisco Systems, Inc. | 0.06 | -0.39 | 4.01 | 11.97 | 0.4315 | 0.0310 | |||
| AMP / Ameriprise Financial, Inc. | 0.01 | -5.10 | 3.98 | 4.63 | 0.4274 | 0.0028 | |||
| GS.PRA / The Goldman Sachs Group, Inc. - Preferred Stock | 0.18 | -3.99 | 3.90 | -9.46 | 0.4197 | -0.0621 | |||
| IBM / International Business Machines Corporation | 0.01 | -8.27 | 3.60 | 8.77 | 0.3867 | 0.0171 | |||
| MDT / Medtronic plc | 0.04 | -1.00 | 3.57 | -3.98 | 0.3841 | -0.0316 | |||
| TRV / The Travelers Companies, Inc. | 0.01 | 17.39 | 3.52 | 18.75 | 0.3786 | 0.0472 | |||
| BAC / Bank of America Corporation | 0.07 | 0.00 | 3.48 | 13.40 | 0.3740 | 0.0312 | |||
| UPS / United Parcel Service, Inc. | 0.03 | -16.16 | 3.32 | -23.08 | 0.3566 | -0.1251 | |||
| LMT / Lockheed Martin Corporation | 0.01 | 5.18 | 3.18 | 9.05 | 0.3420 | 0.0160 | |||
| WFC / Wells Fargo & Company | 0.04 | 1.04 | 3.11 | 12.74 | 0.3348 | 0.0262 | |||
| MRK / Merck & Co., Inc. | 0.04 | -10.42 | 3.11 | -21.01 | 0.3344 | -0.1056 | |||
| LDOS / Leidos Holdings, Inc. | 0.02 | 0.14 | 2.86 | 17.06 | 0.3076 | 0.0345 | |||
| CDW / CDW Corporation | 0.02 | -2.52 | 2.86 | 8.63 | 0.3071 | 0.0133 | |||
| USB.PRH / U.S. Bancorp - Preferred Stock | 0.14 | -0.67 | 2.82 | -7.50 | 0.3037 | -0.0375 | |||
| ENB / Enbridge Inc. | 0.06 | -8.18 | 2.78 | -6.09 | 0.2985 | -0.0319 | |||
| PNC / The PNC Financial Services Group, Inc. | 0.01 | 1.47 | 2.76 | 7.60 | 0.2969 | 0.0101 | |||
| CSX / CSX Corporation | 0.08 | -4.39 | 2.56 | 5.97 | 0.2748 | 0.0053 | |||
| RHHBY / Roche Holding AG - Depositary Receipt (Common Stock) | 0.06 | -10.71 | 2.50 | -11.71 | 0.2691 | -0.0477 | |||
| QCOM / QUALCOMM Incorporated | 0.02 | -0.16 | 2.48 | 3.51 | 0.2663 | -0.0011 | |||
| MET.PRA / MetLife, Inc. - Preferred Stock | 0.11 | -7.18 | 2.44 | -9.51 | 0.2620 | -0.0389 | |||
| NSC / Norfolk Southern Corporation | 0.01 | 0.42 | 2.14 | 8.54 | 0.2295 | 0.0097 | |||
| CL / Colgate-Palmolive Company | 0.02 | -7.88 | 2.13 | -10.64 | 0.2285 | -0.0373 | |||
| SPG / Simon Property Group, Inc. | 0.01 | 0.00 | 2.00 | -3.19 | 0.2152 | -0.0159 | |||
| BML.PRH / Bank of America Corporation - Preferred Stock | 0.09 | -9.75 | 1.88 | -18.22 | 0.2022 | -0.0548 | |||
| DUK / Duke Energy Corporation | 0.02 | 25.34 | 1.85 | 21.20 | 0.1992 | 0.0285 | |||
| TT / Trane Technologies plc | 0.00 | -0.26 | 1.82 | 29.49 | 0.1955 | 0.0386 | |||
| ADP / Automatic Data Processing, Inc. | 0.01 | -6.27 | 1.73 | -5.37 | 0.1858 | -0.0183 | |||
| NFLX / Netflix, Inc. | 0.00 | 0.00 | 1.73 | 43.59 | 0.1856 | 0.0513 | |||
| AFL / Aflac Incorporated | 0.02 | 0.00 | 1.71 | -5.15 | 0.1843 | -0.0177 | |||
| BMY / Bristol-Myers Squibb Company | 0.03 | -5.45 | 1.59 | -28.24 | 0.1710 | -0.0767 | |||
| CAT / Caterpillar Inc. | 0.00 | -6.83 | 1.55 | 9.68 | 0.1669 | 0.0087 | |||
| STZ / Constellation Brands, Inc. | 0.01 | -0.80 | 1.49 | -12.09 | 0.1602 | -0.0292 | |||
| RJF / Raymond James Financial, Inc. | 0.01 | 0.00 | 1.49 | 10.47 | 0.1600 | 0.0094 | |||
| FDX / FedEx Corporation | 0.01 | -68.98 | 1.42 | -71.08 | 0.1528 | -0.3963 | |||
| PFE / Pfizer Inc. | 0.06 | -11.06 | 1.38 | -14.93 | 0.1483 | -0.0329 | |||
| FANG / Diamondback Energy, Inc. | 0.01 | 7.72 | 1.32 | -7.43 | 0.1419 | -0.0174 | |||
| VMC / Vulcan Materials Company | 0.00 | 0.00 | 1.29 | 11.82 | 0.1384 | 0.0097 | |||
| ALL / The Allstate Corporation | 0.01 | 0.00 | 1.26 | -2.78 | 0.1353 | -0.0094 | |||
| PSX / Phillips 66 | 0.01 | -2.84 | 1.22 | -6.14 | 0.1314 | -0.0141 | |||
| DIS / The Walt Disney Company | 0.01 | 0.00 | 1.09 | 25.72 | 0.1167 | 0.0202 | |||
| SO / The Southern Company | 0.01 | 70.35 | 1.08 | 70.30 | 0.1159 | 0.0451 | |||
| UL / Unilever PLC - Depositary Receipt (Common Stock) | 0.02 | -11.74 | 1.06 | -9.35 | 0.1137 | -0.0167 | |||
| APH / Amphenol Corporation | 0.01 | 145.62 | 0.97 | 270.23 | 0.1043 | 0.0750 | |||
| MPC / Marathon Petroleum Corporation | 0.01 | -14.75 | 0.96 | -2.74 | 0.1032 | -0.0072 | |||
| BLK / BlackRock, Inc. | 0.00 | 0.00 | 0.96 | 10.79 | 0.1028 | 0.0064 | |||
| LIN / Linde plc | 0.00 | 0.00 | 0.95 | 0.74 | 0.1019 | -0.0032 | |||
| NXPI / NXP Semiconductors N.V. | 0.00 | 0.00 | 0.92 | 14.86 | 0.0990 | 0.0095 | |||
| EMR / Emerson Electric Co. | 0.01 | 0.00 | 0.92 | 21.51 | 0.0984 | 0.0143 | |||
| CI / The Cigna Group | 0.00 | -15.49 | 0.90 | -15.08 | 0.0969 | -0.0217 | |||
| CARR / Carrier Global Corporation | 0.01 | -2.26 | 0.89 | 12.87 | 0.0953 | 0.0075 | |||
| VZ / Verizon Communications Inc. | 0.02 | -11.25 | 0.88 | -15.33 | 0.0951 | -0.0217 | |||
| GS / The Goldman Sachs Group, Inc. | 0.00 | 0.00 | 0.87 | 29.45 | 0.0932 | 0.0184 | |||
| AMTM / Amentum Holdings, Inc. | 0.04 | -7.28 | 0.85 | 20.37 | 0.0915 | 0.0124 | |||
| NOU / NiSource Inc. | 0.02 | 0.84 | 0.0906 | 0.0906 | |||||
| MKC / McCormick & Company, Incorporated | 0.01 | 0.00 | 0.84 | -7.91 | 0.0902 | -0.0116 | |||
| PRU / Prudential Financial, Inc. | 0.01 | -9.47 | 0.82 | -12.94 | 0.0884 | -0.0171 | |||
| MS.PRA / Morgan Stanley - Preferred Stock | 0.04 | -5.16 | 0.78 | -11.31 | 0.0844 | -0.0145 | |||
| AMAT / Applied Materials, Inc. | 0.00 | 46.26 | 0.78 | 84.63 | 0.0840 | 0.0367 | |||
| BRK.A / Berkshire Hathaway Inc. | 0.00 | 0.00 | 0.73 | -8.77 | 0.0783 | -0.0109 | |||
| GE / General Electric Company | 0.00 | -5.53 | 0.71 | 21.50 | 0.0766 | 0.0111 | |||
| MRP / Millrose Properties, Inc. | 0.02 | -12.28 | 0.69 | -5.63 | 0.0739 | -0.0075 | |||
| WELL / Welltower Inc. | 0.00 | -8.76 | 0.68 | -8.48 | 0.0731 | -0.0099 | |||
| BML.PRG / Bank of America Corporation - Preferred Stock | 0.03 | 0.00 | 0.62 | -6.61 | 0.0669 | -0.0076 | |||
| ITW / Illinois Tool Works Inc. | 0.00 | 0.00 | 0.62 | -0.32 | 0.0668 | -0.0028 | |||
| ROP / Roper Technologies, Inc. | 0.00 | 0.00 | 0.62 | -3.89 | 0.0664 | -0.0054 | |||
| T / AT&T Inc. | 0.02 | 0.00 | 0.62 | 2.33 | 0.0663 | -0.0010 | |||
| VLTO / Veralto Corporation | 0.01 | -17.39 | 0.59 | -14.53 | 0.0639 | -0.0137 | |||
| PLD / Prologis, Inc. | 0.01 | 0.00 | 0.58 | -6.04 | 0.0620 | -0.0065 | |||
| COP / ConocoPhillips | 0.01 | -17.53 | 0.56 | -29.54 | 0.0606 | -0.0288 | |||
| KMB / Kimberly-Clark Corporation | 0.00 | -22.30 | 0.56 | -29.61 | 0.0604 | -0.0287 | |||
| TXN / Texas Instruments Incorporated | 0.00 | 0.00 | 0.56 | 15.67 | 0.0604 | 0.0061 | |||
| VICTORY PORTFOLIOS II / MUTUAL (903287407) | 0.02 | 0.56 | 0.0000 | ||||||
| MO / Altria Group, Inc. | 0.01 | 0.00 | 0.55 | -2.30 | 0.0595 | -0.0038 | |||
| VWELX / Vanguard Wellington Fund - Vanguard Wellington Fund Investor Shares | 0.01 | 0.00 | 0.55 | 7.83 | 0.0593 | 0.0022 | |||
| CM / Canadian Imperial Bank of Commerce | 0.01 | 0.00 | 0.54 | 25.93 | 0.0580 | 0.0101 | |||
| CMCSA / Comcast Corporation | 0.02 | -10.43 | 0.54 | -13.25 | 0.0577 | -0.0115 | |||
| AEP / American Electric Power Company, Inc. | 0.00 | 0.00 | 0.52 | -4.97 | 0.0555 | -0.0052 | |||
| CB / Chubb Limited | 0.00 | 0.00 | 0.50 | -4.02 | 0.0540 | -0.0045 | |||
| PPG / PPG Industries, Inc. | 0.00 | 0.00 | 0.50 | 3.95 | 0.0538 | 0.0000 | |||
| TFC / Truist Financial Corporation | 0.01 | 0.00 | 0.50 | 4.62 | 0.0536 | 0.0003 | |||
| GS.PRD / The Goldman Sachs Group, Inc. - Preferred Stock | 0.02 | -11.17 | 0.49 | -16.69 | 0.0532 | -0.0131 | |||
| SBUX / Starbucks Corporation | 0.01 | 0.00 | 0.49 | -6.67 | 0.0527 | -0.0059 | |||
| MMC / Marsh & McLennan Companies, Inc. | 0.00 | 0.00 | 0.46 | -10.42 | 0.0499 | -0.0080 | |||
| FNF / Fidelity National Financial, Inc. | 0.01 | 0.45 | 0.0487 | 0.0487 | |||||
| HSY / The Hershey Company | 0.00 | 0.00 | 0.45 | -2.82 | 0.0482 | -0.0034 | |||
| DOV / Dover Corporation | 0.00 | 0.00 | 0.43 | 4.34 | 0.0466 | 0.0002 | |||
| UBER / Uber Technologies, Inc. | 0.00 | 0.00 | 0.42 | 28.13 | 0.0451 | 0.0085 | |||
| CVS / CVS Health Corporation | 0.01 | 0.00 | 0.38 | 1.90 | 0.0404 | -0.0008 | |||
| GL / Globe Life Inc. | 0.00 | 0.00 | 0.37 | -5.82 | 0.0401 | -0.0041 | |||
| TD / The Toronto-Dominion Bank | 0.01 | 0.00 | 0.37 | 22.77 | 0.0400 | 0.0061 | |||
| GEV / GE Vernova Inc. | 0.00 | -3.85 | 0.37 | 66.97 | 0.0398 | 0.0150 | |||
| SWPPX / Schwab Capital Trust - Schwab S&P 500 Index Fund | 0.00 | 0.00 | 0.35 | 11.22 | 0.0373 | 0.0024 | |||
| CHD / Church & Dwight Co., Inc. | 0.00 | 0.00 | 0.35 | -12.88 | 0.0372 | -0.0071 | |||
| OTIS / Otis Worldwide Corporation | 0.00 | 0.00 | 0.33 | -4.06 | 0.0356 | -0.0030 | |||
| DEO / Diageo plc - Depositary Receipt (Common Stock) | 0.00 | -21.96 | 0.33 | -25.06 | 0.0355 | -0.0136 | |||
| DRI / Darden Restaurants, Inc. | 0.00 | 0.00 | 0.33 | 4.82 | 0.0351 | 0.0003 | |||
| MMM / 3M Company | 0.00 | 0.00 | 0.33 | 3.82 | 0.0351 | -0.0001 | |||
| AMERICAN FUNDS WASHIN / MUTUAL (939330825) | 0.00 | 0.32 | 0.0000 | ||||||
| BX / Blackstone Inc. | 0.00 | 0.00 | 0.32 | 7.14 | 0.0339 | 0.0010 | |||
| ABALX / American Balanced Fund - American Balanced Fund Class A | 0.01 | 0.85 | 0.31 | 8.10 | 0.0331 | 0.0013 | |||
| MKC.V / McCormick & Company, Incorporated | 0.00 | 0.00 | 0.30 | -7.93 | 0.0325 | -0.0042 | |||
| AEM / Agnico Eagle Mines Limited | 0.00 | 0.30 | 0.0320 | 0.0320 | |||||
| VWUAX / Vanguard World Fund - Vanguard U.S. Growth Fund Admiral Class | 0.00 | 0.00 | 0.29 | 20.83 | 0.0312 | 0.0044 | |||
| ASML / ASML Holding N.V. - Depositary Receipt (Common Stock) | 0.00 | 0.00 | 0.28 | 21.03 | 0.0303 | 0.0043 | |||
| FRDPX / Franklin Managed Trust - Franklin Rising Dividends Fund Class A | 0.00 | 0.31 | 0.28 | 7.84 | 0.0296 | 0.0010 | |||
| IP / International Paper Company | 0.01 | 0.00 | 0.27 | -12.26 | 0.0293 | -0.0054 | |||
| 1AL / Alamos Gold Inc. | 0.01 | 0.27 | 0.0286 | 0.0286 | |||||
| PHYS / Sprott Physical Gold Trust | 0.01 | 0.25 | 0.0273 | 0.0273 | |||||
| PPL / PPL Corporation | 0.01 | 0.00 | 0.25 | -6.11 | 0.0265 | -0.0028 | |||
| SDZNY / Sandoz Group AG - Depositary Receipt (Common Stock) | 0.00 | 0.24 | 0.0260 | 0.0260 | |||||
| FKGRX / Franklin Custodian Funds - Franklin Growth Fund Class A1 | 0.10 | 5.79 | 0.24 | 7.73 | 0.0255 | 0.0009 | |||
| STT / State Street Corporation | 0.00 | -5.38 | 0.23 | 12.02 | 0.0251 | 0.0019 | |||
| US9219376863 / VANG-S/C VAL-ADM | 0.00 | 0.04 | 0.23 | 5.00 | 0.0249 | 0.0002 | |||
| FSK / FS KKR Capital Corp. | 0.01 | 0.00 | 0.23 | -1.29 | 0.0248 | -0.0012 | |||
| EMA / Emera Incorporated | 0.00 | 0.00 | 0.22 | 9.00 | 0.0235 | 0.0011 | |||
| TSCO / Tractor Supply Company | 0.00 | 0.00 | 0.22 | -4.41 | 0.0234 | -0.0020 | |||
| FXAIX / Fidelity Concord Street Trust - Fidelity 500 Index Fund | 0.00 | 0.22 | 0.0233 | 0.0233 | |||||
| US92203J3086 / Vanguard Total International Bond Index Fund Admiral Shares | 0.01 | 0.63 | 0.21 | 1.92 | 0.0229 | -0.0004 | |||
| VWLTX / Vanguard Municipal Bond Funds - Vanguard Long-Term Tax-Exempt Fund Investor Class | 0.02 | 0.00 | 0.21 | -1.88 | 0.0226 | -0.0013 | |||
| RF / Regions Financial Corporation | 0.01 | 0.21 | 0.0223 | 0.0223 | |||||
| US9219377366 / Vanguard FTSE All-World ex-US Index Fund Admiral Shares | 0.00 | 0.21 | 0.0222 | 0.0222 | |||||
| FMC / FMC Corporation | 0.00 | 0.00 | 0.21 | -0.97 | 0.0221 | -0.0011 | |||
| CWGIX / Capital World Growth & Income Fund - American Funds Capital World Growth & Income Fund Class A | 0.00 | 0.20 | 0.0219 | 0.0219 | |||||
| FDS / FactSet Research Systems Inc. | 0.00 | 0.00 | 0.20 | -1.47 | 0.0216 | -0.0012 | |||
| ZETA / Zeta Global Holdings Corp. | 0.01 | 0.00 | 0.20 | 14.71 | 0.0210 | 0.0019 | |||
| VANGUARD PA TAX FREE / MUTUAL (92204L302) | 0.02 | 0.18 | 0.0000 | ||||||
| VANGUARD INT-TERM INV / MUTUAL (922031810) | 0.02 | 0.15 | 0.0000 | ||||||
| PDRDX / Principal Funds Inc - Principal Diversified Real Asset Fund Institutional Class | 0.00 | -100.00 | 0.00 | -100.00 | -0.0253 | ||||
| US67065Q7723 / NUVEEN HIGH YLD MUNI BND- | 0.00 | -100.00 | 0.00 | 0.0000 | |||||
| FKINX / Franklin Custodian Funds - Franklin Income Fund Class A1 | 0.00 | -100.00 | 0.00 | 0.0000 | |||||
| TGEIX / TCW Funds Inc - TCW Emerging Markets Income Fund I Class | 0.00 | -100.00 | 0.00 | 0.0000 | |||||
| NEW YORK LIFE INVT / MUTUAL (56064B530) | 0.00 | -100.00 | 0.00 | 0.0000 | |||||
| LBNDX / Lord Abbett Bond Debenture Fund Inc - Lord Abbett Bond Debenture Fund Inc Class A | 0.00 | -100.00 | 0.00 | 0.0000 | |||||
| UDR / UDR, Inc. | 0.00 | -100.00 | 0.00 | 0.0000 | |||||
| US00141W7039 / INV OPP RCHSTR H/Y MUNI-Y | 0.00 | -100.00 | 0.00 | 0.0000 | |||||
| VWNEX / Vanguard Windsor Funds - Vanguard Windsor Admiral Class | 0.00 | -100.00 | 0.00 | 0.0000 | |||||
| US6707004007 / Nuveen Preferred Securities Fund | 0.00 | -100.00 | 0.00 | 0.0000 | |||||
| D / Dominion Energy, Inc. | 0.00 | -100.00 | 0.00 | 0.0000 | |||||
| BRANDYWINE GLOBAL / MUTUAL (52472T775) | 0.00 | -100.00 | 0.00 | 0.0000 | |||||
| VPMAX / Vanguard Chester Funds - Vanguard PRIMECAP Fund Admiral Class | 0.00 | -100.00 | 0.00 | 0.0000 | |||||
| LYB / LyondellBasell Industries N.V. | 0.00 | -100.00 | 0.00 | 0.0000 | |||||
| US67065Q6998 / NUVEEN SHORT DUR H/Y MUNI | 0.00 | -100.00 | 0.00 | 0.0000 | |||||
| GIS / General Mills, Inc. | 0.00 | -100.00 | 0.00 | 0.0000 |