Statistik Asas
| Nilai Portfolio | $ 1,011,946,000 |
| Kedudukan Semasa | 83 |
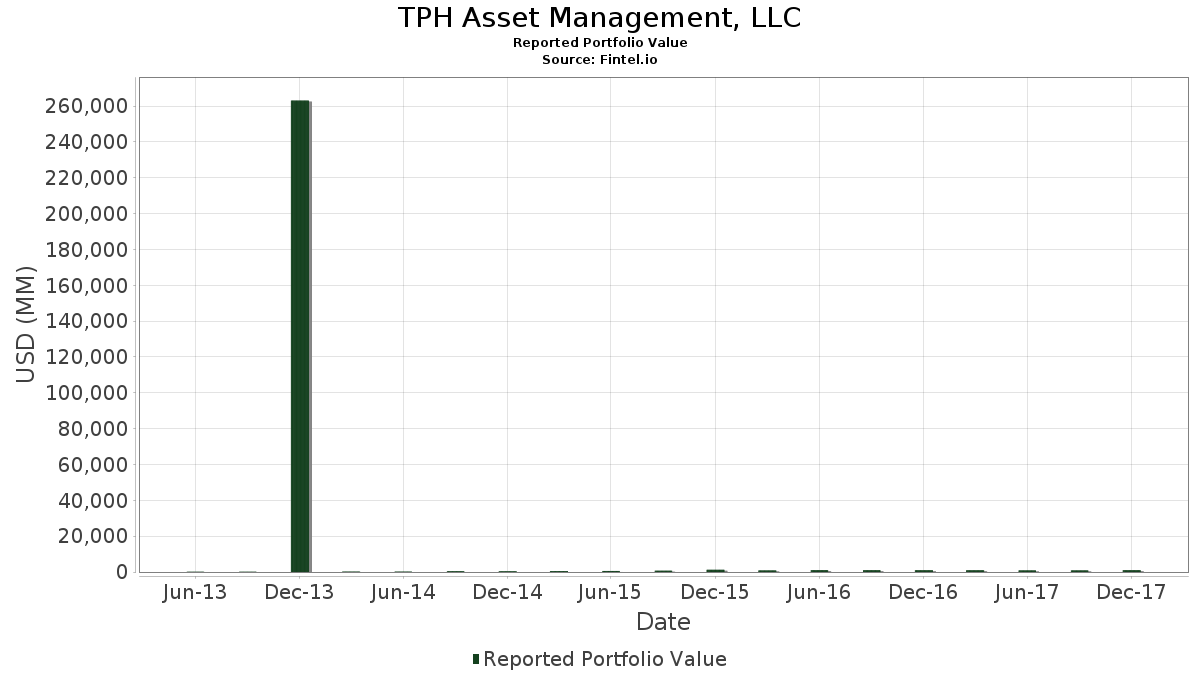
Pegangan Terkini, Prestasi, AUM (dari 13F, 13D)
TPH Asset Management, LLC telah mendedahkan 83 jumlah pegangan dalam pemfailan SEC terkini mereka. Nilai portfolio terkini dikira sebagai $ 1,011,946,000 USD. Aset Sebenar Di Bawah Pengurusan (AUM) ialah nilai ini ditambah dengan tunai (yang tidak didedahkan). Pegangan teratas TPH Asset Management, LLC ialah Halliburton Company (US:HAL) , Diamondback Energy, Inc. (US:FANG) , EOG Resources, Inc. (US:EOG) , Continental Resources Inc (OKLA) (US:CLR) , and Cheniere Energy, Inc. (US:LNG) . Kedudukan baharu TPH Asset Management, LLC termasuk Antero Midstream Corporation (US:AM) , Alta Mesa Resources (US:US02133L1098) , Andeavor Corp. (US:ANDV) , Marathon Oil Corporation (US:MRO) , and Evoqua Water Technologies Corp (US:AQUA) .
Kenaikan Teratas Suku Tahun Ini
Kami menggunakan perubahan dalam peruntukan portfolio kerana ini adalah metrik yang paling bermakna. Perubahan boleh disebabkan oleh perdagangan atau perubahan dalam harga saham.
| Sekuriti | Saham (MM) |
Nilai (MM$) |
Portfolio % | ΔPortfolio % |
|---|---|---|---|---|
| 0.88 | 46.69 | 4.6134 | 3.4503 | |
| 0.38 | 48.51 | 4.7938 | 1.7183 | |
| 0.49 | 14.56 | 1.4385 | 1.4385 | |
| 0.29 | 12.73 | 1.2576 | 1.2576 | |
| 0.45 | 12.20 | 1.2053 | 1.2053 | |
| 1.51 | 31.18 | 3.0815 | 1.1137 | |
| 0.54 | 11.15 | 1.1019 | 1.1019 | |
| 9.40 | 39.18 | 3.8719 | 1.0901 | |
| 1.01 | 49.18 | 4.8596 | 0.9362 | |
| 0.44 | 47.05 | 4.6493 | 0.8706 |
Penurunan Teratas Suku Tahun Ini
Kami menggunakan perubahan dalam peruntukan portfolio kerana ini adalah metrik yang paling bermakna. Perubahan boleh disebabkan oleh perdagangan atau perubahan dalam harga saham.
| Sekuriti | Saham (MM) |
Nilai (MM$) |
Portfolio % | ΔPortfolio % |
|---|---|---|---|---|
| 0.11 | 3.13 | 0.3096 | -1.5070 | |
| 0.02 | 3.07 | 0.3033 | -1.4783 | |
| 1.26 | 22.71 | 2.2444 | -1.2823 | |
| 1.35 | 17.46 | 1.7259 | -1.0791 | |
| 1.04 | 10.99 | 1.0862 | -1.0645 | |
| 0.24 | 12.98 | 1.2824 | -0.8472 | |
| 0.65 | 24.30 | 2.4013 | -0.7202 | |
| 0.31 | 15.07 | 1.4890 | -0.6755 | |
| 0.10 | 3.16 | 0.3127 | -0.6370 | |
| 0.08 | 7.01 | 0.6923 | -0.4456 |
13F dan Pemfailan Dana
Borang ini telah difailkan pada 2018-02-14 untuk tempoh pelaporan 2017-12-31. Klik ikon pautan untuk melihat sejarah transaksi penuh.
Tingkatkan untuk membuka data premium dan eksport ke Excel ![]() .
.
| Sekuriti | Jenis | Purata Harga Saham | Saham (MM) |
ΔSaham (%) |
ΔSaham (%) |
Nilai ($MM) |
Portfolio (%) |
ΔPortfolio (%) |
|
|---|---|---|---|---|---|---|---|---|---|
| HAL / Halliburton Company | 1.01 | 32.26 | 49.18 | 40.42 | 4.8596 | 0.9362 | |||
| FANG / Diamondback Energy, Inc. | 0.38 | 37.11 | 48.51 | 76.71 | 4.7938 | 1.7183 | |||
| EOG / EOG Resources, Inc. | 0.44 | 25.05 | 47.05 | 39.49 | 4.6493 | 0.8706 | |||
| CLR / Continental Resources Inc (OKLA) | 0.88 | 227.76 | 46.69 | 349.67 | 4.6134 | 3.4503 | |||
| LNG / Cheniere Energy, Inc. | 0.75 | 11.06 | 40.14 | 32.76 | 3.9669 | 0.5795 | |||
| CVX / Chevron Corporation | 0.32 | 25.05 | 39.64 | 33.23 | 3.9172 | 0.5841 | |||
| WFT / Weatherford International plc | 9.40 | 73.31 | 39.18 | 57.79 | 3.8719 | 1.0901 | |||
| OAS / Oasis Petroleum Inc. - New | 3.79 | 23.97 | 31.90 | 14.32 | 3.1524 | 0.0263 | |||
| PAA / Plains All American Pipeline, L.P. - Limited Partnership | 1.51 | 82.26 | 31.18 | 77.53 | 3.0815 | 1.1137 | |||
| EPD / Enterprise Products Partners L.P. - Limited Partnership | 1.14 | 6.84 | 30.14 | 8.64 | 2.9787 | -0.1296 | |||
| FET / Forum Energy Technologies, Inc. | 1.90 | 44.56 | 29.54 | 41.38 | 2.9189 | 0.5783 | |||
| US98212B1035 / WPX Energy, Inc. | 2.08 | 19.12 | 29.24 | 45.73 | 2.8899 | 0.6418 | |||
| FMSA / Fairmount Santrol Holdings Inc. | 4.98 | 18.08 | 26.04 | 29.19 | 2.5728 | 0.3152 | |||
| AM / Antero Midstream Corporation | 1.25 | 24.70 | 2.4404 | -0.4283 | |||||
| WES / Western Midstream Partners, LP - Limited Partnership | 0.65 | -3.35 | 24.30 | -12.79 | 2.4013 | -0.7202 | |||
| TRGP / Targa Resources Corp. | 0.50 | 3.25 | 24.23 | 5.70 | 2.3944 | -0.1738 | |||
| WPZ / Access Midstream Partners, L.P | 0.59 | 35.49 | 23.01 | 35.07 | 2.2738 | 0.3654 | |||
| KMI / Kinder Morgan, Inc. | 1.26 | -23.42 | 22.71 | -27.85 | 2.2444 | -1.2823 | |||
| / Energy Transfer Operating, L.P. Series E Fixed-to-Floating Rate Cumulative Redeemable Perpetual Pref | 1.21 | 4.21 | 21.62 | 2.10 | 2.1366 | -0.2359 | |||
| 30064K105 / Exacttarget, Inc. | 1.17 | 58.99 | 20.22 | 57.89 | 1.9977 | 0.5633 | |||
| RDS.A / Shell Plc - ADR (Representing Ordinary Shares - Class A) | 0.30 | 72.64 | 19.72 | 90.11 | 1.9487 | 0.7866 | |||
| US20605P1012 / Concho Resources, Inc. | 0.12 | 62.30 | 18.34 | 85.08 | 1.8123 | 0.7023 | |||
| BWP / Boardwalk Pipeline Partners L.P | 1.35 | -20.58 | 17.46 | -30.25 | 1.7259 | -1.0791 | |||
| NGL / NGL Energy Partners LP - Limited Partnership | 1.19 | -16.27 | 16.73 | 1.86 | 1.6536 | -0.1869 | |||
| MPLX / MPLX LP - Limited Partnership | 0.44 | 4.80 | 15.61 | 6.18 | 1.5430 | -0.1044 | |||
| TRP / TC Energy Corporation | 0.31 | -20.75 | 15.07 | -22.01 | 1.4890 | -0.6755 | |||
| SHLX / Shell Midstream Partners L.P. - Unit | 0.49 | -42.23 | 14.56 | -38.12 | 1.4385 | 1.4385 | |||
| US0325111070 / Anadarko Petroleum Corp. | 0.24 | -37.83 | 12.98 | -31.73 | 1.2824 | -0.8472 | |||
| VLP / Valero Energy Partners LP | 0.29 | -15.67 | 12.73 | -14.16 | 1.2576 | 1.2576 | |||
| OMP / Oasis Midstream Partners LP - Unit | 0.72 | 64.88 | 12.61 | 69.55 | 1.2462 | 0.4129 | |||
| EQGP / EQT GP Holdings LP | 0.45 | 12.20 | 1.2053 | 1.2053 | |||||
| GLNG / Golar LNG Limited | 0.38 | 5.53 | 11.41 | 39.14 | 1.1272 | 0.2088 | |||
| OKE / ONEOK, Inc. | 0.21 | 73.09 | 11.24 | 66.97 | 1.1104 | 0.3565 | |||
| SMLP / Summit Midstream Partners, LP - Limited Partnership | 0.54 | -8.65 | 11.15 | -6.36 | 1.1019 | 1.1019 | |||
| WTTR / Select Water Solutions, Inc. | 0.61 | -2.31 | 11.11 | 11.92 | 1.0976 | -0.0142 | |||
| LPI / Laredo Petroleum Inc. | 1.04 | -30.22 | 10.99 | -42.74 | 1.0862 | -1.0645 | |||
| US65506L1052 / Noble Midstream Partners LP | 0.21 | 29.21 | 10.27 | 24.56 | 1.0150 | 0.0912 | |||
| SLCA / U.S. Silica Holdings, Inc. | 0.30 | -5.30 | 9.81 | -0.76 | 0.9691 | -0.1380 | |||
| ENBL / Enable Midstream Partners LP - Unit | 0.59 | -22.28 | 8.39 | -30.84 | 0.8293 | 0.8293 | |||
| EQT / EQT Corporation | 0.15 | 135.19 | 8.38 | 105.22 | 0.8278 | 0.3705 | |||
| XOM / Exxon Mobil Corporation | 0.08 | -32.39 | 7.01 | -31.02 | 0.6923 | -0.4456 | |||
| USAC / USA Compression Partners, LP - Limited Partnership | 0.39 | 25.25 | 6.51 | 23.89 | 0.6431 | 0.0546 | |||
| ANDV / Andeavor Corp. | 0.13 | 567.60 | 6.15 | 198.93 | 0.6079 | 0.3774 | |||
| COP / ConocoPhillips | 0.10 | -38.81 | 5.67 | -32.90 | 0.5598 | -0.3859 | |||
| PTEN / Patterson-UTI Energy, Inc. | 0.22 | 4.97 | 0.4915 | 0.4915 | |||||
| SLB / Schlumberger Limited | 0.06 | -38.17 | 4.35 | -40.27 | 0.4297 | -0.3859 | |||
| AY / Atlantica Sustainable Infrastructure plc | 0.20 | 26.30 | 4.30 | 35.98 | 0.4246 | 0.0706 | |||
| US26885B1008 / EQT Midstream Partners LP | 0.06 | 2.26 | 4.04 | -0.30 | 0.3992 | -0.0547 | |||
| PSX / Phillips 66 | 0.03 | 3.49 | 0.3452 | 0.3452 | |||||
| WMB / The Williams Companies, Inc. | 0.10 | -63.26 | 3.16 | -62.68 | 0.3127 | -0.6370 | |||
| AM / Antero Midstream Corporation | 0.11 | -79.02 | 3.13 | -80.68 | 0.3096 | -1.5070 | |||
| NEXT / NextDecade Corporation | 0.37 | 94.86 | 3.09 | 60.73 | 0.3057 | 0.0901 | |||
| PXD / Pioneer Natural Resources Company | 0.02 | -83.53 | 3.07 | -80.70 | 0.3033 | -1.4783 | |||
| GXP / Great Plains Energy, Inc. | 0.09 | 3.07 | 2.94 | 9.65 | 0.2908 | 0.2908 | |||
| DVN / Devon Energy Corporation | 0.07 | 28.77 | 2.79 | 45.23 | 0.2754 | 0.0604 | |||
| MPC / Marathon Petroleum Corporation | 0.04 | -22.94 | 2.76 | -9.33 | 0.2728 | -0.0683 | |||
| EXC / Exelon Corporation | 0.06 | 50.57 | 2.55 | 57.53 | 0.2522 | 0.0707 | |||
| RMP / Rice Midstream Partners LP | 0.12 | -16.99 | 2.50 | -14.90 | 0.2467 | 0.2467 | |||
| OXY / Occidental Petroleum Corporation | 0.03 | 9.23 | 2.28 | 25.32 | 0.2250 | 0.2250 | |||
| CAFD / 8point3 Energy Partners LP | 0.14 | 109.91 | 2.08 | 112.49 | 0.2051 | 0.0957 | |||
| ALE / ALLETE, Inc. | 0.03 | 8.74 | 1.97 | 4.63 | 0.1942 | 0.1942 | |||
| PEGI / Pattern Energy Group Inc. | 0.09 | 126.17 | 1.87 | 101.73 | 0.1846 | 0.1846 | |||
| NEE / NextEra Energy, Inc. | 0.01 | -3.01 | 1.78 | 3.37 | 0.1756 | -0.0170 | |||
| US02133L1098 / Alta Mesa Resources | 0.16 | 1.59 | 0.1576 | 0.1576 | |||||
| ATO / Atmos Energy Corporation | 0.02 | 9.98 | 1.50 | 12.69 | 0.1483 | -0.0009 | |||
| AWK / American Water Works Company, Inc. | 0.02 | -62.46 | 1.48 | -57.54 | 0.1466 | -0.2449 | |||
| XEC / Cimarex Energy Co. | 0.01 | -14.16 | 1.42 | -7.86 | 0.1402 | -0.0323 | |||
| BKH / Black Hills Corporation | 0.02 | 35.99 | 1.34 | 18.71 | 0.1323 | 0.1323 | |||
| SRE / Sempra | 0.01 | -39.84 | 1.32 | -43.66 | 0.1309 | -0.1326 | |||
| COG / Cabot Oil & Gas Corp. | 0.04 | -71.90 | 1.29 | -69.96 | 0.1271 | -0.3525 | |||
| ANDV / Andeavor Corp. | 0.01 | 1.20 | 0.1183 | -0.1123 | |||||
| WTRG / Essential Utilities, Inc. | 0.03 | -39.16 | 1.16 | -28.06 | 0.1142 | 0.1142 | |||
| MRO / Marathon Oil Corporation | 0.07 | 1.10 | 0.1088 | 0.1088 | |||||
| NEP / XPLR Infrastructure, LP - Limited Partnership | 0.03 | -41.08 | 1.09 | -36.97 | 0.1078 | 0.1078 | |||
| AQUA / Evoqua Water Technologies Corp | 0.04 | 1.00 | 0.0986 | 0.0986 | |||||
| NYLD.A / NRG Yield, Inc | 0.04 | 0.72 | 0.0711 | 0.0711 | |||||
| XYL / Xylem Inc. | 0.01 | 0.70 | 0.0695 | 0.0695 | |||||
| PCG / PG&E Corporation | 0.01 | -53.03 | 0.62 | -69.09 | 0.0609 | -0.1624 | |||
| FTI / TechnipFMC plc | 0.02 | 0.52 | 0.0509 | 0.0509 | |||||
| US7018771029 / Parsley Energy, Inc. | 0.02 | -23.39 | 0.46 | -14.29 | 0.0457 | 0.0457 | |||
| / Gulfport Energy Corp. | 0.03 | 0.37 | 0.0365 | 0.0365 | |||||
| CHK / Chesapeake Energy Corporation | 0.09 | -14.94 | 0.36 | -21.67 | 0.0361 | -0.0161 | |||
| ECA / EnCana Corp. | 0.02 | -14.18 | 0.29 | -2.96 | 0.0292 | 0.0292 | |||
| US6550441058 / Noble Energy, Inc. | 0.00 | -100.00 | 0.00 | -100.00 | -0.2560 | ||||
| XLE / The Select Sector SPDR Trust - The Energy Select Sector SPDR Fund | 0.00 | -100.00 | 0.00 | -100.00 | 0.0000 | 0.0000 | |||
| BKR / Baker Hughes Company | 0.00 | -100.00 | 0.00 | -100.00 | -0.1259 | ||||
| ENLK / EnLink Midstream Partners, LP | 0.00 | -100.00 | 0.00 | -100.00 | 0.0000 | 0.0000 | |||
| SCU / Sculptor Capital Management Inc - Class A | 0.00 | -100.00 | 0.00 | -100.00 | -0.2401 | ||||
| AR / Antero Resources Corporation | 0.00 | -100.00 | 0.00 | -100.00 | 0.0000 | 0.0000 | |||
| NFX / Newfield Exploration Company | 0.00 | -100.00 | 0.00 | -100.00 | -0.0251 | ||||
| AEP / American Electric Power Company, Inc. | 0.00 | -100.00 | 0.00 | -100.00 | -0.0599 | ||||
| WNRL / Western Refining Logistics, LP | 0.00 | -100.00 | 0.00 | -100.00 | 0.0000 | 0.0000 | |||
| US7625941098 / Rice Energy Inc. | 0.00 | -100.00 | 0.00 | -100.00 | 0.0000 | 0.0000 | |||
| STO / Statoil ASA | 0.00 | -100.00 | 0.00 | -100.00 | 0.0000 | 0.0000 |