Statistik Asas
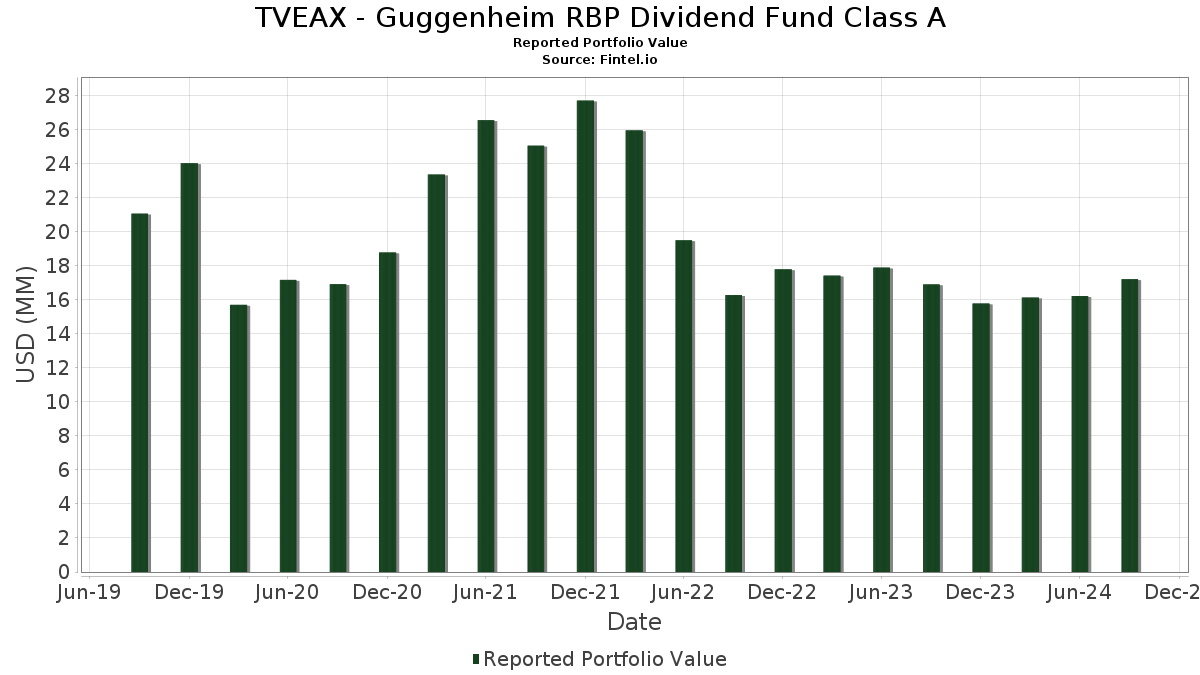
| Nilai Portfolio | $ 17,202,895 |
| Kedudukan Semasa | 109 |
Pegangan Terkini, Prestasi, AUM (dari 13F, 13D)
TVEAX - Guggenheim RBP Dividend Fund Class A telah mendedahkan 109 jumlah pegangan dalam pemfailan SEC terkini mereka. Nilai portfolio terkini dikira sebagai $ 17,202,895 USD. Aset Sebenar Di Bawah Pengurusan (AUM) ialah nilai ini ditambah dengan tunai (yang tidak didedahkan). Pegangan teratas TVEAX - Guggenheim RBP Dividend Fund Class A ialah Microsoft Corporation (US:MSFT) , NVIDIA Corporation (US:NVDA) , Apple Inc. (US:AAPL) , Meta Platforms, Inc. (US:META) , and Alphabet Inc. (US:GOOG) . Kedudukan baharu TVEAX - Guggenheim RBP Dividend Fund Class A termasuk Alphabet Inc. (US:GOOG) , Dover Corporation (US:DOV) , Hexcel Corporation (US:HXL) , Donaldson Company, Inc. (US:DCI) , and EastGroup Properties, Inc. (US:EGP) .
Kenaikan Teratas Suku Tahun Ini
Kami menggunakan perubahan dalam peruntukan portfolio kerana ini adalah metrik yang paling bermakna. Perubahan boleh disebabkan oleh perdagangan atau perubahan dalam harga saham.
| Sekuriti | Saham (MM) |
Nilai (MM$) |
Portfolio % | ΔPortfolio % |
|---|---|---|---|---|
| 0.00 | 0.41 | 2.3445 | 2.3445 | |
| 0.00 | 0.25 | 1.4509 | 1.2993 | |
| 0.00 | 0.19 | 1.0847 | 1.0847 | |
| 0.01 | 0.18 | 1.0629 | 1.0629 | |
| 0.00 | 0.23 | 1.3437 | 1.0132 | |
| 0.00 | 0.13 | 0.7593 | 0.7593 | |
| 0.00 | 0.13 | 0.7220 | 0.7220 | |
| 0.00 | 0.19 | 1.0727 | 0.5783 | |
| 0.02 | 0.17 | 0.9811 | 0.5709 | |
| 0.00 | 0.15 | 0.8549 | 0.5540 |
Penurunan Teratas Suku Tahun Ini
Kami menggunakan perubahan dalam peruntukan portfolio kerana ini adalah metrik yang paling bermakna. Perubahan boleh disebabkan oleh perdagangan atau perubahan dalam harga saham.
| Sekuriti | Saham (MM) |
Nilai (MM$) |
Portfolio % | ΔPortfolio % |
|---|---|---|---|---|
| 0.00 | 0.01 | 0.0303 | -1.0110 | |
| 0.00 | 0.02 | 0.1109 | -1.0007 | |
| 0.00 | 1.21 | 6.9903 | -0.7714 | |
| 0.00 | 0.16 | 0.9063 | -0.7208 | |
| 0.01 | 1.11 | 6.4296 | -0.7119 | |
| 0.00 | 0.02 | 0.1347 | -0.6641 | |
| 0.00 | 0.07 | 0.3989 | -0.6233 | |
| 0.00 | 0.00 | -0.3193 | ||
| 0.00 | 0.00 | -0.3073 | ||
| 0.00 | 0.00 | -0.2683 |
13F dan Pemfailan Dana
Borang ini telah difailkan pada 2024-11-29 untuk tempoh pelaporan 2024-09-30. Klik ikon pautan untuk melihat sejarah transaksi penuh.
Tingkatkan untuk membuka data premium dan eksport ke Excel ![]() .
.
| Sekuriti | Jenis | Purata Harga Saham | Saham (MM) |
ΔSaham (%) |
ΔSaham (%) |
Nilai ($MM) |
Portfolio (%) |
ΔPortfolio (%) |
|
|---|---|---|---|---|---|---|---|---|---|
| MSFT / Microsoft Corporation | 0.00 | -0.53 | 1.21 | -4.27 | 6.9903 | -0.7714 | |||
| NVDA / NVIDIA Corporation | 0.01 | -2.61 | 1.11 | -4.30 | 6.4296 | -0.7119 | |||
| AAPL / Apple Inc. | 0.00 | 4.06 | 0.98 | 15.09 | 5.6845 | 0.4340 | |||
| META / Meta Platforms, Inc. | 0.00 | -2.57 | 0.59 | 10.80 | 3.3774 | 0.1306 | |||
| GOOG / Alphabet Inc. | 0.00 | 0.41 | 2.3445 | 2.3445 | |||||
| AVGO / Broadcom Inc. | 0.00 | 872.80 | 0.40 | 4.70 | 2.3153 | -0.0401 | |||
| LLY / Eli Lilly and Company | 0.00 | -2.68 | 0.39 | -4.69 | 2.2299 | -0.2599 | |||
| MA / Mastercard Incorporated | 0.00 | -4.87 | 0.30 | 6.43 | 1.7247 | 0.0023 | |||
| WMT / Walmart Inc. | 0.00 | -9.11 | 0.28 | 8.53 | 1.6190 | 0.0309 | |||
| ORCL / Oracle Corporation | 0.00 | 20.16 | 0.26 | 45.30 | 1.5189 | 0.4051 | |||
| XOM / Exxon Mobil Corporation | 0.00 | 883.49 | 0.25 | 904.00 | 1.4509 | 1.2993 | |||
| COST / Costco Wholesale Corporation | 0.00 | -2.21 | 0.24 | 1.73 | 1.3614 | -0.0579 | |||
| KO / The Coca-Cola Company | 0.00 | 282.86 | 0.23 | 337.74 | 1.3437 | 1.0132 | |||
| MRK / Merck & Co., Inc. | 0.00 | -1.89 | 0.23 | -10.16 | 1.3302 | -0.2414 | |||
| NEE / NextEra Energy, Inc. | 0.00 | -3.78 | 0.22 | 15.10 | 1.2795 | 0.0950 | |||
| CEG / Constellation Energy Corporation | 0.00 | -2.11 | 0.22 | 26.90 | 1.2549 | 0.2050 | |||
| INTU / Intuit Inc. | 0.00 | -5.23 | 0.21 | -10.50 | 1.2333 | -0.2312 | |||
| TJX / The TJX Companies, Inc. | 0.00 | -6.66 | 0.21 | -0.49 | 1.1882 | -0.0797 | |||
| ABT / Abbott Laboratories | 0.00 | -2.65 | 0.21 | 6.77 | 1.1860 | 0.0054 | |||
| ADP / Automatic Data Processing, Inc. | 0.00 | -5.32 | 0.20 | 9.78 | 1.1662 | 0.0366 | |||
| ACN / Accenture plc | 0.00 | -9.84 | 0.20 | 4.79 | 1.1407 | -0.0140 | |||
| ICE / Intercontinental Exchange, Inc. | 0.00 | -6.69 | 0.19 | 9.60 | 1.1249 | 0.0325 | |||
| EOG / EOG Resources, Inc. | 0.00 | 1.16 | 0.19 | -1.03 | 1.1156 | -0.0851 | |||
| LVS / Las Vegas Sands Corp. | 0.00 | -2.11 | 0.19 | 11.83 | 1.0927 | 0.0494 | |||
| TFC / Truist Financial Corporation | 0.00 | 0.19 | 1.0847 | 1.0847 | |||||
| WMB / The Williams Companies, Inc. | 0.00 | -5.48 | 0.19 | 1.09 | 1.0737 | -0.0508 | |||
| YUM / Yum! Brands, Inc. | 0.00 | 118.75 | 0.19 | 131.25 | 1.0727 | 0.5783 | |||
| O / Realty Income Corporation | 0.00 | -11.12 | 0.19 | 6.94 | 1.0706 | 0.0038 | |||
| NEM / Newmont Corporation | 0.00 | -2.92 | 0.18 | 23.49 | 1.0667 | 0.1515 | |||
| CI / The Cigna Group | 0.00 | -2.56 | 0.18 | 2.22 | 1.0660 | -0.0440 | |||
| IVZ / Invesco Ltd. | 0.01 | 0.18 | 1.0629 | 1.0629 | |||||
| OKE / ONEOK, Inc. | 0.00 | -8.50 | 0.18 | 2.25 | 1.0532 | -0.0421 | |||
| DHI / D.R. Horton, Inc. | 0.00 | -5.12 | 0.18 | 28.57 | 1.0407 | 0.1791 | |||
| FDX / FedEx Corporation | 0.00 | -6.46 | 0.18 | -14.42 | 1.0301 | -0.2527 | |||
| GRMN / Garmin Ltd. | 0.00 | -4.72 | 0.18 | 2.91 | 1.0254 | -0.0337 | |||
| SLB / Schlumberger Limited | 0.00 | -2.11 | 0.17 | -12.63 | 0.9990 | -0.2215 | |||
| NYT / The New York Times Company | 0.00 | -4.51 | 0.17 | 4.24 | 0.9934 | -0.0242 | |||
| BPOP / Popular, Inc. | 0.00 | -5.15 | 0.17 | 7.59 | 0.9817 | 0.0112 | |||
| AGNC / AGNC Investment Corp. | 0.02 | 131.97 | 0.17 | 156.06 | 0.9811 | 0.5709 | |||
| DOW / Dow Inc. | 0.00 | -2.12 | 0.17 | 0.60 | 0.9742 | -0.0535 | |||
| REXR / Rexford Industrial Realty, Inc. | 0.00 | 70.56 | 0.17 | 93.10 | 0.9709 | 0.4345 | |||
| GM / General Motors Company | 0.00 | -3.13 | 0.17 | -6.70 | 0.9684 | -0.1330 | |||
| PEP / PepsiCo, Inc. | 0.00 | -2.19 | 0.17 | 0.61 | 0.9631 | -0.0524 | |||
| NLY / Annaly Capital Management, Inc. | 0.01 | 29.50 | 0.17 | 36.36 | 0.9567 | 0.2107 | |||
| NTAP / NetApp, Inc. | 0.00 | -0.82 | 0.16 | -4.65 | 0.9498 | -0.1121 | |||
| US21871X1090 / Corebridge Financial, Inc. | 0.01 | -2.14 | 0.16 | -1.80 | 0.9478 | -0.0806 | |||
| PCAR / PACCAR Inc | 0.00 | -2.14 | 0.16 | -6.36 | 0.9371 | -0.1251 | |||
| VIG / Vanguard Specialized Funds - Vanguard Dividend Appreciation ETF | 0.00 | 131.71 | 0.16 | 153.97 | 0.9273 | 0.5351 | |||
| DVY / iShares Trust - iShares Select Dividend ETF | 0.00 | 126.91 | 0.16 | 153.97 | 0.9271 | 0.5380 | |||
| ABBV / AbbVie Inc. | 0.00 | -45.13 | 0.16 | -40.68 | 0.9063 | -0.7208 | |||
| TGT / Target Corporation | 0.00 | -2.12 | 0.15 | 3.42 | 0.8719 | -0.0278 | |||
| ARE / Alexandria Real Estate Equities, Inc. | 0.00 | 197.61 | 0.15 | 202.04 | 0.8549 | 0.5540 | |||
| TMUS / T-Mobile US, Inc. | 0.00 | -2.20 | 0.15 | 14.96 | 0.8458 | 0.0607 | |||
| BDX / Becton, Dickinson and Company | 0.00 | -3.28 | 0.14 | 0.00 | 0.8198 | -0.0539 | |||
| MSI / Motorola Solutions, Inc. | 0.00 | -2.22 | 0.14 | 14.05 | 0.7995 | 0.0530 | |||
| SO / The Southern Company | 0.00 | -2.14 | 0.14 | 14.29 | 0.7861 | 0.0514 | |||
| UNM / Unum Group | 0.00 | -0.78 | 0.14 | 15.38 | 0.7834 | 0.0615 | |||
| AMGN / Amgen Inc. | 0.00 | -2.77 | 0.14 | 0.00 | 0.7831 | -0.0474 | |||
| GPN / Global Payments Inc. | 0.00 | -2.18 | 0.13 | 3.91 | 0.7687 | -0.0202 | |||
| DOV / Dover Corporation | 0.00 | 0.13 | 0.7593 | 0.7593 | |||||
| USB / U.S. Bancorp | 0.00 | 0.13 | 0.7220 | 0.7220 | |||||
| PB / Prosperity Bancshares, Inc. | 0.00 | -2.12 | 0.12 | 15.53 | 0.6919 | 0.0543 | |||
| AEP / American Electric Power Company, Inc. | 0.00 | -2.11 | 0.11 | 15.15 | 0.6592 | 0.0469 | |||
| STZ / Constellation Brands, Inc. | 0.00 | -0.67 | 0.11 | -0.88 | 0.6575 | -0.0453 | |||
| DTE / DTE Energy Company | 0.00 | -2.61 | 0.11 | 13.40 | 0.6360 | 0.0357 | |||
| OSK / Oshkosh Corporation | 0.00 | 2.49 | 0.10 | -4.63 | 0.5959 | -0.0716 | |||
| TT / Trane Technologies plc | 0.00 | -2.25 | 0.10 | 16.09 | 0.5857 | 0.0466 | |||
| KLAC / KLA Corporation | 0.00 | -2.27 | 0.10 | -8.33 | 0.5767 | -0.0914 | |||
| AMT / American Tower Corporation | 0.00 | -1.88 | 0.10 | 18.29 | 0.5612 | 0.0529 | |||
| AIG / American International Group, Inc. | 0.00 | -2.15 | 0.10 | -3.03 | 0.5568 | -0.0566 | |||
| PNFP / Pinnacle Financial Partners, Inc. | 0.00 | 1.31 | 0.09 | 23.29 | 0.5249 | 0.0748 | |||
| NRZ / New Residential Investment Corp | 0.01 | 0.00 | 0.09 | 3.57 | 0.5049 | -0.0112 | |||
| KIM / Kimco Realty Corporation | 0.00 | -2.12 | 0.08 | 16.18 | 0.4586 | 0.0411 | |||
| STT / State Street Corporation | 0.00 | -2.09 | 0.08 | 16.42 | 0.4551 | 0.0417 | |||
| ERIE / Erie Indemnity Company | 0.00 | -2.10 | 0.08 | 47.06 | 0.4363 | 0.1182 | |||
| AES / The AES Corporation | 0.00 | 0.07 | 0.4198 | 0.4198 | |||||
| TSCO / Tractor Supply Company | 0.00 | 2.14 | 0.07 | 9.52 | 0.4014 | 0.0136 | |||
| EHC / Encompass Health Corporation | 0.00 | -63.16 | 0.07 | -58.43 | 0.3989 | -0.6233 | |||
| BAH / Booz Allen Hamilton Holding Corporation | 0.00 | -2.27 | 0.06 | 3.28 | 0.3646 | -0.0105 | |||
| ALV / Autoliv, Inc. | 0.00 | 11.33 | 0.06 | -3.12 | 0.3601 | -0.0340 | |||
| HXL / Hexcel Corporation | 0.00 | 0.06 | 0.3448 | 0.3448 | |||||
| SUI / Sun Communities, Inc. | 0.00 | 428.36 | 0.05 | 571.43 | 0.2762 | 0.2293 | |||
| V / Visa Inc. | 0.00 | -22.12 | 0.05 | -17.86 | 0.2683 | -0.0892 | |||
| DCI / Donaldson Company, Inc. | 0.00 | 0.04 | 0.2195 | 0.2195 | |||||
| ROST / Ross Stores, Inc. | 0.00 | -2.34 | 0.04 | 0.00 | 0.2172 | -0.0111 | |||
| JPM / JPMorgan Chase & Co. | 0.00 | -2.03 | 0.03 | 3.45 | 0.1765 | -0.0072 | |||
| EGP / EastGroup Properties, Inc. | 0.00 | 0.03 | 0.1467 | 0.1467 | |||||
| STAG / STAG Industrial, Inc. | 0.00 | -2.03 | 0.02 | 4.35 | 0.1417 | -0.0002 | |||
| ALL / The Allstate Corporation | 0.00 | -84.91 | 0.02 | -82.31 | 0.1347 | -0.6641 | |||
| AVB / AvalonBay Communities, Inc. | 0.00 | -59.91 | 0.02 | -47.37 | 0.1157 | -0.1097 | |||
| ST / Sensata Technologies Holding plc | 0.00 | 0.02 | 0.1137 | 0.1137 | |||||
| WELL / Welltower Inc. | 0.00 | -91.36 | 0.02 | -89.50 | 0.1109 | -1.0007 | |||
| NYCB / Flagstar Financial, Inc. | 0.00 | -70.44 | 0.02 | 5.88 | 0.1070 | -0.0034 | |||
| OZK / Bank OZK | 0.00 | -2.04 | 0.02 | 0.00 | 0.0953 | -0.0034 | |||
| PH / Parker-Hannifin Corporation | 0.00 | 69.23 | 0.01 | 160.00 | 0.0802 | 0.0423 | |||
| AMH / American Homes 4 Rent | 0.00 | -8.25 | 0.01 | -7.14 | 0.0789 | -0.0096 | |||
| UNH / UnitedHealth Group Incorporated | 0.00 | -58.93 | 0.01 | -55.17 | 0.0776 | -0.1089 | |||
| THG / The Hanover Insurance Group, Inc. | 0.00 | 26.76 | 0.01 | 62.50 | 0.0770 | 0.0223 | |||
| LECO / Lincoln Electric Holdings, Inc. | 0.00 | -1.59 | 0.01 | 0.00 | 0.0687 | -0.0042 | |||
| FLS / Flowserve Corporation | 0.00 | -2.14 | 0.01 | 12.50 | 0.0546 | -0.0006 | |||
| EG / Everest Group, Ltd. | 0.00 | 0.00 | 0.01 | 12.50 | 0.0520 | -0.0018 | |||
| BKR / Baker Hughes Company | 0.00 | 0.01 | 0.0474 | 0.0474 | |||||
| TW / Tradeweb Markets Inc. | 0.00 | 0.01 | 0.0343 | 0.0343 | |||||
| DRI / Darden Restaurants, Inc. | 0.00 | -97.15 | 0.01 | -97.04 | 0.0303 | -1.0110 | |||
| ITW / Illinois Tool Works Inc. | 0.00 | -26.92 | 0.00 | -33.33 | 0.0287 | -0.0091 | |||
| STWD / Starwood Property Trust, Inc. | 0.00 | 0.00 | 0.0171 | 0.0171 | |||||
| LEN / Lennar Corporation | 0.00 | -93.66 | 0.00 | -93.33 | 0.0141 | -0.1745 | |||
| TRV / The Travelers Companies, Inc. | 0.00 | 0.00 | 0.0108 | 0.0108 | |||||
| ATMU / Atmus Filtration Technologies Inc. | 0.00 | 0.00 | 0.0001 | 0.0000 | |||||
| WEN / The Wendy's Company | 0.00 | -100.00 | 0.00 | -100.00 | -0.3073 | ||||
| SEIC / SEI Investments Company | 0.00 | -100.00 | 0.00 | -100.00 | -0.1175 | ||||
| INVH / Invitation Homes Inc. | 0.00 | -100.00 | 0.00 | -100.00 | -0.2683 | ||||
| CINF / Cincinnati Financial Corporation | 0.00 | -100.00 | 0.00 | -100.00 | -0.2624 | ||||
| MLM / Martin Marietta Materials, Inc. | 0.00 | -100.00 | 0.00 | -100.00 | -0.3193 |