Statistik Asas
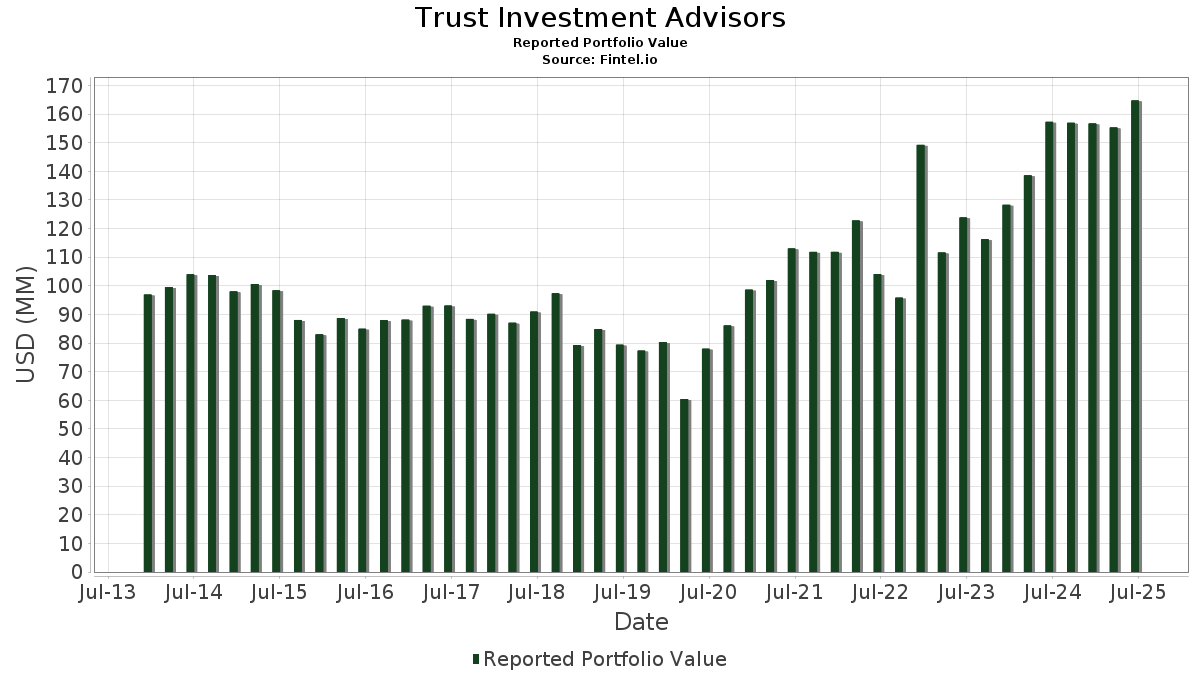
| Nilai Portfolio | $ 164,734,973 |
| Kedudukan Semasa | 123 |
Pegangan Terkini, Prestasi, AUM (dari 13F, 13D)
Trust Investment Advisors telah mendedahkan 123 jumlah pegangan dalam pemfailan SEC terkini mereka. Nilai portfolio terkini dikira sebagai $ 164,734,973 USD. Aset Sebenar Di Bawah Pengurusan (AUM) ialah nilai ini ditambah dengan tunai (yang tidak didedahkan). Pegangan teratas Trust Investment Advisors ialah Eli Lilly and Company (US:LLY) , Apple Inc. (US:AAPL) , Microsoft Corporation (US:MSFT) , Broadcom Inc. (US:AVGO) , and NVIDIA Corporation (US:NVDA) . Kedudukan baharu Trust Investment Advisors termasuk Capital One Financial Corporation (US:COF) , Honeywell International Inc. (US:HON) , Vistra Corp. (US:VST) , Amphenol Corporation (US:APH) , and Corteva, Inc. (US:CTVA) .
Kenaikan Teratas Suku Tahun Ini
Kami menggunakan perubahan dalam peruntukan portfolio kerana ini adalah metrik yang paling bermakna. Perubahan boleh disebabkan oleh perdagangan atau perubahan dalam harga saham.
| Sekuriti | Saham (MM) |
Nilai (MM$) |
Portfolio % | ΔPortfolio % |
|---|---|---|---|---|
| 0.01 | 2.31 | 1.4045 | 1.4045 | |
| 0.02 | 6.33 | 3.8403 | 1.2788 | |
| 0.02 | 3.41 | 2.0713 | 0.9373 | |
| 0.02 | 9.88 | 5.9961 | 0.9125 | |
| 0.03 | 5.38 | 3.2688 | 0.7775 | |
| 0.00 | 1.07 | 0.6490 | 0.6490 | |
| 0.01 | 1.41 | 0.8558 | 0.6103 | |
| 0.02 | 4.34 | 2.6331 | 0.4890 | |
| 0.00 | 0.75 | 0.4522 | 0.4522 | |
| 0.06 | 2.60 | 1.5792 | 0.3809 |
Penurunan Teratas Suku Tahun Ini
Kami menggunakan perubahan dalam peruntukan portfolio kerana ini adalah metrik yang paling bermakna. Perubahan boleh disebabkan oleh perdagangan atau perubahan dalam harga saham.
| Sekuriti | Saham (MM) |
Nilai (MM$) |
Portfolio % | ΔPortfolio % |
|---|---|---|---|---|
| 0.02 | 16.20 | 9.8346 | -1.8973 | |
| 0.07 | 14.30 | 8.6795 | -1.5841 | |
| 0.00 | 1.00 | 0.6097 | -0.5508 | |
| 0.01 | 1.40 | 0.8488 | -0.4018 | |
| 0.02 | 1.68 | 1.0225 | -0.3575 | |
| 0.01 | 1.55 | 0.9397 | -0.2846 | |
| 0.00 | 1.76 | 1.0714 | -0.2454 | |
| 0.05 | 1.40 | 0.8484 | -0.2252 | |
| 0.00 | 1.88 | 1.1396 | -0.2121 | |
| 0.03 | 1.59 | 0.9654 | -0.1808 |
13F dan Pemfailan Dana
Borang ini telah difailkan pada 2025-08-01 untuk tempoh pelaporan 2025-06-30. Klik ikon pautan untuk melihat sejarah transaksi penuh.
Tingkatkan untuk membuka data premium dan eksport ke Excel ![]() .
.
| Sekuriti | Jenis | Purata Harga Saham | Saham (MM) |
ΔSaham (%) |
ΔSaham (%) |
Nilai ($MM) |
Portfolio (%) |
ΔPortfolio (%) |
|
|---|---|---|---|---|---|---|---|---|---|
| LLY / Eli Lilly and Company | 0.02 | -5.79 | 16.20 | -11.08 | 9.8346 | -1.8973 | |||
| AAPL / Apple Inc. | 0.07 | -2.88 | 14.30 | -10.30 | 8.6795 | -1.5841 | |||
| MSFT / Microsoft Corporation | 0.02 | -5.58 | 9.88 | 25.12 | 5.9961 | 0.9125 | |||
| AVGO / Broadcom Inc. | 0.02 | -3.41 | 6.33 | 59.06 | 3.8403 | 1.2788 | |||
| NVDA / NVIDIA Corporation | 0.03 | -4.52 | 5.38 | 39.16 | 3.2688 | 0.7775 | |||
| TSM / Taiwan Semiconductor Manufacturing Company Limited - Depositary Receipt (Common Stock) | 0.02 | -4.52 | 4.34 | 30.28 | 2.6331 | 0.4890 | |||
| CLS / Celestica Inc. | 0.02 | -2.18 | 3.41 | 93.75 | 2.0713 | 0.9373 | |||
| IBM / International Business Machines Corporation | 0.01 | -4.69 | 3.17 | 13.00 | 1.9258 | 0.1179 | |||
| JPM / JPMorgan Chase & Co. | 0.01 | -8.45 | 2.78 | 8.18 | 1.6863 | 0.0331 | |||
| PANW / Palo Alto Networks, Inc. | 0.01 | -4.90 | 2.67 | 14.07 | 1.6198 | 0.1132 | |||
| CHWY / Chewy, Inc. | 0.06 | 6.64 | 2.60 | 39.84 | 1.5792 | 0.3809 | |||
| CAT / Caterpillar Inc. | 0.01 | -5.10 | 2.49 | 11.74 | 1.5134 | 0.0763 | |||
| COF / Capital One Financial Corporation | 0.01 | 2.31 | 1.4045 | 1.4045 | |||||
| ETN / Eaton Corporation plc | 0.01 | -6.66 | 2.24 | 22.60 | 1.3570 | 0.1827 | |||
| CSCO / Cisco Systems, Inc. | 0.03 | -2.28 | 2.15 | 9.82 | 1.3039 | 0.0450 | |||
| GOOG / Alphabet Inc. | 0.01 | -3.47 | 2.15 | 9.61 | 1.3021 | 0.0419 | |||
| RIO / Rio Tinto Group - Depositary Receipt (Common Stock) | 0.04 | -3.49 | 2.13 | -6.31 | 1.2904 | -0.1704 | |||
| MS / Morgan Stanley | 0.01 | -6.33 | 2.09 | 13.11 | 1.2676 | 0.0786 | |||
| HD / The Home Depot, Inc. | 0.01 | -4.39 | 2.07 | -4.34 | 1.2590 | -0.1373 | |||
| TJX / The TJX Companies, Inc. | 0.02 | -8.02 | 2.04 | -6.75 | 1.2403 | -0.1705 | |||
| AMD / Advanced Micro Devices, Inc. | 0.01 | -5.11 | 1.92 | 31.08 | 1.1650 | 0.2221 | |||
| RTX / RTX Corporation | 0.01 | -15.65 | 1.90 | -7.00 | 1.1532 | -0.1623 | |||
| TT / Trane Technologies plc | 0.00 | -8.45 | 1.90 | 18.84 | 1.1532 | 0.1240 | |||
| MSI / Motorola Solutions, Inc. | 0.00 | -6.88 | 1.88 | -10.58 | 1.1396 | -0.2121 | |||
| V / Visa Inc. | 0.00 | -14.81 | 1.76 | -13.70 | 1.0714 | -0.2454 | |||
| IRM / Iron Mountain Incorporated | 0.02 | -7.26 | 1.75 | 10.54 | 1.0635 | 0.0431 | |||
| QCOM / QUALCOMM Incorporated | 0.01 | -4.17 | 1.69 | -0.65 | 1.0274 | -0.0694 | |||
| OKE / ONEOK, Inc. | 0.02 | -4.47 | 1.68 | -21.42 | 1.0225 | -0.3575 | |||
| MA / Mastercard Incorporated | 0.00 | -3.86 | 1.65 | -1.43 | 1.0015 | -0.0763 | |||
| DELL / Dell Technologies Inc. | 0.01 | 0.52 | 1.63 | 35.13 | 0.9882 | 0.2129 | |||
| TSCO / Tractor Supply Company | 0.03 | -6.71 | 1.59 | -10.67 | 0.9654 | -0.1808 | |||
| CFG / Citizens Financial Group, Inc. | 0.04 | -5.49 | 1.57 | 3.22 | 0.9550 | -0.0263 | |||
| VMC / Vulcan Materials Company | 0.01 | -6.19 | 1.56 | 4.90 | 0.9485 | -0.0108 | |||
| DUK / Duke Energy Corporation | 0.01 | -15.85 | 1.55 | -18.62 | 0.9397 | -0.2846 | |||
| WBS / Webster Financial Corporation | 0.03 | -4.18 | 1.41 | 1.51 | 0.8588 | -0.0388 | |||
| BA / The Boeing Company | 0.01 | -1.16 | 1.41 | 21.45 | 0.8560 | 0.1083 | |||
| AMZN / Amazon.com, Inc. | 0.01 | 220.66 | 1.41 | 269.82 | 0.8558 | 0.6103 | |||
| CVX / Chevron Corporation | 0.01 | -15.88 | 1.40 | -28.01 | 0.8488 | -0.4018 | |||
| T / AT&T Inc. | 0.05 | -18.09 | 1.40 | -16.20 | 0.8484 | -0.2252 | |||
| INGR / Ingredion Incorporated | 0.01 | -9.60 | 1.39 | -9.34 | 0.8429 | -0.1431 | |||
| XOM / Exxon Mobil Corporation | 0.01 | -3.56 | 1.39 | -12.56 | 0.8415 | -0.1796 | |||
| LNC / Lincoln National Corporation | 0.04 | -4.24 | 1.31 | -7.75 | 0.7950 | -0.1190 | |||
| O / Realty Income Corporation | 0.02 | -1.38 | 1.29 | -2.05 | 0.7852 | -0.0652 | |||
| BX / Blackstone Inc. | 0.01 | 34.60 | 1.17 | 44.03 | 0.7113 | 0.1875 | |||
| KMI / Kinder Morgan, Inc. | 0.04 | -4.31 | 1.12 | -1.41 | 0.6812 | -0.0516 | |||
| PRU / Prudential Financial, Inc. | 0.01 | -6.29 | 1.12 | -9.89 | 0.6809 | -0.1203 | |||
| NXPI / NXP Semiconductors N.V. | 0.00 | -5.21 | 1.08 | 8.94 | 0.6584 | 0.0175 | |||
| CI / The Cigna Group | 0.00 | -5.87 | 1.07 | -5.48 | 0.6500 | -0.0790 | |||
| HON / Honeywell International Inc. | 0.00 | 1.07 | 0.6490 | 0.6490 | |||||
| RITM / Rithm Capital Corp. | 0.09 | -2.70 | 1.03 | -4.09 | 0.6273 | -0.0663 | |||
| DIS / The Walt Disney Company | 0.01 | -2.25 | 1.01 | 22.82 | 0.6146 | 0.0838 | |||
| FTXP / Foothills Exploration, Inc. | 0.00 | -5.39 | 1.01 | 24.66 | 0.6112 | 0.0912 | |||
| UNH / UnitedHealth Group Incorporated | 0.00 | -6.42 | 1.00 | -44.28 | 0.6097 | -0.5508 | |||
| AMGN / Amgen Inc. | 0.00 | 48.74 | 1.00 | 33.38 | 0.6094 | 0.1246 | |||
| LOW / Lowe's Companies, Inc. | 0.00 | -5.12 | 0.95 | -9.75 | 0.5790 | -0.1015 | |||
| MLM / Martin Marietta Materials, Inc. | 0.00 | -6.67 | 0.94 | 7.15 | 0.5732 | 0.0058 | |||
| LIN / Linde plc | 0.00 | -6.03 | 0.90 | -5.37 | 0.5463 | -0.0657 | |||
| OBDC / Blue Owl Capital Corporation | 0.06 | 0.42 | 0.85 | -1.74 | 0.5140 | -0.0411 | |||
| CTRA / Coterra Energy Inc. | 0.03 | 352.74 | 0.83 | 298.56 | 0.5036 | 0.3693 | |||
| TSN / Tyson Foods, Inc. | 0.01 | 0.57 | 0.81 | -11.85 | 0.4928 | -0.1001 | |||
| STZ / Constellation Brands, Inc. | 0.00 | -6.69 | 0.77 | -17.28 | 0.4654 | -0.1315 | |||
| VST / Vistra Corp. | 0.00 | 0.75 | 0.4522 | 0.4522 | |||||
| FBND / Fidelity Merrimack Street Trust - Fidelity Total Bond ETF | 0.02 | 0.00 | 0.71 | 0.28 | 0.4330 | -0.0253 | |||
| KEYS / Keysight Technologies, Inc. | 0.00 | -7.70 | 0.66 | 0.92 | 0.4004 | -0.0202 | |||
| ASO / Academy Sports and Outdoors, Inc. | 0.01 | -6.22 | 0.65 | -7.94 | 0.3945 | -0.0597 | |||
| EOG / EOG Resources, Inc. | 0.01 | -2.87 | 0.64 | -9.42 | 0.3911 | -0.0668 | |||
| TGT / Target Corporation | 0.01 | -1.02 | 0.64 | -6.43 | 0.3890 | -0.0520 | |||
| JBHT / J.B. Hunt Transport Services, Inc. | 0.00 | -5.62 | 0.64 | -8.36 | 0.3864 | -0.0610 | |||
| GEHC / GE HealthCare Technologies Inc. | 0.01 | -1.40 | 0.63 | -9.55 | 0.3799 | -0.0654 | |||
| FSLR / First Solar, Inc. | 0.00 | -7.55 | 0.60 | 21.14 | 0.3620 | 0.0448 | |||
| PM / Philip Morris International Inc. | 0.00 | 0.00 | 0.52 | 14.76 | 0.3163 | 0.0239 | |||
| NXT / Nextracker Inc. | 0.01 | -2.32 | 0.51 | 26.24 | 0.3098 | 0.0490 | |||
| CAVA / CAVA Group, Inc. | 0.01 | -4.03 | 0.48 | -6.45 | 0.2911 | -0.0390 | |||
| WMT / Walmart Inc. | 0.00 | 0.00 | 0.46 | 11.33 | 0.2808 | 0.0134 | |||
| KO / The Coca-Cola Company | 0.01 | 0.22 | 0.41 | -0.96 | 0.2511 | -0.0180 | |||
| GRPN / Groupon, Inc. | 0.01 | -0.90 | 0.39 | 76.61 | 0.2342 | 0.0935 | |||
| MCD / McDonald's Corporation | 0.00 | 0.00 | 0.37 | -6.36 | 0.2235 | -0.0300 | |||
| CAH / Cardinal Health, Inc. | 0.00 | 0.00 | 0.35 | 21.72 | 0.2147 | 0.0279 | |||
| SIRI / Sirius XM Holdings Inc. | 0.01 | 0.00 | 0.34 | 1.78 | 0.2092 | -0.0086 | |||
| JNJ / Johnson & Johnson | 0.00 | 0.23 | 0.34 | -7.71 | 0.2037 | -0.0303 | |||
| ABBV / AbbVie Inc. | 0.00 | -34.05 | 0.33 | -41.65 | 0.1977 | -0.1613 | |||
| APH / Amphenol Corporation | 0.00 | 0.31 | 0.1895 | 0.1895 | |||||
| ODFL / Old Dominion Freight Line, Inc. | 0.00 | 0.00 | 0.30 | -1.96 | 0.1825 | -0.0148 | |||
| RSG / Republic Services, Inc. | 0.00 | 0.28 | 0.1695 | 0.1695 | |||||
| UBER / Uber Technologies, Inc. | 0.00 | 0.28 | 0.1684 | 0.1684 | |||||
| CTVA / Corteva, Inc. | 0.00 | 0.28 | 0.1684 | 0.1684 | |||||
| ATGE / Adtalem Global Education Inc. | 0.00 | 0.27 | 0.1609 | 0.1609 | |||||
| JBL / Jabil Inc. | 0.00 | 0.26 | 0.1583 | 0.1583 | |||||
| PLTR / Palantir Technologies Inc. | 0.00 | 0.26 | 0.1575 | 0.1575 | |||||
| EMR / Emerson Electric Co. | 0.00 | 0.27 | 0.25 | 21.89 | 0.1492 | 0.0194 | |||
| ELV / Elevance Health, Inc. | 0.00 | 0.00 | 0.24 | -10.61 | 0.1438 | -0.0268 | |||
| HWM / Howmet Aerospace Inc. | 0.00 | 0.23 | 0.1424 | 0.1424 | |||||
| RGLD / Royal Gold, Inc. | 0.00 | 0.00 | 0.23 | 8.37 | 0.1420 | 0.0035 | |||
| BRK.B / Berkshire Hathaway Inc. | 0.00 | 0.00 | 0.23 | -8.76 | 0.1395 | -0.0227 | |||
| MNST / Monster Beverage Corporation | 0.00 | 0.00 | 0.23 | 7.04 | 0.1388 | 0.0013 | |||
| CCEP / Coca-Cola Europacific Partners PLC | 0.00 | 0.23 | 0.1387 | 0.1387 | |||||
| COR / Cencora, Inc. | 0.00 | 0.00 | 0.23 | 8.06 | 0.1385 | 0.0022 | |||
| NFLX / Netflix, Inc. | 0.00 | 0.23 | 0.1382 | 0.1382 | |||||
| NTRS / Northern Trust Corporation | 0.00 | 0.23 | 0.1374 | 0.1374 | |||||
| TXN / Texas Instruments Incorporated | 0.00 | -15.34 | 0.22 | -2.18 | 0.1364 | -0.0114 | |||
| GE / General Electric Company | 0.00 | -14.83 | 0.22 | 9.85 | 0.1355 | 0.0043 | |||
| DGX / Quest Diagnostics Incorporated | 0.00 | 0.22 | 0.1352 | 0.1352 | |||||
| IDV / iShares Trust - iShares International Select Dividend ETF | 0.01 | 0.22 | 0.1341 | 0.1341 | |||||
| ROK / Rockwell Automation, Inc. | 0.00 | 0.22 | 0.1339 | 0.1339 | |||||
| JCI / Johnson Controls International plc | 0.00 | 0.22 | 0.1336 | 0.1336 | |||||
| THC / Tenet Healthcare Corporation | 0.00 | 0.22 | 0.1327 | 0.1327 | |||||
| HII / Huntington Ingalls Industries, Inc. | 0.00 | 0.21 | 0.1299 | 0.1299 | |||||
| WRB / W. R. Berkley Corporation | 0.00 | 0.21 | 0.1291 | 0.1291 | |||||
| SPY / SPDR S&P 500 ETF | 0.00 | 0.21 | 0.1290 | 0.1290 | |||||
| IMCV / iShares Trust - iShares Morningstar Mid-Cap Value ETF | 0.00 | 0.18 | 0.21 | 2.91 | 0.1289 | -0.0044 | |||
| AEE / Ameren Corporation | 0.00 | 0.00 | 0.21 | -4.09 | 0.1283 | -0.0140 | |||
| AXON / Axon Enterprise, Inc. | 0.00 | 0.21 | 0.1282 | 0.1282 | |||||
| UGI / UGI Corporation | 0.01 | 0.21 | 0.1275 | 0.1275 | |||||
| HIG / The Hartford Insurance Group, Inc. | 0.00 | 0.21 | 0.1263 | 0.1263 | |||||
| MDT / Medtronic plc | 0.00 | 0.51 | 0.21 | -2.36 | 0.1258 | -0.0111 | |||
| ROL / Rollins, Inc. | 0.00 | 0.21 | 0.1252 | 0.1252 | |||||
| NSC / Norfolk Southern Corporation | 0.00 | 0.21 | 0.1245 | 0.1245 | |||||
| VRSK / Verisk Analytics, Inc. | 0.00 | 0.20 | 0.1237 | 0.1237 | |||||
| NRG / NRG Energy, Inc. | 0.00 | 0.20 | 0.1233 | 0.1233 | |||||
| GT / The Goodyear Tire & Rubber Company | 0.02 | 0.17 | 0.1059 | 0.1059 | |||||
| AVK / Advent Convertible and Income Fund | 0.01 | 2.50 | 0.15 | 7.19 | 0.0909 | 0.0013 | |||
| STLA / Stellantis N.V. | 0.01 | 0.00 | 0.14 | -10.26 | 0.0852 | -0.0158 | |||
| NRO / Neuberger Berman Real Estate Securities Income Fund Inc. | 0.03 | 2.54 | 0.11 | 0.00 | 0.0667 | -0.0040 | |||
| EBAY / eBay Inc. | 0.00 | -100.00 | 0.00 | 0.0000 | |||||
| MCK / McKesson Corporation | 0.00 | -100.00 | 0.00 | 0.0000 | |||||
| BRO / Brown & Brown, Inc. | 0.00 | -100.00 | 0.00 | 0.0000 | |||||
| SLM / SLM Corporation | 0.00 | -100.00 | 0.00 | 0.0000 | |||||
| DTE / DTE Energy Company | 0.00 | -100.00 | 0.00 | 0.0000 | |||||
| WMB / The Williams Companies, Inc. | 0.00 | -100.00 | 0.00 | 0.0000 | |||||
| L / Loews Corporation | 0.00 | -100.00 | 0.00 | 0.0000 | |||||
| AIG / American International Group, Inc. | 0.00 | -100.00 | 0.00 | 0.0000 | |||||
| YUM / Yum! Brands, Inc. | 0.00 | -100.00 | 0.00 | 0.0000 | |||||
| VRSN / VeriSign, Inc. | 0.00 | -100.00 | 0.00 | 0.0000 | |||||
| ICE / Intercontinental Exchange, Inc. | 0.00 | -100.00 | 0.00 | 0.0000 | |||||
| TFC / Truist Financial Corporation | 0.00 | -100.00 | 0.00 | 0.0000 | |||||
| EXC / Exelon Corporation | 0.00 | -100.00 | 0.00 | 0.0000 | |||||
| WTW / Willis Towers Watson Public Limited Company | 0.00 | -100.00 | 0.00 | 0.0000 | |||||
| GL / Globe Life Inc. | 0.00 | -100.00 | 0.00 | 0.0000 | |||||
| MMM / 3M Company | 0.00 | -100.00 | 0.00 | 0.0000 | |||||
| TMUS / T-Mobile US, Inc. | 0.00 | -100.00 | 0.00 | 0.0000 | |||||
| UNP / Union Pacific Corporation | 0.00 | -100.00 | 0.00 | 0.0000 | |||||
| DFS / Discover Financial Services | 0.00 | -100.00 | 0.00 | 0.0000 | |||||
| WELL / Welltower Inc. | 0.00 | -100.00 | 0.00 | 0.0000 | |||||
| MRK / Merck & Co., Inc. | 0.00 | -100.00 | 0.00 | 0.0000 | |||||
| MMC / Marsh & McLennan Companies, Inc. | 0.00 | -100.00 | 0.00 | 0.0000 | |||||
| VZ / Verizon Communications Inc. | 0.00 | -100.00 | 0.00 | 0.0000 | |||||
| ULTA / Ulta Beauty, Inc. | 0.00 | -100.00 | 0.00 | 0.0000 | |||||
| CVS / CVS Health Corporation | 0.00 | -100.00 | 0.00 | 0.0000 |