Statistik Asas
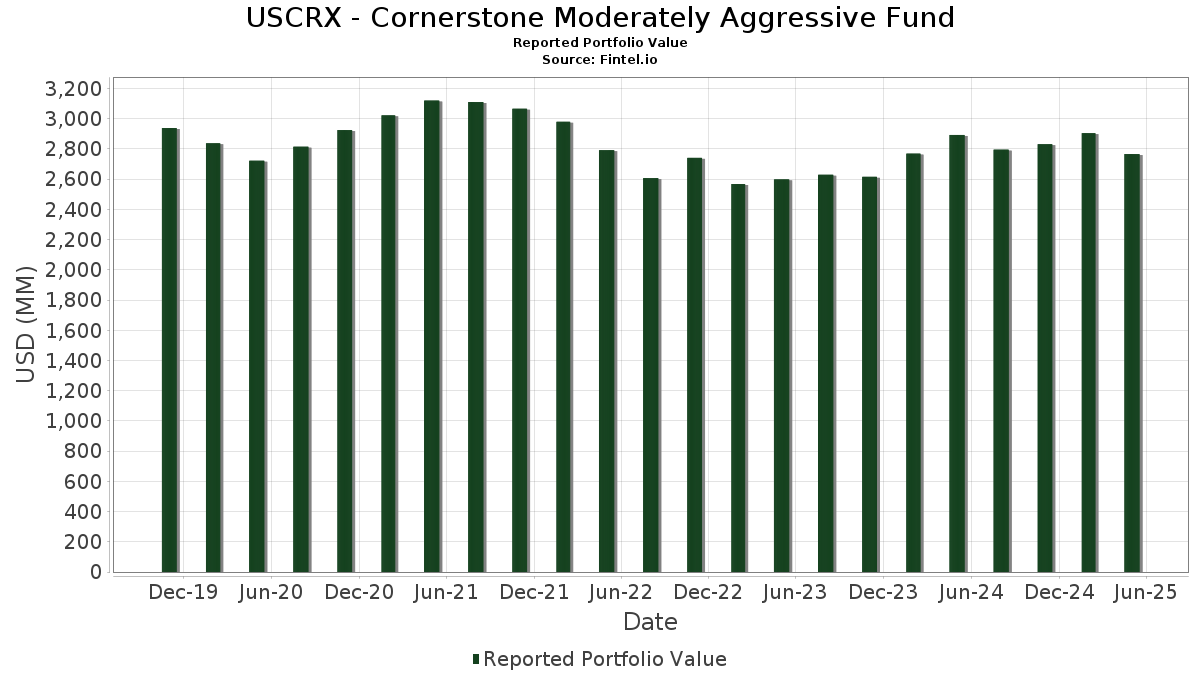
| Nilai Portfolio | $ 2,766,168,364 |
| Kedudukan Semasa | 421 |
Pegangan Terkini, Prestasi, AUM (dari 13F, 13D)
USCRX - Cornerstone Moderately Aggressive Fund telah mendedahkan 421 jumlah pegangan dalam pemfailan SEC terkini mereka. Nilai portfolio terkini dikira sebagai $ 2,766,168,364 USD. Aset Sebenar Di Bawah Pengurusan (AUM) ialah nilai ini ditambah dengan tunai (yang tidak didedahkan). Pegangan teratas USCRX - Cornerstone Moderately Aggressive Fund ialah Victory Portfolios II - VictoryShares Core Intermediate Bond ETF (US:UITB) , Victory Portfolios II - VictoryShares Core Plus Intermediate Bond ETF (US:UBND) , Vanguard Tax-Managed Funds - Vanguard FTSE Developed Markets ETF (US:VEA) , Schwab Strategic Trust - Schwab Fundamental International Equity ETF (US:FNDF) , and iShares Trust - iShares Core S&P 500 ETF (US:IVV) . Kedudukan baharu USCRX - Cornerstone Moderately Aggressive Fund termasuk SPDR Series Trust - SPDR S&P Biotech ETF (US:XBI) , Dime Community Bancshares, Inc. (US:DCOM) , MRC Global Inc. (US:MRC) , LXP Industrial Trust (US:LXP) , and Niagen Bioscience, Inc. (US:NAGE) .
Kenaikan Teratas Suku Tahun Ini
Kami menggunakan perubahan dalam peruntukan portfolio kerana ini adalah metrik yang paling bermakna. Perubahan boleh disebabkan oleh perdagangan atau perubahan dalam harga saham.
| Sekuriti | Saham (MM) |
Nilai (MM$) |
Portfolio % | ΔPortfolio % |
|---|---|---|---|---|
| 8.82 | 190.50 | 7.0716 | 2.1580 | |
| 2.73 | 67.98 | 2.5235 | 1.0941 | |
| 0.75 | 57.44 | 2.1321 | 1.0095 | |
| 3.01 | 75.34 | 2.7967 | 0.5326 | |
| 0.13 | 37.00 | 1.3736 | 0.4342 | |
| 0.40 | 38.88 | 1.4432 | 0.3848 | |
| 0.22 | 11.05 | 0.4103 | 0.2940 | |
| 0.13 | 79.41 | 2.9477 | 0.2686 | |
| 0.35 | 22.55 | 0.8371 | 0.2175 | |
| 1.13 | 50.34 | 1.8686 | 0.1442 |
Penurunan Teratas Suku Tahun Ini
Kami menggunakan perubahan dalam peruntukan portfolio kerana ini adalah metrik yang paling bermakna. Perubahan boleh disebabkan oleh perdagangan atau perubahan dalam harga saham.
| Sekuriti | Saham (MM) |
Nilai (MM$) |
Portfolio % | ΔPortfolio % |
|---|---|---|---|---|
| 8.40 | 390.54 | 14.4974 | -3.8691 | |
| 0.00 | 0.00 | -3.7131 | ||
| 25.80 | 25.80 | 0.9576 | -0.9915 | |
| 25.80 | 25.80 | 0.9576 | -0.9915 | |
| 25.80 | 25.80 | 0.9576 | -0.9915 | |
| 25.80 | 25.80 | 0.9576 | -0.9915 | |
| 2.94 | 163.29 | 6.0616 | -0.7701 | |
| 0.22 | 44.09 | 1.6368 | -0.3267 | |
| 1.59 | 49.90 | 1.8525 | -0.3065 | |
| 1.30 | 28.87 | 1.0718 | -0.1529 |
13F dan Pemfailan Dana
Borang ini telah difailkan pada 2025-07-25 untuk tempoh pelaporan 2025-05-31. Klik ikon pautan untuk melihat sejarah transaksi penuh.
Tingkatkan untuk membuka data premium dan eksport ke Excel ![]() .
.
| Sekuriti | Jenis | Purata Harga Saham | Saham (MM) |
ΔSaham (%) |
ΔSaham (%) |
Nilai ($MM) |
Portfolio (%) |
ΔPortfolio (%) |
|
|---|---|---|---|---|---|---|---|---|---|
| UITB / Victory Portfolios II - VictoryShares Core Intermediate Bond ETF | 8.40 | -20.38 | 390.54 | -21.36 | 14.4974 | -3.8691 | |||
| UBND / Victory Portfolios II - VictoryShares Core Plus Intermediate Bond ETF | 8.82 | 45.31 | 190.50 | 43.38 | 7.0716 | 2.1580 | |||
| VEA / Vanguard Tax-Managed Funds - Vanguard FTSE Developed Markets ETF | 2.94 | -18.78 | 163.29 | -11.60 | 6.0616 | -0.7701 | |||
| FNDF / Schwab Strategic Trust - Schwab Fundamental International Equity ETF | 2.91 | -8.31 | 113.36 | 0.70 | 4.2081 | 0.0448 | |||
| IVV / iShares Trust - iShares Core S&P 500 ETF | 0.13 | 10.52 | 79.41 | 9.62 | 2.9477 | 0.2686 | |||
| GFLW / Victory Portfolios II - Victoryshares Free Cash Flow Growth ETF | 3.01 | 16.23 | 75.34 | 23.07 | 2.7967 | 0.5326 | |||
| BMDL / Victory Portfolios II - VictoryShares WestEnd Economic Cycle Bond ETF | 2.73 | 78.44 | 67.98 | 75.88 | 2.5235 | 1.0941 | |||
| EWJ / iShares, Inc. - iShares MSCI Japan ETF | 0.88 | -8.53 | 65.34 | -1.91 | 2.4253 | -0.0649 | |||
| VGK / Vanguard International Equity Index Funds - Vanguard FTSE Europe ETF | 0.75 | 70.11 | 57.44 | 84.09 | 2.1321 | 1.0095 | |||
| IQLT / iShares Trust - iShares MSCI Intl Quality Factor ETF | 1.24 | -6.07 | 52.89 | 0.89 | 1.9635 | 0.0244 | |||
| IMTM / iShares Trust - iShares MSCI Intl Momentum Factor ETF | 1.13 | -3.27 | 50.34 | 7.96 | 1.8686 | 0.1442 | |||
| USTB / Victory Portfolios II - VictoryShares Short-Term Bond ETF | 0.99 | 0.00 | 50.33 | 0.20 | 1.8684 | 0.0106 | |||
| FNDE / Schwab Strategic Trust - Schwab Fundamental Emerging Markets Equity ETF | 1.59 | -17.56 | 49.90 | -14.51 | 1.8525 | -0.3065 | |||
| NVDA / NVIDIA Corporation | 0.34 | 0.00 | 46.38 | 8.17 | 1.7216 | 0.1360 | |||
| AAPL / Apple Inc. | 0.22 | 0.00 | 44.09 | -16.95 | 1.6368 | -0.3267 | |||
| GLD / SPDR Gold Trust | 0.14 | -16.95 | 43.18 | -4.23 | 1.6027 | -0.0646 | |||
| EWC / iShares, Inc. - iShares MSCI Canada ETF | 0.95 | -12.44 | 42.56 | -4.52 | 1.5799 | -0.0687 | |||
| AGG / iShares Trust - iShares Core U.S. Aggregate Bond ETF | 0.40 | 37.45 | 38.88 | 35.85 | 1.4432 | 0.3848 | |||
| IEF / iShares Trust - iShares 7-10 Year Treasury Bond ETF | 0.40 | 0.00 | 37.53 | -0.79 | 1.3932 | -0.0058 | |||
| VTI / Vanguard Index Funds - Vanguard Total Stock Market ETF | 0.13 | 47.23 | 37.00 | 45.69 | 1.3736 | 0.4342 | |||
| PXF / Invesco Exchange-Traded Fund Trust II - Invesco RAFI Developed Markets ex-U.S. ETF | 0.65 | 0.00 | 36.80 | 9.36 | 1.3663 | 0.1216 | |||
| BBCA / J.P. Morgan Exchange-Traded Fund Trust - JPMorgan BetaBuilders Canada ETF | 0.45 | -14.39 | 35.31 | -7.21 | 1.3109 | -0.0965 | |||
| IEMG / iShares, Inc. - iShares Core MSCI Emerging Markets ETF | 0.59 | -8.31 | 33.29 | -2.73 | 1.2356 | -0.0300 | |||
| GOOG / Alphabet Inc. | 0.17 | 0.00 | 29.37 | 0.37 | 1.0903 | 0.0080 | |||
| PXH / Invesco Exchange-Traded Fund Trust II - Invesco RAFI Emerging Markets ETF | 1.30 | -15.48 | 28.87 | -12.81 | 1.0718 | -0.1529 | |||
| STIP / iShares Trust - iShares 0-5 Year TIPS Bond ETF | 0.27 | 13.87 | 27.51 | 13.86 | 1.0211 | 0.1276 | |||
| VMBS / Vanguard Scottsdale Funds - Vanguard Mortgage-Backed Securities ETF | 0.59 | 0.00 | 27.21 | -1.61 | 1.0101 | -0.0128 | |||
| META / Meta Platforms, Inc. | 0.04 | 0.00 | 27.16 | -3.10 | 1.0082 | -0.0284 | |||
| US61747C7074 / Morgan Stanley Institutional Liquidity Funds Government Portfolio, Institutional Class | 25.80 | -51.05 | 25.80 | -51.05 | 0.9576 | -0.9915 | |||
| US40428X1072 / HSBC U.S. Government Money Market Fund | 25.80 | -51.05 | 25.80 | -51.05 | 0.9576 | -0.9915 | |||
| US8252528851 / Invesco Government & Agency Portfolio, Institutional Class | 25.80 | -51.05 | 25.80 | -51.05 | 0.9576 | -0.9915 | |||
| US38141W2733 / Goldman Sachs Financial Square Funds - Government Fund | 25.80 | -51.05 | 25.80 | -51.05 | 0.9576 | -0.9915 | |||
| EMB / iShares Trust - iShares J.P. Morgan USD Emerging Markets Bond ETF | 0.28 | 14.11 | 25.64 | 12.34 | 0.9517 | 0.1077 | |||
| SHY / iShares Trust - iShares 1-3 Year Treasury Bond ETF | 0.31 | 0.00 | 25.39 | 0.04 | 0.9427 | 0.0038 | |||
| FNDC / Schwab Strategic Trust - Schwab Fundamental International Small Equity ETF | 0.59 | 0.00 | 23.88 | 12.59 | 0.8865 | 0.1021 | |||
| TLT / iShares Trust - iShares 20+ Year Treasury Bond ETF | 0.28 | 0.00 | 23.81 | -6.65 | 0.8839 | -0.0595 | |||
| VEU / Vanguard International Equity Index Funds - Vanguard FTSE All-World ex-US ETF | 0.35 | 25.04 | 22.55 | 34.60 | 0.8371 | 0.2175 | |||
| MSFT / Microsoft Corporation | 0.04 | 0.00 | 19.22 | 15.96 | 0.7136 | 0.1005 | |||
| JPM / JPMorgan Chase & Co. | 0.06 | 0.00 | 14.99 | -0.25 | 0.5565 | 0.0007 | |||
| IJR / iShares Trust - iShares Core S&P Small-Cap ETF | 0.14 | 28.76 | 14.72 | 21.36 | 0.5464 | 0.0978 | |||
| VWO / Vanguard International Equity Index Funds - Vanguard FTSE Emerging Markets ETF | 0.29 | -15.86 | 13.57 | -11.59 | 0.5039 | -0.0640 | |||
| BND / Vanguard Bond Index Funds - Vanguard Total Bond Market ETF | 0.17 | 0.00 | 12.31 | -1.20 | 0.4569 | -0.0039 | |||
| UEVM / Victory Portfolios II - VictoryShares Emerging Markets Value Momentum ETF | 0.22 | 227.94 | 11.05 | 251.49 | 0.4103 | 0.2940 | |||
| HYLB / DBX ETF Trust - Xtrackers USD High Yield Corporate Bond ETF | 0.29 | 0.00 | 10.45 | -0.71 | 0.3881 | -0.0013 | |||
| VZ / Verizon Communications Inc. | 0.22 | 0.00 | 9.52 | 1.99 | 0.3533 | 0.0082 | |||
| MO / Altria Group, Inc. | 0.15 | 0.00 | 9.23 | 8.52 | 0.3427 | 0.0281 | |||
| MCK / McKesson Corporation | 0.01 | 0.00 | 8.60 | 12.38 | 0.3192 | 0.0362 | |||
| MRK / Merck & Co., Inc. | 0.11 | 0.00 | 8.55 | -16.70 | 0.3175 | -0.0623 | |||
| CAH / Cardinal Health, Inc. | 0.05 | 0.00 | 8.43 | 19.28 | 0.3129 | 0.0515 | |||
| ABBV / AbbVie Inc. | 0.04 | 0.00 | 8.20 | -10.97 | 0.3043 | -0.0362 | |||
| GM / General Motors Company | 0.16 | 0.00 | 7.99 | 0.99 | 0.2966 | 0.0040 | |||
| CSCO / Cisco Systems, Inc. | 0.12 | 0.00 | 7.85 | -1.67 | 0.2914 | -0.0038 | |||
| WMT / Walmart Inc. | 0.08 | 0.00 | 7.62 | 0.12 | 0.2829 | 0.0014 | |||
| AMP / Ameriprise Financial, Inc. | 0.01 | 0.00 | 7.13 | -5.22 | 0.2648 | -0.0136 | |||
| COST / Costco Wholesale Corporation | 0.01 | 0.00 | 6.96 | -0.81 | 0.2582 | -0.0011 | |||
| MSI / Motorola Solutions, Inc. | 0.02 | 0.00 | 6.79 | -5.64 | 0.2521 | -0.0141 | |||
| PM / Philip Morris International Inc. | 0.04 | 0.00 | 6.62 | 16.30 | 0.2458 | 0.0352 | |||
| EWX / SPDR Index Shares Funds - SPDR S&P Emerging Markets Small Cap ETF | 0.11 | 0.00 | 6.42 | 4.08 | 0.2384 | 0.0102 | |||
| EOG / EOG Resources, Inc. | 0.06 | 0.00 | 6.42 | -14.46 | 0.2382 | -0.0393 | |||
| GILD / Gilead Sciences, Inc. | 0.06 | 0.00 | 6.36 | -3.70 | 0.2360 | -0.0082 | |||
| CMI / Cummins Inc. | 0.02 | 0.00 | 6.29 | -12.69 | 0.2336 | -0.0329 | |||
| KMB / Kimberly-Clark Corporation | 0.04 | 0.00 | 6.25 | 1.23 | 0.2321 | 0.0037 | |||
| GDDY / GoDaddy Inc. | 0.03 | 0.00 | 6.12 | 1.48 | 0.2270 | 0.0041 | |||
| JNJ / Johnson & Johnson | 0.04 | 0.00 | 5.84 | -5.95 | 0.2167 | -0.0128 | |||
| DBC / Invesco DB Commodity Index Tracking Fund | 0.26 | 0.00 | 5.35 | -5.09 | 0.1985 | -0.0099 | |||
| PFE / Pfizer Inc. | 0.22 | 0.00 | 5.19 | -11.12 | 0.1928 | -0.0233 | |||
| SYF / Synchrony Financial | 0.09 | 0.00 | 5.14 | -4.99 | 0.1909 | -0.0093 | |||
| BKNG / Booking Holdings Inc. | 0.00 | 0.00 | 5.09 | 10.02 | 0.1891 | 0.0179 | |||
| EME / EMCOR Group, Inc. | 0.01 | 0.00 | 4.91 | 15.38 | 0.1822 | 0.0249 | |||
| VNQ / Vanguard Specialized Funds - Vanguard Real Estate ETF | 0.05 | 0.00 | 4.74 | -4.88 | 0.1758 | -0.0083 | |||
| QCOM / QUALCOMM Incorporated | 0.03 | 0.00 | 4.61 | -7.61 | 0.1712 | -0.0134 | |||
| WRB / W. R. Berkley Corporation | 0.06 | 0.00 | 4.46 | 18.41 | 0.1655 | 0.0262 | |||
| DAL / Delta Air Lines, Inc. | 0.09 | 0.00 | 4.36 | -19.51 | 0.1619 | -0.0385 | |||
| UAL / United Airlines Holdings, Inc. | 0.05 | 0.00 | 4.36 | -15.33 | 0.1618 | -0.0285 | |||
| GDX / VanEck ETF Trust - VanEck Gold Miners ETF | 0.09 | -38.24 | 4.32 | -21.25 | 0.1603 | -0.0425 | |||
| LMT / Lockheed Martin Corporation | 0.01 | 0.00 | 4.21 | 7.13 | 0.1563 | 0.0109 | |||
| NVR / NVR, Inc. | 0.00 | 0.00 | 4.14 | -1.78 | 0.1537 | -0.0022 | |||
| LOW / Lowe's Companies, Inc. | 0.02 | 0.00 | 4.12 | -9.21 | 0.1529 | -0.0149 | |||
| AXP / American Express Company | 0.01 | 0.00 | 4.05 | -2.29 | 0.1502 | -0.0030 | |||
| THC / Tenet Healthcare Corporation | 0.02 | 0.00 | 3.94 | 33.34 | 0.1462 | 0.0370 | |||
| FIX / Comfort Systems USA, Inc. | 0.01 | 0.00 | 3.93 | 31.60 | 0.1458 | 0.0354 | |||
| HPE / Hewlett Packard Enterprise Company | 0.22 | 0.00 | 3.86 | -12.78 | 0.1435 | -0.0204 | |||
| PYPL / PayPal Holdings, Inc. | 0.05 | 0.00 | 3.83 | -1.08 | 0.1424 | -0.0010 | |||
| PGR / The Progressive Corporation | 0.01 | 0.00 | 3.72 | 1.03 | 0.1380 | 0.0019 | |||
| LDOS / Leidos Holdings, Inc. | 0.02 | 0.00 | 3.67 | 14.29 | 0.1363 | 0.0175 | |||
| GOOGL / Alphabet Inc. | 0.02 | 0.00 | 3.65 | 0.86 | 0.1354 | 0.0016 | |||
| CF / CF Industries Holdings, Inc. | 0.04 | 0.00 | 3.60 | 11.96 | 0.1338 | 0.0147 | |||
| PG / The Procter & Gamble Company | 0.02 | 0.00 | 3.58 | -2.27 | 0.1329 | -0.0026 | |||
| ALL / The Allstate Corporation | 0.02 | 0.00 | 3.56 | 5.39 | 0.1322 | 0.0072 | |||
| HIG / The Hartford Insurance Group, Inc. | 0.03 | 0.00 | 3.55 | 9.77 | 0.1318 | 0.0122 | |||
| FFIV / F5, Inc. | 0.01 | 0.00 | 3.54 | -2.43 | 0.1314 | -0.0027 | |||
| EXPE / Expedia Group, Inc. | 0.02 | 0.00 | 3.54 | -15.78 | 0.1314 | -0.0240 | |||
| CSL / Carlisle Companies Incorporated | 0.01 | 0.00 | 3.52 | 11.55 | 0.1308 | 0.0140 | |||
| GWW / W.W. Grainger, Inc. | 0.00 | 0.00 | 3.46 | 6.49 | 0.1285 | 0.0083 | |||
| CL / Colgate-Palmolive Company | 0.04 | 0.00 | 3.46 | 1.95 | 0.1283 | 0.0029 | |||
| HD / The Home Depot, Inc. | 0.01 | 0.00 | 3.44 | -7.13 | 0.1277 | -0.0093 | |||
| DTE / DTE Energy Company | 0.02 | 0.00 | 3.32 | 2.18 | 0.1233 | 0.0031 | |||
| DOCU / DocuSign, Inc. | 0.04 | 0.00 | 3.32 | 6.54 | 0.1233 | 0.0080 | |||
| CRH / CRH plc | 0.04 | 0.00 | 3.27 | -11.06 | 0.1215 | -0.0146 | |||
| GEN / Gen Digital Inc. | 0.11 | 0.00 | 3.26 | 4.22 | 0.1211 | 0.0053 | |||
| UNH / UnitedHealth Group Incorporated | 0.01 | 0.00 | 3.24 | -36.44 | 0.1201 | -0.0682 | |||
| GS / The Goldman Sachs Group, Inc. | 0.01 | 0.00 | 3.22 | -3.51 | 0.1195 | -0.0039 | |||
| CCI / Crown Castle Inc. | 0.03 | 0.00 | 3.20 | 6.63 | 0.1188 | 0.0078 | |||
| RL / Ralph Lauren Corporation | 0.01 | 0.00 | 3.14 | 2.08 | 0.1166 | 0.0028 | |||
| UTHR / United Therapeutics Corporation | 0.01 | 0.00 | 3.10 | -0.35 | 0.1152 | -0.0000 | |||
| FNF / Fidelity National Financial, Inc. | 0.06 | 0.00 | 3.05 | -15.12 | 0.1132 | -0.0197 | |||
| EG / Everest Group, Ltd. | 0.01 | 0.00 | 3.05 | -1.71 | 0.1131 | -0.0015 | |||
| PHM / PulteGroup, Inc. | 0.03 | 0.00 | 3.04 | -5.09 | 0.1128 | -0.0056 | |||
| ZM / Zoom Communications Inc. | 0.04 | 0.00 | 3.03 | 10.24 | 0.1123 | 0.0108 | |||
| EWBC / East West Bancorp, Inc. | 0.03 | 0.00 | 2.99 | -3.43 | 0.1109 | -0.0035 | |||
| KLAC / KLA Corporation | 0.00 | 0.00 | 2.97 | 6.80 | 0.1102 | 0.0074 | |||
| CNC / Centene Corporation | 0.05 | 0.00 | 2.97 | -2.95 | 0.1101 | -0.0029 | |||
| TOL / Toll Brothers, Inc. | 0.03 | 0.00 | 2.95 | -6.62 | 0.1095 | -0.0073 | |||
| US21871X1090 / Corebridge Financial, Inc. | 0.09 | 0.00 | 2.95 | -5.97 | 0.1094 | -0.0065 | |||
| ALSN / Allison Transmission Holdings, Inc. | 0.03 | 0.00 | 2.94 | 1.77 | 0.1091 | 0.0023 | |||
| NRG / NRG Energy, Inc. | 0.02 | 0.00 | 2.92 | 47.47 | 0.1083 | 0.0351 | |||
| NTAP / NetApp, Inc. | 0.03 | 0.00 | 2.88 | -0.66 | 0.1067 | -0.0003 | |||
| LEN / Lennar Corporation | 0.03 | 0.00 | 2.85 | -11.32 | 0.1059 | -0.0131 | |||
| DBX / Dropbox, Inc. | 0.10 | 0.00 | 2.84 | 11.09 | 0.1053 | 0.0109 | |||
| ANET / Arista Networks Inc | 0.03 | 0.00 | 2.82 | -6.89 | 0.1048 | -0.0073 | |||
| VRT / Vertiv Holdings Co | 0.03 | 0.00 | 2.76 | 13.39 | 0.1025 | 0.0125 | |||
| RPRX / Royalty Pharma plc | 0.08 | 0.00 | 2.75 | -2.28 | 0.1020 | -0.0020 | |||
| IEFA / iShares Trust - iShares Core MSCI EAFE ETF | 0.03 | 0.00 | 2.69 | 9.52 | 0.1000 | 0.0090 | |||
| CMCSA / Comcast Corporation | 0.08 | 0.00 | 2.62 | -3.65 | 0.0971 | -0.0033 | |||
| TOKYO PRICE INDEX FUTURE JUN25 / DE (N/A) | 2.61 | 0.0969 | 0.0969 | ||||||
| AYI / Acuity Inc. | 0.01 | 0.00 | 2.59 | -12.54 | 0.0961 | -0.0134 | |||
| AMT / American Tower Corporation | 0.01 | 0.00 | 2.58 | 4.41 | 0.0958 | 0.0044 | |||
| APH / Amphenol Corporation | 0.03 | 0.00 | 2.54 | 35.03 | 0.0944 | 0.0248 | |||
| USFD / US Foods Holding Corp. | 0.03 | 0.00 | 2.53 | 10.38 | 0.0940 | 0.0092 | |||
| NI / NiSource Inc. | 0.06 | 0.00 | 2.52 | -3.11 | 0.0936 | -0.0026 | |||
| OC / Owens Corning | 0.02 | 0.00 | 2.50 | -13.07 | 0.0928 | -0.0135 | |||
| SYY / Sysco Corporation | 0.03 | 0.00 | 2.49 | -3.37 | 0.0926 | -0.0029 | |||
| BBY / Best Buy Co., Inc. | 0.04 | 0.00 | 2.37 | -26.28 | 0.0878 | -0.0309 | |||
| DHI / D.R. Horton, Inc. | 0.02 | 0.00 | 2.34 | -6.93 | 0.0868 | -0.0061 | |||
| EIX / Edison International | 0.04 | 0.00 | 2.31 | 2.21 | 0.0857 | 0.0022 | |||
| BK / The Bank of New York Mellon Corporation | 0.03 | 0.00 | 2.29 | -0.35 | 0.0852 | -0.0000 | |||
| LYB / LyondellBasell Industries N.V. | 0.04 | 0.00 | 2.29 | -26.48 | 0.0850 | -0.0302 | |||
| CAT / Caterpillar Inc. | 0.01 | 0.00 | 2.19 | 1.16 | 0.0812 | 0.0012 | |||
| FICO / Fair Isaac Corporation | 0.00 | 0.00 | 2.15 | -8.50 | 0.0799 | -0.0071 | |||
| CTAS / Cintas Corporation | 0.01 | 0.00 | 2.15 | 9.18 | 0.0799 | 0.0070 | |||
| EVRG / Evergy, Inc. | 0.03 | 0.00 | 2.15 | -3.63 | 0.0798 | -0.0027 | |||
| V / Visa Inc. | 0.01 | 0.00 | 2.14 | 0.71 | 0.0795 | 0.0008 | |||
| FTNT / Fortinet, Inc. | 0.02 | 0.00 | 2.11 | -5.76 | 0.0783 | -0.0045 | |||
| EXEL / Exelixis, Inc. | 0.05 | 0.00 | 2.10 | 11.22 | 0.0780 | 0.0081 | |||
| PRU / Prudential Financial, Inc. | 0.02 | 0.00 | 2.08 | -9.74 | 0.0771 | -0.0080 | |||
| INCY / Incyte Corporation | 0.03 | 0.00 | 2.00 | -11.51 | 0.0742 | -0.0093 | |||
| DECK / Deckers Outdoor Corporation | 0.02 | 0.00 | 1.98 | -24.27 | 0.0735 | -0.0232 | |||
| PKG / Packaging Corporation of America | 0.01 | 0.00 | 1.95 | -9.35 | 0.0724 | -0.0072 | |||
| LAMR / Lamar Advertising Company | 0.02 | 0.00 | 1.94 | -3.00 | 0.0721 | -0.0019 | |||
| TT / Trane Technologies plc | 0.00 | 0.00 | 1.92 | 21.62 | 0.0712 | 0.0129 | |||
| MAS / Masco Corporation | 0.03 | 0.00 | 1.84 | -17.00 | 0.0682 | -0.0136 | |||
| IBM / International Business Machines Corporation | 0.01 | 0.00 | 1.82 | 2.65 | 0.0676 | 0.0020 | |||
| CTRA / Coterra Energy Inc. | 0.07 | 0.00 | 1.67 | -9.94 | 0.0619 | -0.0066 | |||
| CI / The Cigna Group | 0.01 | 0.00 | 1.66 | 2.46 | 0.0618 | 0.0017 | |||
| COKE / Coca-Cola Consolidated, Inc. | 0.01 | 900.00 | 1.65 | -19.09 | 0.0611 | -0.0141 | |||
| MUSA / Murphy USA Inc. | 0.00 | 0.00 | 1.63 | -9.07 | 0.0603 | -0.0058 | |||
| MOH / Molina Healthcare, Inc. | 0.01 | 0.00 | 1.54 | 1.32 | 0.0570 | 0.0009 | |||
| SNX / TD SYNNEX Corporation | 0.01 | 0.00 | 1.51 | -11.76 | 0.0560 | -0.0072 | |||
| OVV / Ovintiv Inc. | 0.04 | 0.00 | 1.49 | -17.60 | 0.0553 | -0.0115 | |||
| VLO / Valero Energy Corporation | 0.01 | 0.00 | 1.49 | -1.33 | 0.0552 | -0.0005 | |||
| CINF / Cincinnati Financial Corporation | 0.01 | 0.00 | 1.48 | 2.07 | 0.0550 | 0.0013 | |||
| REGN / Regeneron Pharmaceuticals, Inc. | 0.00 | 0.00 | 1.39 | -29.84 | 0.0517 | -0.0217 | |||
| ELS / Equity LifeStyle Properties, Inc. | 0.02 | 0.00 | 1.38 | -7.31 | 0.0513 | -0.0038 | |||
| EURO STOXX 50 FUTURE JUN25 / DE (N/A) | 1.37 | 0.0507 | 0.0507 | ||||||
| UHS / Universal Health Services, Inc. | 0.01 | 0.00 | 1.35 | 8.62 | 0.0500 | 0.0041 | |||
| AXS / AXIS Capital Holdings Limited | 0.01 | 0.00 | 1.34 | 7.20 | 0.0497 | 0.0035 | |||
| XBI / SPDR Series Trust - SPDR S&P Biotech ETF | 0.02 | 1.33 | 0.0493 | 0.0493 | |||||
| RS / Reliance, Inc. | 0.00 | 0.00 | 1.28 | -1.47 | 0.0474 | -0.0005 | |||
| CUBE / CubeSmart | 0.03 | 0.00 | 1.22 | 3.55 | 0.0455 | 0.0017 | |||
| INGR / Ingredion Incorporated | 0.01 | 0.00 | 1.20 | 6.50 | 0.0444 | 0.0029 | |||
| PNC / The PNC Financial Services Group, Inc. | 0.01 | 0.00 | 1.19 | -9.44 | 0.0441 | -0.0044 | |||
| LPX / Louisiana-Pacific Corporation | 0.01 | 0.00 | 1.04 | -9.57 | 0.0386 | -0.0040 | |||
| OGE / OGE Energy Corp. | 0.02 | 0.00 | 0.95 | -3.93 | 0.0354 | -0.0013 | |||
| COF / Capital One Financial Corporation | 0.00 | 0.00 | 0.94 | -5.75 | 0.0347 | -0.0020 | |||
| HCA / HCA Healthcare, Inc. | 0.00 | 0.00 | 0.86 | 24.46 | 0.0319 | 0.0064 | |||
| CNM / Core & Main, Inc. | 0.02 | 0.00 | 0.85 | 7.44 | 0.0317 | 0.0023 | |||
| SEIC / SEI Investments Company | 0.01 | 0.00 | 0.85 | 6.50 | 0.0317 | 0.0020 | |||
| DVN / Devon Energy Corporation | 0.03 | 0.00 | 0.82 | -16.50 | 0.0305 | -0.0059 | |||
| AZO / AutoZone, Inc. | 0.00 | 0.00 | 0.77 | 6.78 | 0.0287 | 0.0019 | |||
| WPC / W. P. Carey Inc. | 0.01 | 0.00 | 0.69 | -2.28 | 0.0254 | -0.0005 | |||
| PCAR / PACCAR Inc | 0.01 | 0.00 | 0.64 | -12.50 | 0.0237 | -0.0033 | |||
| COR / Cencora, Inc. | 0.00 | 0.00 | 0.59 | 14.87 | 0.0218 | 0.0029 | |||
| KR / The Kroger Co. | 0.01 | 0.00 | 0.57 | 5.20 | 0.0210 | 0.0011 | |||
| URI / United Rentals, Inc. | 0.00 | 0.00 | 0.56 | 10.18 | 0.0209 | 0.0020 | |||
| TGT / Target Corporation | 0.01 | 0.00 | 0.56 | -24.33 | 0.0209 | -0.0066 | |||
| RF / Regions Financial Corporation | 0.03 | 0.00 | 0.55 | -9.54 | 0.0204 | -0.0021 | |||
| ETR / Entergy Corporation | 0.01 | 0.00 | 0.46 | -4.55 | 0.0171 | -0.0008 | |||
| ESS / Essex Property Trust, Inc. | 0.00 | 0.00 | 0.44 | -8.92 | 0.0163 | -0.0015 | |||
| SANM / Sanmina Corporation | 0.01 | -2.58 | 0.43 | 0.70 | 0.0161 | 0.0002 | |||
| FBP / First BanCorp. | 0.02 | -2.97 | 0.42 | -0.47 | 0.0158 | -0.0000 | |||
| VICI / VICI Properties Inc. | 0.01 | 0.00 | 0.42 | -2.58 | 0.0155 | -0.0003 | |||
| NTB / The Bank of N.T. Butterfield & Son Limited | 0.01 | -0.56 | 0.40 | 8.02 | 0.0150 | 0.0012 | |||
| IBOC / International Bancshares Corporation | 0.01 | 0.00 | 0.39 | -6.46 | 0.0145 | -0.0010 | |||
| OFG / OFG Bancorp | 0.01 | -0.79 | 0.38 | -4.06 | 0.0141 | -0.0005 | |||
| TMHC / Taylor Morrison Home Corporation | 0.01 | 0.00 | 0.38 | -8.76 | 0.0139 | -0.0013 | |||
| SKWD / Skyward Specialty Insurance Group, Inc. | 0.01 | -14.56 | 0.36 | 4.01 | 0.0135 | 0.0006 | |||
| JXN / Jackson Financial Inc. | 0.00 | 0.00 | 0.36 | -10.59 | 0.0135 | -0.0015 | |||
| CALM / Cal-Maine Foods, Inc. | 0.00 | 7.97 | 0.36 | 14.52 | 0.0132 | 0.0017 | |||
| ESNT / Essent Group Ltd. | 0.01 | 0.00 | 0.35 | 0.57 | 0.0131 | 0.0001 | |||
| SRCE / 1st Source Corporation | 0.01 | -0.81 | 0.34 | -7.36 | 0.0126 | -0.0010 | |||
| INVA / Innoviva, Inc. | 0.02 | 0.00 | 0.34 | 9.03 | 0.0126 | 0.0011 | |||
| BKH / Black Hills Corporation | 0.01 | 0.00 | 0.34 | -4.29 | 0.0124 | -0.0005 | |||
| FITB / Fifth Third Bancorp | 0.01 | 0.00 | 0.33 | -12.34 | 0.0124 | -0.0017 | |||
| QCRH / QCR Holdings, Inc. | 0.00 | 34.47 | 0.33 | 20.22 | 0.0124 | 0.0021 | |||
| TGNA / TEGNA Inc. | 0.02 | -3.50 | 0.33 | -11.44 | 0.0124 | -0.0015 | |||
| FFBC / First Financial Bancorp. | 0.01 | 0.00 | 0.33 | -11.97 | 0.0123 | -0.0016 | |||
| HWKN / Hawkins, Inc. | 0.00 | -4.07 | 0.33 | 22.22 | 0.0123 | 0.0022 | |||
| ADS / Bread Financial Holdings Inc | 0.01 | -16.06 | 0.33 | -20.34 | 0.0122 | -0.0031 | |||
| OSBC / Old Second Bancorp, Inc. | 0.02 | 1.29 | 0.33 | -8.66 | 0.0121 | -0.0011 | |||
| CATY / Cathay General Bancorp | 0.01 | 0.00 | 0.32 | -8.73 | 0.0121 | -0.0011 | |||
| MATX / Matson, Inc. | 0.00 | -13.72 | 0.32 | -32.35 | 0.0120 | -0.0057 | |||
| AMAL / Amalgamated Financial Corp. | 0.01 | 0.97 | 0.32 | -5.87 | 0.0119 | -0.0007 | |||
| APOG / Apogee Enterprises, Inc. | 0.01 | 12.04 | 0.32 | 107.24 | 0.0117 | 0.0063 | |||
| NSA / National Storage Affiliates Trust | 0.01 | 0.00 | 0.31 | -11.08 | 0.0117 | -0.0014 | |||
| CRVL / CorVel Corporation | 0.00 | 0.00 | 0.31 | 0.98 | 0.0115 | 0.0001 | |||
| NSIT / Insight Enterprises, Inc. | 0.00 | -73.58 | 0.29 | -42.44 | 0.0109 | -0.0072 | |||
| YELP / Yelp Inc. | 0.01 | 0.00 | 0.29 | 11.15 | 0.0108 | 0.0011 | |||
| REZI / Resideo Technologies, Inc. | 0.01 | 0.00 | 0.29 | 7.49 | 0.0107 | 0.0008 | |||
| CVLT / Commvault Systems, Inc. | 0.00 | -21.19 | 0.29 | -15.38 | 0.0106 | -0.0019 | |||
| BCC / Boise Cascade Company | 0.00 | 0.00 | 0.28 | -16.32 | 0.0105 | -0.0020 | |||
| SFNC / Simmons First National Corporation | 0.01 | 0.00 | 0.28 | -14.72 | 0.0103 | -0.0017 | |||
| AGX / Argan, Inc. | 0.00 | -22.14 | 0.28 | 25.79 | 0.0103 | 0.0021 | |||
| TPH / Tri Pointe Homes, Inc. | 0.01 | 0.00 | 0.27 | -6.80 | 0.0102 | -0.0007 | |||
| MD / Pediatrix Medical Group, Inc. | 0.02 | -13.11 | 0.27 | -16.87 | 0.0101 | -0.0020 | |||
| TROW / T. Rowe Price Group, Inc. | 0.00 | 0.00 | 0.27 | -11.48 | 0.0100 | -0.0013 | |||
| HAFC / Hanmi Financial Corporation | 0.01 | 3.82 | 0.27 | -0.74 | 0.0100 | -0.0001 | |||
| KBH / KB Home | 0.01 | 0.00 | 0.27 | -15.46 | 0.0100 | -0.0018 | |||
| ATEN / A10 Networks, Inc. | 0.02 | 0.00 | 0.26 | -17.03 | 0.0098 | -0.0020 | |||
| HOPE / Hope Bancorp, Inc. | 0.03 | -6.53 | 0.26 | -14.10 | 0.0098 | -0.0016 | |||
| ZD / Ziff Davis, Inc. | 0.01 | 0.00 | 0.26 | -21.08 | 0.0098 | -0.0025 | |||
| CTBI / Community Trust Bancorp, Inc. | 0.01 | 0.00 | 0.26 | -6.47 | 0.0097 | -0.0006 | |||
| GIII / G-III Apparel Group, Ltd. | 0.01 | 0.00 | 0.26 | 7.56 | 0.0095 | 0.0007 | |||
| STRL / Sterling Infrastructure, Inc. | 0.00 | -31.24 | 0.26 | 1.59 | 0.0095 | 0.0002 | |||
| DCOM / Dime Community Bancshares, Inc. | 0.01 | 0.25 | 0.0094 | 0.0094 | |||||
| VBTX / Veritex Holdings, Inc. | 0.01 | -8.14 | 0.25 | -15.44 | 0.0094 | -0.0017 | |||
| HWC / Hancock Whitney Corporation | 0.00 | -37.37 | 0.25 | -40.19 | 0.0093 | -0.0062 | |||
| PECO / Phillips Edison & Company, Inc. | 0.01 | -18.60 | 0.25 | -22.36 | 0.0093 | -0.0026 | |||
| WABC / Westamerica Bancorporation | 0.01 | 0.00 | 0.25 | -7.81 | 0.0092 | -0.0007 | |||
| CASH / Pathward Financial, Inc. | 0.00 | -35.14 | 0.25 | -34.56 | 0.0092 | -0.0048 | |||
| STLD / Steel Dynamics, Inc. | 0.00 | 0.00 | 0.25 | -8.86 | 0.0092 | -0.0009 | |||
| BNL / Broadstone Net Lease, Inc. | 0.02 | -17.57 | 0.25 | -22.22 | 0.0091 | -0.0026 | |||
| UVE / Universal Insurance Holdings, Inc. | 0.01 | 1.74 | 0.24 | 24.23 | 0.0090 | 0.0018 | |||
| EPRT / Essential Properties Realty Trust, Inc. | 0.01 | 64.33 | 0.24 | 63.70 | 0.0089 | 0.0035 | |||
| WINA / Winmark Corporation | 0.00 | 0.00 | 0.24 | 26.60 | 0.0089 | 0.0019 | |||
| JBL / Jabil Inc. | 0.00 | 0.00 | 0.24 | 8.68 | 0.0089 | 0.0007 | |||
| SR / Spire Inc. | 0.00 | -1.38 | 0.24 | -3.67 | 0.0088 | -0.0003 | |||
| MRC / MRC Global Inc. | 0.02 | 0.24 | 0.0087 | 0.0087 | |||||
| SIG / Signet Jewelers Limited | 0.00 | -9.85 | 0.23 | -40.26 | 0.0087 | -0.0054 | |||
| EXTR / Extreme Networks, Inc. | 0.01 | 0.00 | 0.23 | 1.33 | 0.0085 | 0.0002 | |||
| LXP / LXP Industrial Trust | 0.03 | 0.23 | 0.0085 | 0.0085 | |||||
| TNK / Teekay Tankers Ltd. | 0.01 | -43.67 | 0.23 | -34.20 | 0.0085 | -0.0044 | |||
| DLX / Deluxe Corporation | 0.02 | 0.00 | 0.23 | -13.26 | 0.0085 | -0.0013 | |||
| COCO / The Vita Coco Company, Inc. | 0.01 | 1.08 | 0.23 | 11.17 | 0.0085 | 0.0009 | |||
| YOU / Clear Secure, Inc. | 0.01 | 0.00 | 0.23 | 4.11 | 0.0085 | 0.0004 | |||
| NAGE / Niagen Bioscience, Inc. | 0.02 | 0.23 | 0.0084 | 0.0084 | |||||
| KRG / Kite Realty Group Trust | 0.01 | -37.87 | 0.22 | -40.11 | 0.0083 | -0.0055 | |||
| DOLE / Dole plc | 0.02 | 0.00 | 0.22 | -3.04 | 0.0083 | -0.0002 | |||
| GEF / Greif, Inc. | 0.00 | -4.80 | 0.22 | -7.59 | 0.0081 | -0.0006 | |||
| BXC / BlueLinx Holdings Inc. | 0.00 | 0.00 | 0.22 | -15.83 | 0.0081 | -0.0015 | |||
| RHP / Ryman Hospitality Properties, Inc. | 0.00 | -13.70 | 0.22 | -15.23 | 0.0081 | -0.0014 | |||
| UTL / Unitil Corporation | 0.00 | 0.22 | 0.0081 | 0.0081 | |||||
| LNTH / Lantheus Holdings, Inc. | 0.00 | 27.58 | 0.22 | 2.84 | 0.0081 | 0.0002 | |||
| IDT / IDT Corporation | 0.00 | 0.00 | 0.22 | 26.90 | 0.0081 | 0.0017 | |||
| CVBF / CVB Financial Corp. | 0.01 | 0.00 | 0.22 | -7.30 | 0.0080 | -0.0006 | |||
| BKE / The Buckle, Inc. | 0.01 | 0.00 | 0.22 | 6.40 | 0.0080 | 0.0005 | |||
| TK / Teekay Corporation Ltd. | 0.03 | 9.83 | 0.22 | 42.11 | 0.0080 | 0.0024 | |||
| SIGA / SIGA Technologies, Inc. | 0.04 | -28.20 | 0.22 | -21.82 | 0.0080 | -0.0022 | |||
| SNCY / Sun Country Airlines Holdings, Inc. | 0.02 | 0.00 | 0.22 | -28.09 | 0.0080 | -0.0031 | |||
| CARG / CarGurus, Inc. | 0.01 | 0.00 | 0.21 | -2.73 | 0.0080 | -0.0002 | |||
| TRNO / Terreno Realty Corporation | 0.00 | -35.60 | 0.21 | -40.06 | 0.0080 | -0.0050 | |||
| PGNY / Progyny, Inc. | 0.01 | 11.95 | 0.21 | 7.07 | 0.0079 | 0.0005 | |||
| KFY / Korn Ferry | 0.00 | -39.73 | 0.21 | -37.76 | 0.0079 | -0.0047 | |||
| LADR / Ladder Capital Corp | 0.02 | -13.26 | 0.21 | -22.96 | 0.0077 | -0.0023 | |||
| SFM / Sprouts Farmers Market, Inc. | 0.00 | 0.00 | 0.21 | 16.29 | 0.0077 | 0.0011 | |||
| KTB / Kontoor Brands, Inc. | 0.00 | 2.09 | 0.21 | 7.81 | 0.0077 | 0.0006 | |||
| IART / Integra LifeSciences Holdings Corporation | 0.02 | 0.21 | 0.0077 | 0.0077 | |||||
| FCPT / Four Corners Property Trust, Inc. | 0.01 | 0.20 | 0.0075 | 0.0075 | |||||
| INSW / International Seaways, Inc. | 0.01 | 0.00 | 0.20 | 10.99 | 0.0075 | 0.0008 | |||
| AHCO / AdaptHealth Corp. | 0.02 | -33.93 | 0.20 | -40.88 | 0.0075 | -0.0048 | |||
| MGEE / MGE Energy, Inc. | 0.00 | 54.02 | 0.20 | 51.52 | 0.0075 | 0.0026 | |||
| SIGI / Selective Insurance Group, Inc. | 0.00 | 0.00 | 0.20 | 2.09 | 0.0073 | 0.0002 | |||
| QLYS / Qualys, Inc. | 0.00 | 0.00 | 0.20 | 5.41 | 0.0073 | 0.0004 | |||
| FTDR / Frontdoor, Inc. | 0.00 | -49.80 | 0.19 | -19.83 | 0.0072 | -0.0022 | |||
| ANDE / The Andersons, Inc. | 0.01 | 12.20 | 0.19 | -7.18 | 0.0072 | -0.0005 | |||
| SM / SM Energy Company | 0.01 | 123.58 | 0.19 | 3.74 | 0.0072 | 0.0003 | |||
| PJT / PJT Partners Inc. | 0.00 | 0.00 | 0.19 | -5.39 | 0.0072 | -0.0004 | |||
| LQDT / Liquidity Services, Inc. | 0.01 | 30.26 | 0.19 | -9.00 | 0.0071 | -0.0007 | |||
| US71880K1016 / Phinia Inc | 0.00 | 16.48 | 0.19 | 2.67 | 0.0071 | 0.0002 | |||
| OFC / Corporate Office Properties Trust | 0.01 | -41.11 | 0.19 | -40.13 | 0.0071 | -0.0047 | |||
| SLVM / Sylvamo Corporation | 0.00 | 5.63 | 0.19 | -21.49 | 0.0071 | -0.0019 | |||
| HURN / Huron Consulting Group Inc. | 0.00 | 2.30 | 0.19 | -4.04 | 0.0071 | -0.0003 | |||
| CABO / Cable One, Inc. | 0.00 | 0.19 | 0.0071 | 0.0071 | |||||
| EPC / Edgewell Personal Care Company | 0.01 | 0.19 | 0.0070 | 0.0070 | |||||
| LZ / LegalZoom.com, Inc. | 0.02 | 0.19 | 0.0070 | 0.0070 | |||||
| CTRE / CareTrust REIT, Inc. | 0.01 | 10.48 | 0.19 | 22.88 | 0.0070 | 0.0013 | |||
| SCS / Steelcase Inc. | 0.02 | -46.99 | 0.19 | -47.61 | 0.0069 | -0.0057 | |||
| MBC / MasterBrand, Inc. | 0.02 | 6.69 | 0.19 | -22.27 | 0.0069 | -0.0019 | |||
| HUBG / Hub Group, Inc. | 0.01 | 0.00 | 0.18 | -17.78 | 0.0069 | -0.0015 | |||
| SCSC / ScanSource, Inc. | 0.00 | 10.32 | 0.18 | 21.85 | 0.0069 | 0.0012 | |||
| IPAR / Interparfums, Inc. | 0.00 | 0.18 | 0.0068 | 0.0068 | |||||
| IMKTA / Ingles Markets, Incorporated | 0.00 | 0.00 | 0.18 | 1.67 | 0.0068 | 0.0001 | |||
| MHO / M/I Homes, Inc. | 0.00 | -31.74 | 0.18 | -37.76 | 0.0068 | -0.0041 | |||
| TNET / TriNet Group, Inc. | 0.00 | 17.66 | 0.18 | -4.79 | 0.0067 | -0.0001 | |||
| WGO / Winnebago Industries, Inc. | 0.01 | 0.00 | 0.18 | -15.96 | 0.0067 | -0.0012 | |||
| HG / Hamilton Insurance Group, Ltd. | 0.01 | 26.05 | 0.18 | 40.48 | 0.0066 | 0.0019 | |||
| JBSS / John B. Sanfilippo & Son, Inc. | 0.00 | -7.29 | 0.18 | -18.52 | 0.0065 | -0.0015 | |||
| CNXN / PC Connection, Inc. | 0.00 | -27.81 | 0.17 | -26.27 | 0.0065 | -0.0022 | |||
| 6VH / Franklin BSP Realty Trust, Inc. | 0.02 | 0.17 | 0.0065 | 0.0065 | |||||
| UFPI / UFP Industries, Inc. | 0.00 | -49.41 | 0.17 | -53.85 | 0.0065 | -0.0075 | |||
| EBF / Ennis, Inc. | 0.01 | 0.17 | 0.0064 | 0.0064 | |||||
| SLG / SL Green Realty Corp. | 0.00 | 0.17 | 0.0063 | 0.0063 | |||||
| NHI / National Health Investors, Inc. | 0.00 | -21.72 | 0.17 | -8.70 | 0.0063 | -0.0003 | |||
| SXC / SunCoke Energy, Inc. | 0.02 | 0.17 | 0.0062 | 0.0062 | |||||
| NTCT / NetScout Systems, Inc. | 0.01 | 2.34 | 0.17 | 3.77 | 0.0062 | 0.0003 | |||
| UE / Urban Edge Properties | 0.01 | 0.17 | 0.0061 | 0.0061 | |||||
| AHR / American Healthcare REIT, Inc. | 0.00 | 0.17 | 0.0061 | 0.0061 | |||||
| MLKN / MillerKnoll, Inc. | 0.01 | 0.00 | 0.17 | -21.43 | 0.0061 | -0.0017 | |||
| AMWD / American Woodmark Corporation | 0.00 | 0.00 | 0.16 | -9.39 | 0.0061 | -0.0006 | |||
| CRCT / Cricut, Inc. | 0.03 | 0.16 | 0.0061 | 0.0061 | |||||
| PCH / PotlatchDeltic Corporation | 0.00 | -38.06 | 0.16 | -47.76 | 0.0061 | -0.0055 | |||
| PRDO / Perdoceo Education Corporation | 0.00 | -36.80 | 0.16 | -15.98 | 0.0061 | -0.0011 | |||
| SBRA / Sabra Health Care REIT, Inc. | 0.01 | -55.37 | 0.16 | -53.18 | 0.0060 | -0.0068 | |||
| ZEUS / Olympic Steel, Inc. | 0.01 | 0.16 | 0.0060 | 0.0060 | |||||
| MAC / The Macerich Company | 0.01 | -27.87 | 0.16 | -35.34 | 0.0060 | -0.0032 | |||
| BLDR / Builders FirstSource, Inc. | 0.00 | 0.00 | 0.16 | -22.55 | 0.0059 | -0.0017 | |||
| AAMI / Acadian Asset Management Inc. | 0.01 | -8.88 | 0.16 | 11.51 | 0.0058 | 0.0006 | |||
| GFF / Griffon Corporation | 0.00 | 0.00 | 0.15 | -4.94 | 0.0057 | -0.0003 | |||
| CBT / Cabot Corporation | 0.00 | 0.15 | 0.0057 | 0.0057 | |||||
| ADEA / Adeia Inc. | 0.01 | 0.15 | 0.0057 | 0.0057 | |||||
| MCRI / Monarch Casino & Resort, Inc. | 0.00 | 0.15 | 0.0057 | 0.0057 | |||||
| PBH / Prestige Consumer Healthcare Inc. | 0.00 | -30.18 | 0.15 | -29.17 | 0.0057 | -0.0023 | |||
| LOB / Live Oak Bancshares, Inc. | 0.01 | -29.26 | 0.15 | -38.96 | 0.0056 | -0.0036 | |||
| RES / RPC, Inc. | 0.03 | 0.00 | 0.15 | -20.53 | 0.0056 | -0.0014 | |||
| ASIX / AdvanSix Inc. | 0.01 | 0.15 | 0.0056 | 0.0056 | |||||
| WRLD / World Acceptance Corporation | 0.00 | -78.98 | 0.15 | -51.30 | 0.0056 | -0.0060 | |||
| JAKK / JAKKS Pacific, Inc. | 0.01 | 79.47 | 0.15 | 34.55 | 0.0055 | 0.0014 | |||
| CNS / Cohen & Steers, Inc. | 0.00 | 0.14 | 0.0053 | 0.0053 | |||||
| APLE / Apple Hospitality REIT, Inc. | 0.01 | -42.16 | 0.14 | -55.59 | 0.0053 | -0.0071 | |||
| IBP / Installed Building Products, Inc. | 0.00 | 0.14 | 0.0053 | 0.0053 | |||||
| MUR / Murphy Oil Corporation | 0.01 | 0.00 | 0.14 | -21.11 | 0.0053 | -0.0014 | |||
| SPTN / SpartanNash Company | 0.01 | 0.00 | 0.14 | -4.08 | 0.0053 | -0.0002 | |||
| STNG / Scorpio Tankers Inc. | 0.00 | 0.00 | 0.14 | 0.00 | 0.0053 | 0.0000 | |||
| NECB / Northeast Community Bancorp, Inc. | 0.01 | 236.16 | 0.14 | 228.57 | 0.0052 | 0.0036 | |||
| AKR / Acadia Realty Trust | 0.01 | -53.63 | 0.14 | -65.49 | 0.0051 | -0.0093 | |||
| CCSI / Consensus Cloud Solutions, Inc. | 0.01 | 96.88 | 0.14 | 67.07 | 0.0051 | 0.0020 | |||
| GNK / Genco Shipping & Trading Limited | 0.01 | 0.00 | 0.14 | -7.48 | 0.0051 | -0.0004 | |||
| HCKT / The Hackett Group, Inc. | 0.01 | -74.96 | 0.14 | -51.25 | 0.0051 | -0.0049 | |||
| ARI / Apollo Commercial Real Estate Finance, Inc. | 0.01 | -39.06 | 0.13 | -41.15 | 0.0050 | -0.0034 | |||
| EGBN / Eagle Bancorp, Inc. | 0.01 | -15.87 | 0.13 | -36.54 | 0.0049 | -0.0028 | |||
| SKT / Tanger Inc. | 0.00 | -78.32 | 0.13 | -46.31 | 0.0049 | -0.0039 | |||
| BOX / Box, Inc. | 0.00 | 1.88 | 0.13 | 17.12 | 0.0049 | 0.0008 | |||
| ACCO / ACCO Brands Corporation | 0.04 | 99.54 | 0.13 | 10.17 | 0.0049 | 0.0006 | |||
| MLI / Mueller Industries, Inc. | 0.00 | -60.92 | 0.13 | -62.21 | 0.0048 | -0.0079 | |||
| PLAB / Photronics, Inc. | 0.01 | -1.28 | 0.13 | -20.73 | 0.0048 | -0.0012 | |||
| KLIC / Kulicke and Soffa Industries, Inc. | 0.00 | -27.37 | 0.13 | -38.94 | 0.0047 | -0.0030 | |||
| CMC / Commercial Metals Company | 0.00 | 0.00 | 0.13 | -3.82 | 0.0047 | -0.0002 | |||
| CNO / CNO Financial Group, Inc. | 0.00 | -62.90 | 0.12 | -66.30 | 0.0046 | -0.0090 | |||
| NMRK / Newmark Group, Inc. | 0.01 | 0.12 | 0.0046 | 0.0046 | |||||
| REX / REX American Resources Corporation | 0.00 | -22.85 | 0.12 | -15.75 | 0.0046 | -0.0008 | |||
| MFA / MFA Financial, Inc. | 0.01 | 0.12 | 0.0045 | 0.0045 | |||||
| IRMD / IRADIMED CORPORATION | 0.00 | 0.12 | 0.0045 | 0.0045 | |||||
| UNTY / Unity Bancorp, Inc. | 0.00 | 0.12 | 0.0045 | 0.0045 | |||||
| CWK / Cushman & Wakefield plc | 0.01 | 0.12 | 0.0044 | 0.0044 | |||||
| COLL / Collegium Pharmaceutical, Inc. | 0.00 | -2.78 | 0.12 | -2.54 | 0.0043 | -0.0001 | |||
| ADUS / Addus HomeCare Corporation | 0.00 | -42.93 | 0.11 | -33.72 | 0.0042 | -0.0021 | |||
| MTDR / Matador Resources Company | 0.00 | 0.00 | 0.11 | -18.12 | 0.0042 | -0.0009 | |||
| DEI / Douglas Emmett, Inc. | 0.01 | 0.11 | 0.0041 | 0.0041 | |||||
| APAM / Artisan Partners Asset Management Inc. | 0.00 | 0.11 | 0.0041 | 0.0041 | |||||
| EXLS / ExlService Holdings, Inc. | 0.00 | 4.13 | 0.11 | -0.90 | 0.0041 | -0.0000 | |||
| CCNE / CNB Financial Corporation | 0.00 | 0.11 | 0.0040 | 0.0040 | |||||
| RNGR / Ranger Energy Services, Inc. | 0.01 | 0.11 | 0.0040 | 0.0040 | |||||
| FC / Franklin Covey Co. | 0.00 | 1.67 | 0.10 | -25.90 | 0.0039 | -0.0013 | |||
| ATLC / Atlanticus Holdings Corporation | 0.00 | 0.10 | 0.0038 | 0.0038 | |||||
| BELFB / Bel Fuse Inc. | 0.00 | -67.82 | 0.10 | -71.67 | 0.0037 | -0.0094 | |||
| RM / Regional Management Corp. | 0.00 | 0.10 | 0.0036 | 0.0036 | |||||
| PRG / PROG Holdings, Inc. | 0.00 | -45.79 | 0.10 | -45.14 | 0.0036 | -0.0029 | |||
| WHD / Cactus, Inc. | 0.00 | 0.00 | 0.09 | -22.50 | 0.0035 | -0.0010 | |||
| TEX / Terex Corporation | 0.00 | -64.99 | 0.09 | -61.28 | 0.0034 | -0.0053 | |||
| SHO / Sunstone Hotel Investors, Inc. | 0.01 | -64.87 | 0.09 | -64.84 | 0.0033 | -0.0066 | |||
| SEM / Select Medical Holdings Corporation | 0.01 | -2.32 | 0.09 | -18.52 | 0.0033 | -0.0007 | |||
| ASC / Ardmore Shipping Corporation | 0.01 | -48.84 | 0.09 | -45.96 | 0.0033 | -0.0027 | |||
| LBRT / Liberty Energy Inc. | 0.01 | -27.14 | 0.09 | -51.14 | 0.0032 | -0.0033 | |||
| NATH / Nathan's Famous, Inc. | 0.00 | 0.09 | 0.0032 | 0.0032 | |||||
| ASGN / ASGN Incorporated | 0.00 | -51.32 | 0.08 | -62.16 | 0.0032 | -0.0051 | |||
| DVA / DaVita Inc. | 0.00 | 0.00 | 0.08 | -7.87 | 0.0031 | -0.0002 | |||
| HBB / Hamilton Beach Brands Holding Company | 0.00 | 0.08 | 0.0029 | 0.0029 | |||||
| IMMR / Immersion Corporation | 0.01 | -29.05 | 0.08 | -34.19 | 0.0029 | -0.0014 | |||
| AMKR / Amkor Technology, Inc. | 0.00 | -25.03 | 0.08 | -36.13 | 0.0028 | -0.0016 | |||
| JW.A / John Wiley & Sons Inc. - Class A | 0.00 | -45.30 | 0.07 | -46.72 | 0.0027 | -0.0024 | |||
| COMP / Compass, Inc. | 0.01 | 0.07 | 0.0026 | 0.0026 | |||||
| IIPR / Innovative Industrial Properties, Inc. | 0.00 | -59.16 | 0.07 | -68.81 | 0.0025 | -0.0055 | |||
| VRNT / Verint Systems Inc. | 0.00 | -56.45 | 0.06 | -66.14 | 0.0024 | -0.0046 | |||
| AN / AutoNation, Inc. | 0.00 | 0.00 | 0.06 | 1.61 | 0.0024 | 0.0000 | |||
| BRY / Berry Corporation | 0.02 | -5.39 | 0.05 | -44.33 | 0.0020 | -0.0016 | |||
| EPM / Evolution Petroleum Corporation | 0.01 | 0.05 | 0.0020 | 0.0020 | |||||
| CADE / Cadence Bank | 0.00 | -86.82 | 0.03 | -88.10 | 0.0012 | -0.0088 | |||
| ALEX / Alexander & Baldwin, Inc. | 0.00 | -89.18 | 0.03 | -89.32 | 0.0009 | -0.0078 | |||
| MTUS / Metallus Inc. | 0.00 | -82.51 | 0.02 | -84.77 | 0.0009 | -0.0047 | |||
| OGS / ONE Gas, Inc. | 0.00 | -95.58 | 0.02 | -95.66 | 0.0006 | -0.0139 | |||
| AMR / Alpha Metallurgical Resources, Inc. | 0.00 | -81.05 | 0.01 | -85.42 | 0.0006 | -0.0030 | |||
| JOE / The St. Joe Company | 0.00 | -90.10 | 0.01 | -91.43 | 0.0005 | -0.0047 | |||
| CPRX / Catalyst Pharmaceuticals, Inc. | 0.00 | -96.48 | 0.01 | -96.30 | 0.0004 | -0.0096 | |||
| CNR / Core Natural Resources, Inc. | 0.00 | -97.08 | 0.01 | -97.55 | 0.0003 | -0.0103 | |||
| RMAX / RE/MAX Holdings, Inc. | 0.00 | -80.33 | 0.01 | -84.62 | 0.0002 | -0.0012 | |||
| BBW / Build-A-Bear Workshop, Inc. | 0.00 | -98.54 | 0.00 | -98.38 | 0.0002 | -0.0090 | |||
| ESRT / Empire State Realty Trust, Inc. | 0.00 | -98.51 | 0.00 | -98.78 | 0.0001 | -0.0120 | |||
| HOV / Hovnanian Enterprises, Inc. | 0.00 | -98.15 | 0.00 | -98.59 | 0.0001 | -0.0078 | |||
| ECVT / Ecovyst Inc. | 0.00 | -98.23 | 0.00 | -98.30 | 0.0001 | -0.0064 | |||
| VCEL / Vericel Corporation | 0.00 | -98.49 | 0.00 | -98.91 | 0.0001 | -0.0100 | |||
| HRMY / Harmony Biosciences Holdings, Inc. | 0.00 | -99.06 | 0.00 | -99.32 | 0.0001 | -0.0108 | |||
| OPCH / Option Care Health, Inc. | 0.00 | -98.29 | 0.00 | -98.75 | 0.0001 | -0.0058 | |||
| ACAD / ACADIA Pharmaceuticals Inc. | 0.00 | -99.08 | 0.00 | -99.23 | 0.0001 | -0.0096 | |||
| PCRX / Pacira BioSciences, Inc. | 0.00 | -99.18 | 0.00 | -99.55 | 0.0001 | -0.0082 | |||
| MOV / Movado Group, Inc. | 0.00 | -98.61 | 0.00 | -99.36 | 0.0001 | -0.0057 | |||
| TWI / Titan International, Inc. | 0.00 | -98.44 | 0.00 | -99.20 | 0.0001 | -0.0046 | |||
| VCYT / Veracyte, Inc. | 0.00 | -99.57 | 0.00 | -100.00 | 0.0000 | -0.0104 | |||
| CORT / Corcept Therapeutics Incorporated | 0.00 | -99.79 | 0.00 | -100.00 | 0.0000 | -0.0053 | |||
| SCVL / Shoe Carnival, Inc. | 0.00 | -99.83 | 0.00 | -100.00 | 0.0000 | -0.0076 | |||
| DEA / Easterly Government Properties, Inc. | 0.00 | 0.00 | 0.0000 | 0.0000 | |||||
| INMD / InMode Ltd. | 0.00 | -100.00 | 0.00 | -100.00 | -0.0081 | ||||
| VOO / Vanguard Index Funds - Vanguard S&P 500 ETF | 0.00 | -100.00 | 0.00 | -100.00 | -3.7131 | ||||
| XHR / Xenia Hotels & Resorts, Inc. | 0.00 | -100.00 | 0.00 | -100.00 | -0.0047 | ||||
| INSM / Insmed Incorporated | 0.00 | -100.00 | 0.00 | -100.00 | -0.0041 | ||||
| SWISS MKT IX FUTR JUN25 / DE (N/A) | -0.55 | -0.0206 | -0.0206 | ||||||
| FTSE 100 INDEX FUTURE JUN25 / DE (N/A) | -1.20 | -0.0445 | -0.0445 |