Statistik Asas
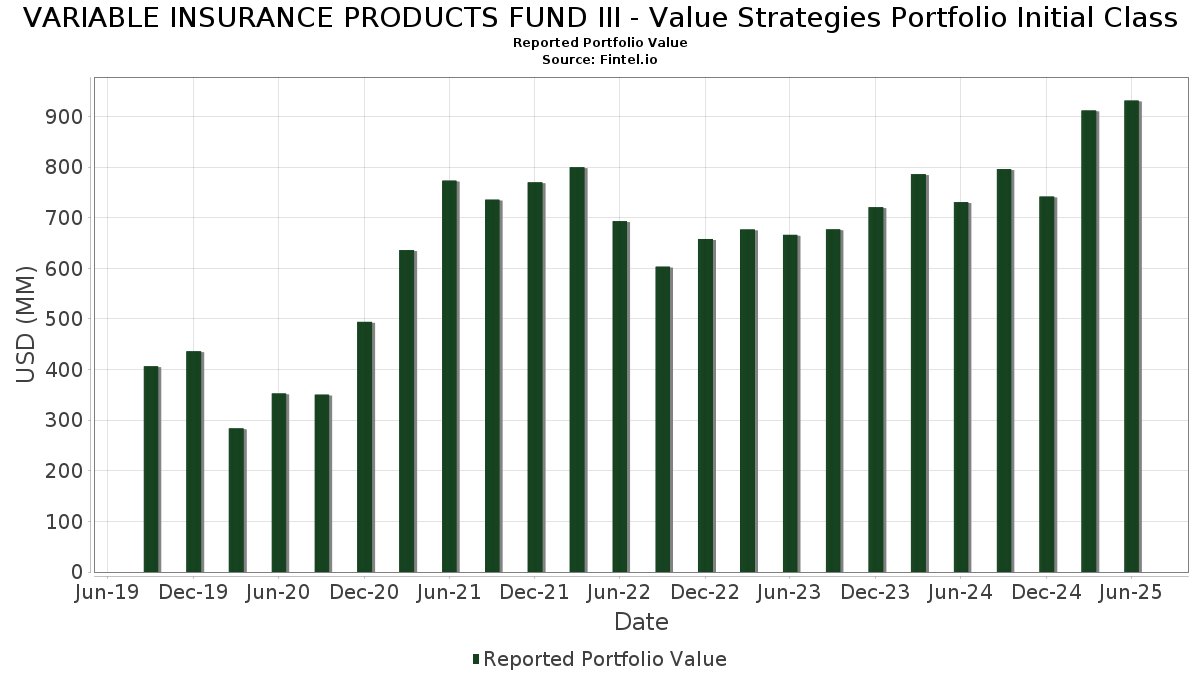
| Nilai Portfolio | $ 931,507,992 |
| Kedudukan Semasa | 116 |
Pegangan Terkini, Prestasi, AUM (dari 13F, 13D)
VARIABLE INSURANCE PRODUCTS FUND III - Value Strategies Portfolio Initial Class telah mendedahkan 116 jumlah pegangan dalam pemfailan SEC terkini mereka. Nilai portfolio terkini dikira sebagai $ 931,507,992 USD. Aset Sebenar Di Bawah Pengurusan (AUM) ialah nilai ini ditambah dengan tunai (yang tidak didedahkan). Pegangan teratas VARIABLE INSURANCE PRODUCTS FUND III - Value Strategies Portfolio Initial Class ialah Fidelity Securities Lending Cash Central Fund (US:US31635A3032) , Fidelity Cash Central Fund (US:US31635A1051) , Molina Healthcare, Inc. (US:MOH) , Imperial Oil Limited (US:IMO) , and CVS Health Corporation (US:CVS) . Kedudukan baharu VARIABLE INSURANCE PRODUCTS FUND III - Value Strategies Portfolio Initial Class termasuk Primo Brands Corporation (US:PRMB) , Mr. Cooper Group Inc. (US:COOP) , IQVIA Holdings Inc. (US:IQV) , TopBuild Corp. (US:BLD) , and Constellation Brands, Inc. (US:STZ) .
Kenaikan Teratas Suku Tahun Ini
Kami menggunakan perubahan dalam peruntukan portfolio kerana ini adalah metrik yang paling bermakna. Perubahan boleh disebabkan oleh perdagangan atau perubahan dalam harga saham.
| Sekuriti | Saham (MM) |
Nilai (MM$) |
Portfolio % | ΔPortfolio % |
|---|---|---|---|---|
| 14.36 | 14.36 | 1.6362 | 1.5255 | |
| 0.30 | 8.76 | 0.9978 | 0.9978 | |
| 0.06 | 8.56 | 0.9757 | 0.9757 | |
| 0.05 | 7.95 | 0.9051 | 0.9051 | |
| 0.02 | 7.87 | 0.8962 | 0.8962 | |
| 0.05 | 7.82 | 0.8914 | 0.8914 | |
| 0.16 | 10.01 | 1.1408 | 0.7833 | |
| 0.08 | 7.25 | 0.8259 | 0.7444 | |
| 0.27 | 9.72 | 1.1078 | 0.5668 | |
| 0.05 | 4.41 | 0.5022 | 0.5022 |
Penurunan Teratas Suku Tahun Ini
Kami menggunakan perubahan dalam peruntukan portfolio kerana ini adalah metrik yang paling bermakna. Perubahan boleh disebabkan oleh perdagangan atau perubahan dalam harga saham.
| Sekuriti | Saham (MM) |
Nilai (MM$) |
Portfolio % | ΔPortfolio % |
|---|---|---|---|---|
| 0.02 | 5.96 | 0.6792 | -0.9446 | |
| 0.02 | 1.18 | 0.1341 | -0.8812 | |
| 0.01 | 2.39 | 0.2719 | -0.7554 | |
| 0.12 | 9.33 | 1.0632 | -0.7247 | |
| 0.17 | 10.98 | 1.2503 | -0.6421 | |
| 0.02 | 6.71 | 0.7646 | -0.5771 | |
| 0.14 | 2.40 | 0.2738 | -0.5379 | |
| 0.08 | 9.63 | 1.0966 | -0.5237 | |
| 0.05 | 8.39 | 0.9562 | -0.5201 | |
| 0.02 | 1.82 | 0.2069 | -0.4730 |
13F dan Pemfailan Dana
Borang ini telah difailkan pada 2025-08-22 untuk tempoh pelaporan 2025-06-30. Klik ikon pautan untuk melihat sejarah transaksi penuh.
Tingkatkan untuk membuka data premium dan eksport ke Excel ![]() .
.
| Sekuriti | Jenis | Purata Harga Saham | Saham (MM) |
ΔSaham (%) |
ΔSaham (%) |
Nilai ($MM) |
Portfolio (%) |
ΔPortfolio (%) |
|
|---|---|---|---|---|---|---|---|---|---|
| US31635A3032 / Fidelity Securities Lending Cash Central Fund | 59.13 | 9.72 | 59.14 | 9.72 | 6.7371 | 0.4567 | |||
| US31635A1051 / Fidelity Cash Central Fund | 14.36 | 1,410.78 | 14.36 | 1,411.89 | 1.6362 | 1.5255 | |||
| MOH / Molina Healthcare, Inc. | 0.05 | -3.89 | 13.97 | -13.08 | 1.5916 | -0.2813 | |||
| IMO / Imperial Oil Limited | 0.17 | 0.58 | 13.66 | 10.62 | 1.5566 | 0.1173 | |||
| CVS / CVS Health Corporation | 0.19 | -19.28 | 13.43 | -17.81 | 1.5300 | -0.3741 | |||
| FCNCA / First Citizens BancShares, Inc. | 0.01 | -2.86 | 13.30 | 2.50 | 1.5156 | 0.0033 | |||
| EWBC / East West Bancorp, Inc. | 0.12 | -24.32 | 12.04 | -14.86 | 1.3719 | -0.2763 | |||
| SMURFIT WESTROCK PLC / EC (IE00028FXN24) | 0.27 | 60.30 | 11.81 | 53.51 | 1.3459 | 0.4491 | |||
| PCG / PG&E Corporation | 0.81 | 15.40 | 11.32 | -6.36 | 1.2896 | -0.1190 | |||
| SRE / Sempra | 0.15 | 10.51 | 11.31 | 17.34 | 1.2887 | 0.1654 | |||
| VTR / Ventas, Inc. | 0.17 | -26.42 | 10.98 | -32.42 | 1.2503 | -0.6421 | |||
| PSX / Phillips 66 | 0.09 | 69.81 | 10.74 | 64.07 | 1.2231 | 0.4606 | |||
| ON / ON Semiconductor Corporation | 0.20 | -20.05 | 10.43 | 2.98 | 1.1881 | 0.0081 | |||
| FSLR / First Solar, Inc. | 0.06 | -8.27 | 10.28 | 20.11 | 1.1711 | 0.1738 | |||
| OMF / OneMain Holdings, Inc. | 0.18 | 5.81 | 10.17 | 23.38 | 1.1591 | 0.1983 | |||
| WDC / Western Digital Corporation | 0.16 | 106.19 | 10.01 | 226.40 | 1.1408 | 0.7833 | |||
| REXR / Rexford Industrial Realty, Inc. | 0.27 | 130.52 | 9.72 | 109.43 | 1.1078 | 0.5668 | |||
| ARW / Arrow Electronics, Inc. | 0.08 | -31.45 | 9.72 | -15.87 | 1.1076 | -0.2389 | |||
| AMP / Ameriprise Financial, Inc. | 0.02 | -28.46 | 9.66 | -21.12 | 1.1005 | -0.3266 | |||
| DAR / Darling Ingredients Inc. | 0.25 | -5.16 | 9.63 | 15.19 | 1.0972 | 0.1229 | |||
| SUI / Sun Communities, Inc. | 0.08 | -29.60 | 9.63 | -30.78 | 1.0966 | -0.5237 | |||
| GXO / GXO Logistics, Inc. | 0.20 | 12.93 | 9.62 | 40.72 | 1.0964 | 0.2996 | |||
| GPN / Global Payments Inc. | 0.12 | -25.59 | 9.33 | -39.18 | 1.0632 | -0.7247 | |||
| WEX / WEX Inc. | 0.06 | -6.34 | 9.33 | -12.38 | 1.0626 | -0.1779 | |||
| ALSN / Allison Transmission Holdings, Inc. | 0.10 | 22.10 | 9.25 | 21.24 | 1.0540 | 0.1648 | |||
| RRX / Regal Rexnord Corporation | 0.06 | 0.00 | 9.23 | 27.32 | 1.0519 | 0.2069 | |||
| GTES / Gates Industrial Corporation plc | 0.40 | -23.10 | 9.22 | -3.80 | 1.0499 | -0.0664 | |||
| SLM / SLM Corporation | 0.28 | -10.18 | 9.15 | 0.28 | 1.0425 | -0.0208 | |||
| RGA / Reinsurance Group of America, Incorporated | 0.05 | 0.00 | 9.13 | 0.74 | 1.0396 | -0.0159 | |||
| GIL / Gildan Activewear Inc. | 0.18 | 14.78 | 9.07 | 27.94 | 1.0328 | 0.2071 | |||
| HGV / Hilton Grand Vacations Inc. | 0.22 | -0.32 | 9.04 | 10.65 | 1.0295 | 0.0779 | |||
| OSK / Oshkosh Corporation | 0.08 | 28.52 | 8.90 | 55.12 | 1.0140 | 0.3454 | |||
| APO / Apollo Global Management, Inc. | 0.06 | -20.48 | 8.87 | -17.63 | 1.0101 | -0.2440 | |||
| CEG / Constellation Energy Corporation | 0.03 | -4.54 | 8.82 | 52.80 | 1.0050 | 0.3323 | |||
| UPBD / Upbound Group, Inc. | 0.35 | 11.64 | 8.81 | 16.95 | 1.0036 | 0.1259 | |||
| HRI / Herc Holdings Inc. | 0.07 | 22.53 | 8.81 | 20.17 | 1.0036 | 0.1494 | |||
| LAD / Lithia Motors, Inc. | 0.03 | -16.67 | 8.78 | -4.09 | 1.0006 | -0.0665 | |||
| CNH / CNH Industrial N.V. | 0.68 | -0.16 | 8.77 | 5.37 | 0.9988 | 0.0292 | |||
| PRMB / Primo Brands Corporation | 0.30 | 8.76 | 0.9978 | 0.9978 | |||||
| ES / Eversource Energy | 0.14 | 3.85 | 8.74 | 6.38 | 0.9958 | 0.0384 | |||
| GALP / Galp Energia, SGPS, S.A. | 0.48 | 28.66 | 8.74 | 34.20 | 0.9951 | 0.2367 | |||
| FA / First Advantage Corporation | 0.53 | -8.05 | 8.74 | 8.40 | 0.9951 | 0.0562 | |||
| NXST / Nexstar Media Group, Inc. | 0.05 | 102.41 | 8.72 | 95.34 | 0.9930 | 0.4730 | |||
| RJF / Raymond James Financial, Inc. | 0.06 | 6.77 | 8.71 | 17.88 | 0.9924 | 0.1313 | |||
| BPOP / Popular, Inc. | 0.08 | 15.37 | 8.68 | 37.67 | 0.9893 | 0.2542 | |||
| AIZ / Assurant, Inc. | 0.04 | 2.09 | 8.67 | -3.88 | 0.9876 | -0.0632 | |||
| TRV / The Travelers Companies, Inc. | 0.03 | -6.09 | 8.67 | -4.99 | 0.9875 | -0.0756 | |||
| PLD / Prologis, Inc. | 0.08 | -2.72 | 8.65 | -8.53 | 0.9849 | -0.1163 | |||
| COOP / Mr. Cooper Group Inc. | 0.06 | 8.56 | 0.9757 | 0.9757 | |||||
| FQVLF / First Quantum Minerals Ltd. | 0.48 | 11.39 | 8.48 | 47.16 | 0.9659 | 0.2945 | |||
| AES / The AES Corporation | 0.80 | -10.49 | 8.43 | -24.19 | 0.9609 | -0.3355 | |||
| CH1300646267 / Bunge Global SA | 0.10 | -13.32 | 8.41 | -8.94 | 0.9584 | -0.1181 | |||
| WELL / Welltower Inc. | 0.05 | -33.98 | 8.39 | -33.76 | 0.9562 | -0.5201 | |||
| CNR / Core Natural Resources, Inc. | 0.12 | -8.75 | 8.30 | -17.45 | 0.9450 | -0.2260 | |||
| ACHC / Acadia Healthcare Company, Inc. | 0.36 | 12.96 | 8.14 | -15.46 | 0.9273 | -0.1947 | |||
| NATL / NCR Atleos Corporation | 0.28 | -7.53 | 8.12 | 0.00 | 0.9253 | -0.0211 | |||
| SIG / Signet Jewelers Limited | 0.10 | -13.29 | 8.10 | 18.79 | 0.9233 | 0.1284 | |||
| TRGP / Targa Resources Corp. | 0.05 | -1.50 | 8.03 | -14.45 | 0.9142 | -0.1790 | |||
| BLDR / Builders FirstSource, Inc. | 0.07 | 3.31 | 8.02 | -3.51 | 0.9132 | -0.0548 | |||
| HAS / Hasbro, Inc. | 0.11 | 50.70 | 7.99 | 80.95 | 0.9099 | 0.3955 | |||
| IQV / IQVIA Holdings Inc. | 0.05 | 7.95 | 0.9051 | 0.9051 | |||||
| WCC / WESCO International, Inc. | 0.04 | -25.26 | 7.89 | -10.88 | 0.8988 | -0.1327 | |||
| BLD / TopBuild Corp. | 0.02 | 7.87 | 0.8962 | 0.8962 | |||||
| STZ / Constellation Brands, Inc. | 0.05 | 7.82 | 0.8914 | 0.8914 | |||||
| CSTM / Constellium SE | 0.57 | 29.30 | 7.62 | 70.44 | 0.8686 | 0.3473 | |||
| LNTH / Lantheus Holdings, Inc. | 0.09 | 78.95 | 7.62 | 50.09 | 0.8678 | 0.2764 | |||
| UHALB / U-Haul Holding Company - Series N | 0.14 | 3.51 | 7.59 | -4.90 | 0.8642 | -0.0653 | |||
| XPRO / Expro Group Holdings N.V. | 0.87 | 8.74 | 7.46 | -6.03 | 0.8503 | -0.0752 | |||
| PATK / Patrick Industries, Inc. | 0.08 | 849.44 | 7.25 | 937.20 | 0.8259 | 0.7444 | |||
| GTM / ZoomInfo Technologies Inc. | 0.71 | -17.82 | 7.16 | -16.84 | 0.8155 | -0.1874 | |||
| VYX / NCR Voyix Corporation | 0.59 | 7.84 | 6.94 | 29.74 | 0.7907 | 0.1673 | |||
| R / Ryder System, Inc. | 0.04 | 6.36 | 6.92 | 17.60 | 0.7879 | 0.1026 | |||
| LPLA / LPL Financial Holdings Inc. | 0.02 | -49.15 | 6.71 | -41.72 | 0.7646 | -0.5771 | |||
| SGI / Somnigroup International Inc. | 0.10 | -40.59 | 6.68 | -32.49 | 0.7613 | -0.3920 | |||
| BCO / The Brink's Company | 0.07 | 5.67 | 6.66 | 9.52 | 0.7588 | 0.0501 | |||
| MEOH / Methanex Corporation | 0.20 | 32.39 | 6.63 | 24.86 | 0.7553 | 0.1367 | |||
| XPO / XPO, Inc. | 0.05 | 7.52 | 6.50 | 26.20 | 0.7409 | 0.1405 | |||
| FDX / FedEx Corporation | 0.03 | 6.72 | 6.50 | -0.49 | 0.7406 | -0.0206 | |||
| DRVN / Driven Brands Holdings Inc. | 0.37 | -6.64 | 6.50 | -4.34 | 0.7399 | -0.0513 | |||
| KDP / Keurig Dr Pepper Inc. | 0.20 | -21.67 | 6.48 | -24.33 | 0.7378 | -0.2594 | |||
| WSC / WillScot Holdings Corporation | 0.24 | 216.57 | 6.46 | 130.45 | 0.7354 | 0.3426 | |||
| BBWI / Bath & Body Works, Inc. | 0.21 | 4.23 | 6.42 | 3.00 | 0.7317 | 0.0051 | |||
| CLNX / Cellnex Telecom, S.A. | 0.16 | -43.13 | 6.35 | -37.71 | 0.7230 | -0.4641 | |||
| DLTR / Dollar Tree, Inc. | 0.06 | -37.73 | 6.29 | -17.85 | 0.7166 | -0.1756 | |||
| OI / O-I Glass, Inc. | 0.42 | -14.96 | 6.18 | 9.26 | 0.7042 | 0.0451 | |||
| TEX / Terex Corporation | 0.13 | -0.99 | 6.09 | 22.37 | 0.6941 | 0.1139 | |||
| IP / International Paper Company | 0.13 | -22.11 | 6.09 | -31.64 | 0.6935 | -0.3440 | |||
| JLL / Jones Lang LaSalle Incorporated | 0.02 | -61.54 | 5.96 | -47.92 | 0.6792 | -0.9446 | |||
| PAG / Penske Automotive Group, Inc. | 0.03 | 6.77 | 5.96 | 27.40 | 0.6792 | 0.1339 | |||
| AHCO / AdaptHealth Corp. | 0.63 | 23.34 | 5.91 | 7.32 | 0.6735 | 0.0315 | |||
| PFSI / PennyMac Financial Services, Inc. | 0.06 | 6.27 | 5.91 | 5.76 | 0.6731 | 0.0222 | |||
| DOOO / BRP Inc. | 0.12 | 3.97 | 5.85 | 49.46 | 0.6669 | 0.2105 | |||
| ICLR / ICON Public Limited Company | 0.04 | 35.81 | 5.85 | 12.90 | 0.6661 | 0.0626 | |||
| PVH / PVH Corp. | 0.08 | -17.76 | 5.69 | -12.72 | 0.6478 | -0.1113 | |||
| FLR / Fluor Corporation | 0.11 | 7.09 | 5.58 | 53.28 | 0.6355 | 0.2114 | |||
| CTRI / Centuri Holdings, Inc. | 0.24 | -6.36 | 5.49 | 28.19 | 0.6253 | 0.1265 | |||
| FAF / First American Financial Corporation | 0.09 | -3.70 | 5.49 | 9.59 | 0.6250 | -0.0771 | |||
| WLK / Westlake Corporation | 0.07 | 7.27 | 5.04 | -18.58 | 0.5743 | -0.1471 | |||
| KBR / KBR, Inc. | 0.10 | -19.15 | 4.84 | -29.18 | 0.5510 | -0.3288 | |||
| TFII / TFI International Inc. | 0.05 | 9.81 | 4.72 | 27.32 | 0.5379 | 0.1058 | |||
| GMS / GMS Inc. | 0.04 | -54.16 | 4.67 | -31.86 | 0.5316 | -0.2664 | |||
| MLKN / MillerKnoll, Inc. | 0.23 | 7.33 | 4.46 | 8.91 | 0.5084 | 0.0309 | |||
| PFGC / Performance Food Group Company | 0.05 | 4.41 | 0.5022 | 0.5022 | |||||
| SNDK / Sandisk Corporation | 0.10 | 22.46 | 4.38 | 16.66 | 0.4985 | 0.0614 | |||
| TKR / The Timken Company | 0.06 | -40.58 | 4.28 | -40.02 | 0.4876 | -0.3439 | |||
| OLN / Olin Corporation | 0.18 | 7.93 | 3.61 | -10.53 | 0.4113 | -0.0590 | |||
| ACI / Albertsons Companies, Inc. | 0.16 | -44.85 | 3.55 | -46.06 | 0.4043 | -0.3623 | |||
| VSTS / Vestis Corporation | 0.60 | 7.65 | 3.46 | -37.69 | 0.3942 | -0.2529 | |||
| COLD / Americold Realty Trust, Inc. | 0.14 | -26.76 | 2.40 | -58.07 | 0.2738 | -0.5379 | |||
| LNG / Cheniere Energy, Inc. | 0.01 | -74.28 | 2.39 | -72.94 | 0.2719 | -0.7554 | |||
| ASGN / ASGN Incorporated | 0.04 | -25.41 | 2.17 | -40.92 | 0.2478 | -0.1811 | |||
| JAZZ / Jazz Pharmaceuticals plc | 0.02 | -63.58 | 1.82 | -68.88 | 0.2069 | -0.4730 | |||
| QDEL / QuidelOrtho Corporation | 0.06 | 1.76 | 0.2002 | 0.2002 | |||||
| AVT / Avnet, Inc. | 0.03 | 1.43 | 0.1626 | 0.1626 | |||||
| EIX / Edison International | 0.02 | -84.57 | 1.18 | -86.49 | 0.1341 | -0.8812 | |||
| WFRD / Weatherford International plc | 0.02 | 1.12 | 0.1279 | 0.1279 |