Statistik Asas
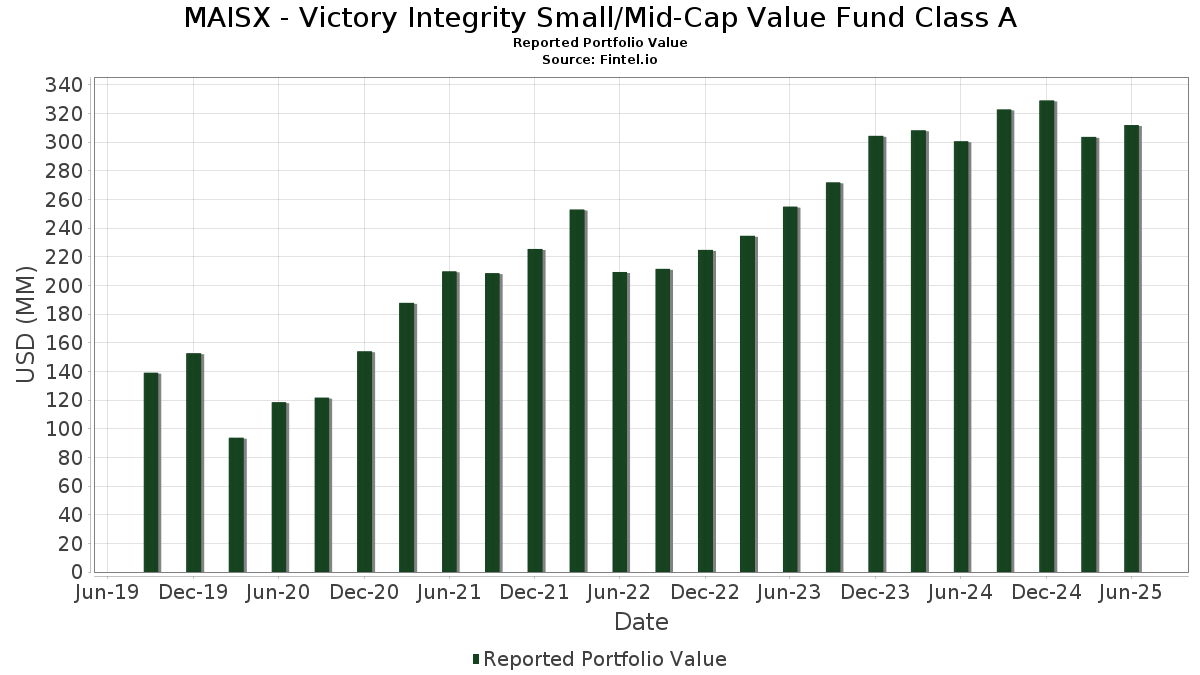
| Nilai Portfolio | $ 311,937,008 |
| Kedudukan Semasa | 113 |
Pegangan Terkini, Prestasi, AUM (dari 13F, 13D)
MAISX - Victory Integrity Small/Mid-Cap Value Fund Class A telah mendedahkan 113 jumlah pegangan dalam pemfailan SEC terkini mereka. Nilai portfolio terkini dikira sebagai $ 311,937,008 USD. Aset Sebenar Di Bawah Pengurusan (AUM) ialah nilai ini ditambah dengan tunai (yang tidak didedahkan). Pegangan teratas MAISX - Victory Integrity Small/Mid-Cap Value Fund Class A ialah Gaming and Leisure Properties, Inc. (US:GLPI) , Textron Inc. (US:TXT) , Camden Property Trust (US:CPT) , W. P. Carey Inc. (US:WPC) , and Amdocs Limited (US:DOX) . Kedudukan baharu MAISX - Victory Integrity Small/Mid-Cap Value Fund Class A termasuk Crown Holdings, Inc. (US:CCK) , C.H. Robinson Worldwide, Inc. (US:CHRW) , Scorpio Tankers Inc. (US:STNG) , Lionsgate Studios Corp. (US:LION) , and .
Kenaikan Teratas Suku Tahun Ini
Kami menggunakan perubahan dalam peruntukan portfolio kerana ini adalah metrik yang paling bermakna. Perubahan boleh disebabkan oleh perdagangan atau perubahan dalam harga saham.
| Sekuriti | Saham (MM) |
Nilai (MM$) |
Portfolio % | ΔPortfolio % |
|---|---|---|---|---|
| 0.03 | 3.36 | 1.0607 | 1.0607 | |
| 0.01 | 2.88 | 0.9078 | 0.9078 | |
| 0.03 | 2.78 | 0.8754 | 0.8754 | |
| 0.00 | 2.49 | 0.7853 | 0.7853 | |
| 0.06 | 2.28 | 0.7174 | 0.7174 | |
| 0.10 | 2.21 | 0.6959 | 0.6959 | |
| 0.07 | 3.69 | 1.1622 | 0.5726 | |
| 0.22 | 1.29 | 0.4082 | 0.4082 | |
| 0.05 | 4.04 | 1.2735 | 0.3570 | |
| 0.03 | 3.23 | 1.0182 | 0.3475 |
Penurunan Teratas Suku Tahun Ini
Kami menggunakan perubahan dalam peruntukan portfolio kerana ini adalah metrik yang paling bermakna. Perubahan boleh disebabkan oleh perdagangan atau perubahan dalam harga saham.
| Sekuriti | Saham (MM) |
Nilai (MM$) |
Portfolio % | ΔPortfolio % |
|---|---|---|---|---|
| 0.03 | 2.67 | 0.8420 | -0.4690 | |
| 0.17 | 3.50 | 1.1030 | -0.3570 | |
| 0.03 | 2.59 | 0.8153 | -0.3501 | |
| 0.04 | 2.85 | 0.8998 | -0.2641 | |
| 0.04 | 1.56 | 0.4919 | -0.1942 | |
| 0.04 | 2.15 | 0.6776 | -0.1931 | |
| 0.09 | 4.11 | 1.2951 | -0.1679 | |
| 0.02 | 2.49 | 0.7854 | -0.1665 | |
| 0.04 | 4.01 | 1.2630 | -0.1571 | |
| 0.07 | 3.00 | 0.9469 | -0.1558 |
13F dan Pemfailan Dana
Borang ini telah difailkan pada 2025-08-28 untuk tempoh pelaporan 2025-06-30. Klik ikon pautan untuk melihat sejarah transaksi penuh.
Tingkatkan untuk membuka data premium dan eksport ke Excel ![]() .
.
| Sekuriti | Jenis | Purata Harga Saham | Saham (MM) |
ΔSaham (%) |
ΔSaham (%) |
Nilai ($MM) |
Portfolio (%) |
ΔPortfolio (%) |
|
|---|---|---|---|---|---|---|---|---|---|
| GLPI / Gaming and Leisure Properties, Inc. | 0.09 | 0.00 | 4.11 | -8.28 | 1.2951 | -0.1679 | |||
| TXT / Textron Inc. | 0.05 | 29.55 | 4.04 | 43.96 | 1.2735 | 0.3570 | |||
| CPT / Camden Property Trust | 0.04 | 0.00 | 4.01 | -7.87 | 1.2630 | -0.1571 | |||
| WPC / W. P. Carey Inc. | 0.06 | -2.57 | 3.99 | -3.69 | 1.2589 | -0.0954 | |||
| DOX / Amdocs Limited | 0.04 | 0.00 | 3.89 | -0.28 | 1.2255 | -0.0478 | |||
| FLEX / Flex Ltd. | 0.07 | 35.32 | 3.69 | 104.27 | 1.1622 | 0.5726 | |||
| FR / First Industrial Realty Trust, Inc. | 0.08 | 3.61 | 3.63 | -7.58 | 1.1459 | -0.1388 | |||
| PFGC / Performance Food Group Company | 0.04 | 0.00 | 3.63 | 11.22 | 1.1439 | 0.0786 | |||
| UGI / UGI Corporation | 0.10 | -16.30 | 3.59 | -7.81 | 1.1308 | -0.1401 | |||
| PNR / Pentair plc | 0.03 | 0.00 | 3.58 | 17.34 | 1.1287 | 0.1323 | |||
| FRT / Federal Realty Investment Trust | 0.04 | 0.00 | 3.56 | -2.89 | 1.1228 | -0.0751 | |||
| FHN / First Horizon Corporation | 0.17 | -28.30 | 3.50 | -21.73 | 1.1030 | -0.3570 | |||
| QRVO / Qorvo, Inc. | 0.04 | 25.18 | 3.49 | 46.78 | 1.0993 | 0.3234 | |||
| JBL / Jabil Inc. | 0.02 | -14.17 | 3.47 | 37.53 | 1.0944 | 0.2702 | |||
| CASY / Casey's General Stores, Inc. | 0.01 | 0.00 | 3.45 | 17.55 | 1.0878 | 0.1292 | |||
| MOS / The Mosaic Company | 0.09 | -19.14 | 3.45 | 9.22 | 1.0866 | 0.0558 | |||
| UNM / Unum Group | 0.04 | -2.54 | 3.40 | -3.38 | 1.0721 | -0.0775 | |||
| CCK / Crown Holdings, Inc. | 0.03 | 3.36 | 1.0607 | 1.0607 | |||||
| PB / Prosperity Bancshares, Inc. | 0.05 | 0.00 | 3.32 | -1.57 | 1.0482 | -0.0552 | |||
| OSK / Oshkosh Corporation | 0.03 | 10.96 | 3.29 | 33.93 | 1.0371 | 0.2348 | |||
| BLD / TopBuild Corp. | 0.01 | 15.32 | 3.28 | 22.43 | 1.0348 | 0.1591 | |||
| FLG / Flagstar Financial, Inc. | 0.31 | 5.64 | 3.25 | -3.61 | 1.0261 | -0.0770 | |||
| ST / Sensata Technologies Holding plc | 0.11 | 11.34 | 3.25 | 38.11 | 1.0254 | 0.2563 | |||
| MKSI / MKS Inc. | 0.03 | 26.87 | 3.23 | 57.28 | 1.0182 | 0.3475 | |||
| ITT / ITT Inc. | 0.02 | -22.39 | 3.22 | -5.76 | 1.0157 | -0.1009 | |||
| NLY / Annaly Capital Management, Inc. | 0.17 | 0.00 | 3.21 | -7.36 | 1.0128 | -0.1195 | |||
| WCC / WESCO International, Inc. | 0.02 | 9.28 | 3.21 | 30.35 | 1.0117 | 0.2074 | |||
| SSB / SouthState Corporation | 0.03 | -2.38 | 3.20 | -3.23 | 1.0102 | -0.0711 | |||
| CWK / Cushman & Wakefield plc | 0.29 | 3.31 | 3.18 | 11.91 | 1.0018 | 0.0743 | |||
| WAL / Western Alliance Bancorporation | 0.04 | 3.31 | 3.17 | 22.44 | 0.9983 | 0.1557 | |||
| GBCI / Glacier Bancorp, Inc. | 0.07 | 0.00 | 3.12 | -2.56 | 0.9848 | -0.0625 | |||
| VLY / Valley National Bancorp | 0.35 | 0.00 | 3.12 | 0.45 | 0.9845 | -0.0309 | |||
| KRC / Kilroy Realty Corporation | 0.09 | 0.00 | 3.12 | 4.73 | 0.9838 | 0.0106 | |||
| SNX / TD SYNNEX Corporation | 0.02 | 0.00 | 3.11 | 30.55 | 0.9800 | 0.2022 | |||
| OC / Owens Corning | 0.02 | 15.57 | 3.08 | 11.32 | 0.9702 | 0.0670 | |||
| HIW / Highwoods Properties, Inc. | 0.10 | -3.11 | 3.06 | 1.63 | 0.9656 | -0.0187 | |||
| AGNC / AGNC Investment Corp. | 0.33 | 0.00 | 3.05 | -4.05 | 0.9628 | -0.0770 | |||
| ESNT / Essent Group Ltd. | 0.05 | 0.00 | 3.05 | 5.21 | 0.9613 | 0.0147 | |||
| BCO / The Brink's Company | 0.03 | 30.19 | 3.04 | 34.90 | 0.9595 | 0.2227 | |||
| KEX / Kirby Corporation | 0.03 | 0.00 | 3.01 | 12.25 | 0.9506 | 0.0734 | |||
| DLTR / Dollar Tree, Inc. | 0.03 | -24.41 | 3.01 | -0.30 | 0.9494 | -0.0369 | |||
| ADT / ADT Inc. | 0.35 | 0.00 | 3.00 | 4.05 | 0.9475 | 0.0041 | |||
| CMC / Commercial Metals Company | 0.06 | 0.00 | 3.00 | 6.30 | 0.9474 | 0.0241 | |||
| AR / Antero Resources Corporation | 0.07 | -10.68 | 3.00 | -11.05 | 0.9469 | -0.1558 | |||
| BJ / BJ's Wholesale Club Holdings, Inc. | 0.03 | 0.00 | 2.99 | -5.47 | 0.9425 | -0.0907 | |||
| FWONK / Formula One Group | 0.03 | 0.00 | 2.97 | 16.09 | 0.9354 | 0.1007 | |||
| KFY / Korn Ferry | 0.04 | 0.00 | 2.95 | 8.13 | 0.9315 | 0.0388 | |||
| FAF / First American Financial Corporation | 0.05 | 10.51 | 2.93 | 3.35 | 0.9241 | -0.0020 | |||
| SKYW / SkyWest, Inc. | 0.03 | 0.00 | 2.93 | 17.87 | 0.9237 | 0.1117 | |||
| GT / The Goodyear Tire & Rubber Company | 0.28 | -4.55 | 2.91 | 7.14 | 0.9184 | 0.0302 | |||
| SYNA / Synaptics Incorporated | 0.04 | 13.89 | 2.88 | 15.83 | 0.9094 | 0.0962 | |||
| VMI / Valmont Industries, Inc. | 0.01 | 2.88 | 0.9078 | 0.9078 | |||||
| EVRG / Evergy, Inc. | 0.04 | -19.88 | 2.85 | -19.90 | 0.8998 | -0.2641 | |||
| BBWI / Bath & Body Works, Inc. | 0.09 | 27.52 | 2.83 | 25.99 | 0.8914 | 0.1585 | |||
| VBTX / Veritex Holdings, Inc. | 0.11 | -3.33 | 2.82 | 1.07 | 0.8905 | -0.0225 | |||
| BHF / Brighthouse Financial, Inc. | 0.05 | -4.59 | 2.81 | -11.54 | 0.8875 | -0.1518 | |||
| APAM / Artisan Partners Asset Management Inc. | 0.06 | 5.56 | 2.80 | 19.68 | 0.8845 | 0.1188 | |||
| SEE / Sealed Air Corporation | 0.09 | 13.34 | 2.79 | 21.68 | 0.8795 | 0.1307 | |||
| TEX / Terex Corporation | 0.06 | 17.46 | 2.79 | 45.16 | 0.8789 | 0.2516 | |||
| EHC / Encompass Health Corporation | 0.02 | -21.87 | 2.79 | -5.40 | 0.8783 | -0.0835 | |||
| CHRW / C.H. Robinson Worldwide, Inc. | 0.03 | 2.78 | 0.8754 | 0.8754 | |||||
| VAC / Marriott Vacations Worldwide Corporation | 0.04 | 0.00 | 2.76 | 12.55 | 0.8710 | 0.0693 | |||
| FIBK / First Interstate BancSystem, Inc. | 0.10 | 14.05 | 2.74 | 14.71 | 0.8633 | 0.0837 | |||
| THC / Tenet Healthcare Corporation | 0.02 | -25.48 | 2.73 | -2.50 | 0.8614 | -0.0538 | |||
| BDC / Belden Inc. | 0.02 | 10.98 | 2.67 | 28.24 | 0.8420 | 0.1615 | |||
| NFG / National Fuel Gas Company | 0.03 | -37.80 | 2.67 | -33.47 | 0.8420 | -0.4690 | |||
| INDB / Independent Bank Corp. | 0.04 | 0.00 | 2.66 | 0.38 | 0.8401 | -0.0270 | |||
| CACI / CACI International Inc | 0.01 | -5.02 | 2.66 | 23.41 | 0.8395 | 0.1347 | |||
| SBH / Sally Beauty Holdings, Inc. | 0.29 | 12.93 | 2.65 | 15.77 | 0.8359 | 0.0881 | |||
| RS / Reliance, Inc. | 0.01 | 0.00 | 2.65 | 8.70 | 0.8359 | 0.0393 | |||
| NCLH / Norwegian Cruise Line Holdings Ltd. | 0.13 | 0.00 | 2.62 | 6.94 | 0.8258 | 0.0259 | |||
| UTHR / United Therapeutics Corporation | 0.01 | -4.46 | 2.61 | -10.95 | 0.8234 | -0.1345 | |||
| NXST / Nexstar Media Group, Inc. | 0.01 | -3.28 | 2.59 | -6.68 | 0.8156 | -0.0897 | |||
| PNW / Pinnacle West Capital Corporation | 0.03 | -22.84 | 2.59 | -27.53 | 0.8153 | -0.3501 | |||
| BLDR / Builders FirstSource, Inc. | 0.02 | 44.12 | 2.58 | 34.62 | 0.8143 | 0.1875 | |||
| R / Ryder System, Inc. | 0.02 | 19.64 | 2.56 | 32.30 | 0.8062 | 0.1748 | |||
| AXTA / Axalta Coating Systems Ltd. | 0.09 | 0.00 | 2.55 | -10.48 | 0.8030 | -0.1264 | |||
| TKR / The Timken Company | 0.03 | 0.00 | 2.53 | 0.96 | 0.7977 | -0.0210 | |||
| PBH / Prestige Consumer Healthcare Inc. | 0.03 | 0.00 | 2.52 | -7.09 | 0.7930 | -0.0915 | |||
| BFH / Bread Financial Holdings, Inc. | 0.04 | -31.30 | 2.51 | -11.92 | 0.7925 | -0.1399 | |||
| JAZZ / Jazz Pharmaceuticals plc | 0.02 | 0.00 | 2.49 | -14.52 | 0.7854 | -0.1665 | |||
| EME / EMCOR Group, Inc. | 0.00 | 2.49 | 0.7853 | 0.7853 | |||||
| LIVN / LivaNova PLC | 0.06 | 0.00 | 2.48 | 14.62 | 0.7815 | 0.0751 | |||
| AIZ / Assurant, Inc. | 0.01 | 0.00 | 2.46 | -5.86 | 0.7759 | -0.0778 | |||
| J / Jacobs Solutions Inc. | 0.02 | 0.00 | 2.45 | 8.73 | 0.7736 | 0.0365 | |||
| MHK / Mohawk Industries, Inc. | 0.02 | 0.00 | 2.40 | -8.19 | 0.7568 | -0.0971 | |||
| CZR / Caesars Entertainment, Inc. | 0.08 | 0.00 | 2.40 | 13.55 | 0.7557 | 0.0663 | |||
| LNC / Lincoln National Corporation | 0.07 | 0.00 | 2.38 | -3.65 | 0.7492 | -0.0564 | |||
| POST / Post Holdings, Inc. | 0.02 | 0.00 | 2.36 | -6.32 | 0.7438 | -0.0786 | |||
| VC / Visteon Corporation | 0.03 | -4.68 | 2.35 | 14.59 | 0.7408 | 0.0710 | |||
| KNX / Knight-Swift Transportation Holdings Inc. | 0.05 | 23.76 | 2.31 | 25.87 | 0.7273 | 0.1287 | |||
| STNG / Scorpio Tankers Inc. | 0.06 | 2.28 | 0.7174 | 0.7174 | |||||
| NVST / Envista Holdings Corporation | 0.12 | 0.00 | 2.26 | 13.23 | 0.7124 | 0.0605 | |||
| NGVT / Ingevity Corporation | 0.05 | 0.00 | 2.26 | 8.82 | 0.7118 | 0.0343 | |||
| AFG / American Financial Group, Inc. | 0.02 | 0.00 | 2.23 | -3.93 | 0.7021 | -0.0548 | |||
| MUR / Murphy Oil Corporation | 0.10 | 2.21 | 0.6959 | 0.6959 | |||||
| HST / Host Hotels & Resorts, Inc. | 0.14 | 0.00 | 2.18 | 8.07 | 0.6889 | 0.0286 | |||
| PRGO / Perrigo Company plc | 0.08 | -4.95 | 2.18 | -9.43 | 0.6875 | -0.0989 | |||
| GMED / Globus Medical, Inc. | 0.04 | 0.00 | 2.15 | -19.36 | 0.6776 | -0.1931 | |||
| PR / Permian Resources Corporation | 0.15 | 0.00 | 2.11 | -1.63 | 0.6654 | -0.0356 | |||
| VSCO / Victoria's Secret & Co. | 0.11 | 36.70 | 2.06 | 36.26 | 0.6508 | 0.1560 | |||
| NWL / Newell Brands Inc. | 0.37 | 0.00 | 1.99 | -12.94 | 0.6262 | -0.1187 | |||
| SHOO / Steven Madden, Ltd. | 0.08 | 74.52 | 1.97 | 57.06 | 0.6208 | 0.2114 | |||
| BC / Brunswick Corporation | 0.03 | 0.00 | 1.88 | 2.62 | 0.5932 | -0.0059 | |||
| CNR / Core Natural Resources, Inc. | 0.02 | 0.00 | 1.74 | -9.54 | 0.5474 | -0.0796 | |||
| AVNT / Avient Corporation | 0.05 | 2.70 | 1.71 | -10.73 | 0.5379 | -0.0862 | |||
| UEC / Uranium Energy Corp. | 0.24 | -28.54 | 1.61 | 1.64 | 0.5075 | -0.0097 | |||
| WHD / Cactus, Inc. | 0.04 | -22.14 | 1.56 | -25.76 | 0.4919 | -0.1942 | |||
| LION / Lionsgate Studios Corp. | 0.22 | 1.29 | 0.4082 | 0.4082 | |||||
| US8252528851 / Invesco Government & Agency Portfolio, Institutional Class | 0.93 | 39.30 | 0.93 | 39.31 | 0.2941 | 0.0754 | |||
| GSAXX / Goldman Sachs Trust - Goldman Sachs Financial Square Government Fund | 0.93 | 39.30 | 0.93 | 39.31 | 0.2941 | 0.0754 | |||
| US40428X1072 / HSBC U.S. Government Money Market Fund | 0.93 | 39.30 | 0.93 | 39.31 | 0.2941 | 0.0754 | |||
| US61747C7074 / Morgan Stanley Institutional Liquidity Funds Government Portfolio, Institutional Class | 0.93 | 39.30 | 0.93 | 39.31 | 0.2941 | 0.0754 |