Statistik Asas
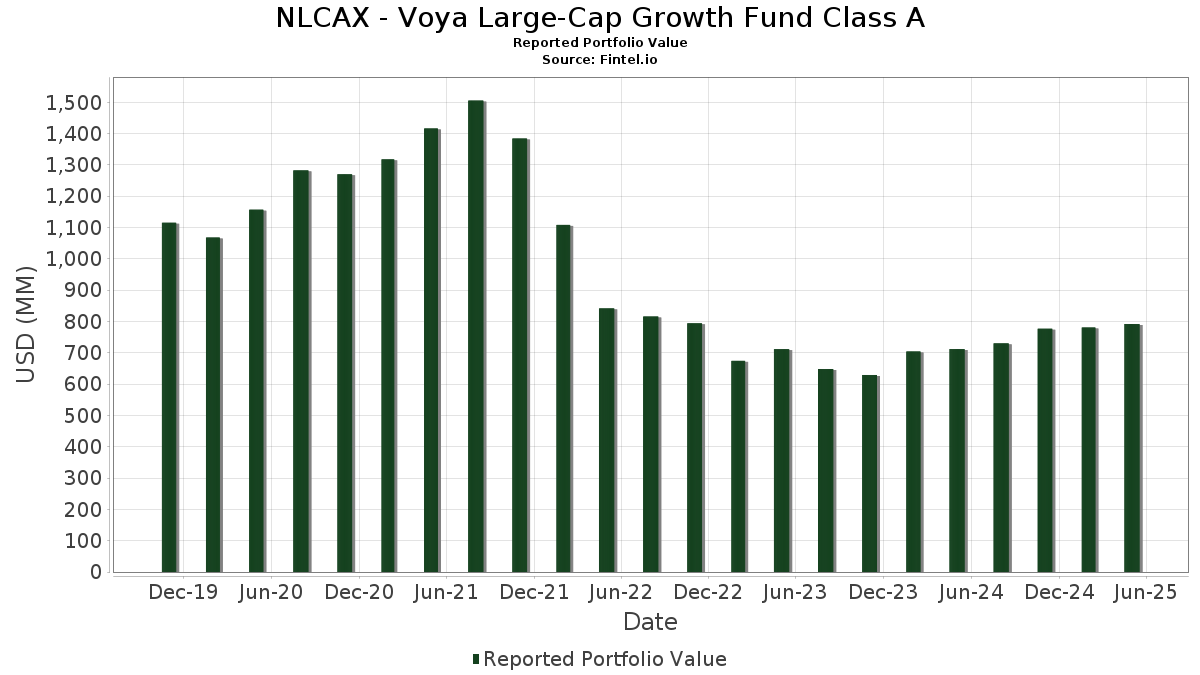
| Nilai Portfolio | $ 791,938,799 |
| Kedudukan Semasa | 54 |
Pegangan Terkini, Prestasi, AUM (dari 13F, 13D)
NLCAX - Voya Large-Cap Growth Fund Class A telah mendedahkan 54 jumlah pegangan dalam pemfailan SEC terkini mereka. Nilai portfolio terkini dikira sebagai $ 791,938,799 USD. Aset Sebenar Di Bawah Pengurusan (AUM) ialah nilai ini ditambah dengan tunai (yang tidak didedahkan). Pegangan teratas NLCAX - Voya Large-Cap Growth Fund Class A ialah Microsoft Corporation (US:MSFT) , NVIDIA Corporation (US:NVDA) , Apple Inc. (US:AAPL) , Amazon.com, Inc. (US:AMZN) , and Meta Platforms, Inc. (US:META) . Kedudukan baharu NLCAX - Voya Large-Cap Growth Fund Class A termasuk McKesson Corporation (US:MCK) , Johnson Controls International plc (US:JCI) , Welltower Inc. (US:WELL) , Snowflake Inc. (US:SNOW) , and Oracle Corporation (US:ORCL) .
Kenaikan Teratas Suku Tahun Ini
Kami menggunakan perubahan dalam peruntukan portfolio kerana ini adalah metrik yang paling bermakna. Perubahan boleh disebabkan oleh perdagangan atau perubahan dalam harga saham.
| Sekuriti | Saham (MM) |
Nilai (MM$) |
Portfolio % | ΔPortfolio % |
|---|---|---|---|---|
| 0.21 | 96.19 | 12.1465 | 3.4637 | |
| 0.01 | 8.09 | 1.0219 | 1.0219 | |
| 0.68 | 91.27 | 11.5249 | 0.9514 | |
| 0.07 | 6.63 | 0.8367 | 0.8367 | |
| 0.04 | 5.66 | 0.7152 | 0.7152 | |
| 0.15 | 36.07 | 4.5550 | 0.6970 | |
| 0.03 | 5.36 | 0.6769 | 0.6769 | |
| 0.03 | 5.23 | 0.6598 | 0.6598 | |
| 0.02 | 23.51 | 2.9682 | 0.5568 | |
| 0.02 | 3.98 | 0.5023 | 0.5023 |
Penurunan Teratas Suku Tahun Ini
Kami menggunakan perubahan dalam peruntukan portfolio kerana ini adalah metrik yang paling bermakna. Perubahan boleh disebabkan oleh perdagangan atau perubahan dalam harga saham.
| Sekuriti | Saham (MM) |
Nilai (MM$) |
Portfolio % | ΔPortfolio % |
|---|---|---|---|---|
| 0.33 | 66.15 | 8.3528 | -2.2830 | |
| 0.28 | 58.26 | 7.3566 | -1.2802 | |
| 0.04 | 9.16 | 1.1573 | -0.8758 | |
| 0.07 | 42.73 | 5.3953 | -0.6959 | |
| 0.03 | 20.85 | 2.6328 | -0.6537 | |
| 0.06 | 4.76 | 0.6014 | -0.5946 | |
| 0.18 | 3.34 | 0.4222 | -0.5480 | |
| 0.01 | 4.44 | 0.5606 | -0.3853 | |
| 0.01 | 7.90 | 0.9970 | -0.3077 | |
| 0.01 | 3.84 | 0.4851 | -0.2760 |
13F dan Pemfailan Dana
Borang ini telah difailkan pada 2025-07-23 untuk tempoh pelaporan 2025-05-31. Klik ikon pautan untuk melihat sejarah transaksi penuh.
Tingkatkan untuk membuka data premium dan eksport ke Excel ![]() .
.
| Sekuriti | Jenis | Purata Harga Saham | Saham (MM) |
ΔSaham (%) |
ΔSaham (%) |
Nilai ($MM) |
Portfolio (%) |
ΔPortfolio (%) |
|
|---|---|---|---|---|---|---|---|---|---|
| MSFT / Microsoft Corporation | 0.21 | 22.37 | 96.19 | 41.90 | 12.1465 | 3.4637 | |||
| NVDA / NVIDIA Corporation | 0.68 | 2.21 | 91.27 | 10.56 | 11.5249 | 0.9514 | |||
| AAPL / Apple Inc. | 0.33 | -4.08 | 66.15 | -20.34 | 8.3528 | -2.2830 | |||
| AMZN / Amazon.com, Inc. | 0.28 | -10.54 | 58.26 | -13.60 | 7.3566 | -1.2802 | |||
| META / Meta Platforms, Inc. | 0.07 | -7.28 | 42.73 | -10.15 | 5.3953 | -0.6959 | |||
| AVGO / Broadcom Inc. | 0.15 | -1.33 | 36.07 | 19.76 | 4.5550 | 0.6970 | |||
| V / Visa Inc. | 0.07 | 1.42 | 26.46 | 2.11 | 3.3408 | 0.0221 | |||
| GOOGL / Alphabet Inc. | 0.15 | 1.42 | 25.22 | 2.29 | 3.1847 | 0.0265 | |||
| NFLX / Netflix, Inc. | 0.02 | 1.41 | 23.51 | 24.85 | 2.9682 | 0.5568 | |||
| LLY / Eli Lilly and Company | 0.03 | 1.41 | 20.85 | -18.74 | 2.6328 | -0.6537 | |||
| NOW / ServiceNow, Inc. | 0.01 | 18.51 | 15.09 | 28.88 | 1.9059 | 0.4059 | |||
| TSLA / Tesla, Inc. | 0.04 | -23.92 | 14.59 | -10.03 | 1.8425 | -0.2349 | |||
| SPOT / Spotify Technology S.A. | 0.02 | 12.81 | 11.06 | 23.41 | 1.3960 | 0.2486 | |||
| ISRG / Intuitive Surgical, Inc. | 0.02 | -8.80 | 10.65 | -12.10 | 1.3445 | -0.2071 | |||
| BKNG / Booking Holdings Inc. | 0.00 | 1.42 | 10.27 | 11.58 | 1.2969 | 0.1180 | |||
| AXON / Axon Enterprise, Inc. | 0.01 | 1.41 | 10.08 | 44.01 | 1.2722 | 0.3760 | |||
| CRWD / CrowdStrike Holdings, Inc. | 0.02 | -19.63 | 10.06 | -2.78 | 1.2709 | -0.0550 | |||
| PANW / Palo Alto Networks, Inc. | 0.05 | 1.42 | 9.72 | 2.48 | 1.2270 | 0.0125 | |||
| TEAM / Atlassian Corporation | 0.04 | -20.95 | 9.16 | -42.26 | 1.1573 | -0.8758 | |||
| VRTX / Vertex Pharmaceuticals Incorporated | 0.02 | 1.41 | 8.90 | -6.57 | 1.1241 | -0.0963 | |||
| PM / Philip Morris International Inc. | 0.05 | 37.06 | 8.77 | 59.40 | 1.1071 | 0.4026 | |||
| TW / Tradeweb Markets Inc. | 0.06 | 1.42 | 8.48 | 8.22 | 1.0711 | 0.0671 | |||
| KVUE / Kenvue Inc. | 0.34 | 1.42 | 8.19 | 2.57 | 1.0338 | 0.0115 | |||
| PLTR / Palantir Technologies Inc. | 0.06 | 1.42 | 8.15 | 57.39 | 1.0285 | 0.3656 | |||
| MCK / McKesson Corporation | 0.01 | 8.09 | 1.0219 | 1.0219 | |||||
| LOW / Lowe's Companies, Inc. | 0.04 | 1.42 | 8.01 | -7.92 | 1.0111 | -0.1028 | |||
| GS / The Goldman Sachs Group, Inc. | 0.01 | -19.67 | 7.90 | -22.49 | 0.9970 | -0.3077 | |||
| WMT / Walmart Inc. | 0.08 | 37.31 | 7.61 | 37.46 | 0.9606 | 0.2518 | |||
| SHW / The Sherwin-Williams Company | 0.02 | 77.60 | 7.55 | 75.92 | 0.9539 | 0.4038 | |||
| MSCI / MSCI Inc. | 0.01 | 35.06 | 7.12 | 29.00 | 0.8988 | 0.1921 | |||
| BSX / Boston Scientific Corporation | 0.07 | -13.55 | 6.86 | -12.33 | 0.8667 | -0.1360 | |||
| JCI / Johnson Controls International plc | 0.07 | 6.63 | 0.8367 | 0.8367 | |||||
| TDG / TransDigm Group Incorporated | 0.00 | 1.40 | 6.48 | 8.91 | 0.8179 | 0.0561 | |||
| US61747C7074 / Morgan Stanley Institutional Liquidity Funds Government Portfolio, Institutional Class | 6.20 | -11.76 | 6.20 | -11.76 | 0.7826 | -0.1170 | |||
| MMM / 3M Company | 0.04 | 1.42 | 6.14 | -3.01 | 0.7759 | -0.0355 | |||
| BURL / Burlington Stores, Inc. | 0.03 | 48.54 | 5.87 | 36.00 | 0.7414 | 0.1884 | |||
| WELL / Welltower Inc. | 0.04 | 5.66 | 0.7152 | 0.7152 | |||||
| TTWO / Take-Two Interactive Software, Inc. | 0.02 | -56.31 | 5.64 | -20.60 | 0.7125 | -0.1355 | |||
| SNOW / Snowflake Inc. | 0.03 | 5.36 | 0.6769 | 0.6769 | |||||
| MKC / McCormick & Company, Incorporated | 0.07 | 1.42 | 5.33 | -10.71 | 0.6726 | -0.0915 | |||
| VMC / Vulcan Materials Company | 0.02 | 44.45 | 5.27 | 54.83 | 0.6654 | 0.2295 | |||
| FIX / Comfort Systems USA, Inc. | 0.01 | -19.10 | 5.26 | 6.48 | 0.6639 | 0.0315 | |||
| DHR / Danaher Corporation | 0.03 | 5.23 | 0.6598 | 0.6598 | |||||
| EXE / Expand Energy Corporation | 0.04 | 19.60 | 5.19 | 40.45 | 0.6556 | 0.1821 | |||
| SBUX / Starbucks Corporation | 0.06 | -34.77 | 4.76 | -43.92 | 0.6014 | -0.5946 | |||
| RBLX / Roblox Corporation | 0.05 | -31.49 | 4.73 | -6.36 | 0.5967 | -0.0497 | |||
| APP / AppLovin Corporation | 0.01 | -50.17 | 4.44 | -39.88 | 0.5606 | -0.3853 | |||
| ORCL / Oracle Corporation | 0.02 | 3.98 | 0.5023 | 0.5023 | |||||
| MNDY / monday.com Ltd. | 0.01 | -35.50 | 3.84 | -35.35 | 0.4851 | -0.2760 | |||
| MU / Micron Technology, Inc. | 0.04 | 1.41 | 3.57 | 2.32 | 0.4511 | 0.0039 | |||
| MTD / Mettler-Toledo International Inc. | 0.00 | 1.44 | 3.57 | -7.89 | 0.4509 | -0.0457 | |||
| OWL / Blue Owl Capital Inc. | 0.18 | -49.12 | 3.34 | -55.86 | 0.4222 | -0.5480 | |||
| BLDR / Builders FirstSource, Inc. | 0.02 | 1.42 | 2.44 | -21.44 | 0.3077 | -0.0895 | |||
| BNP PARIBAS SA / RA (000000000) | 0.00 | 0.0000 | 0.0000 |