Statistik Asas
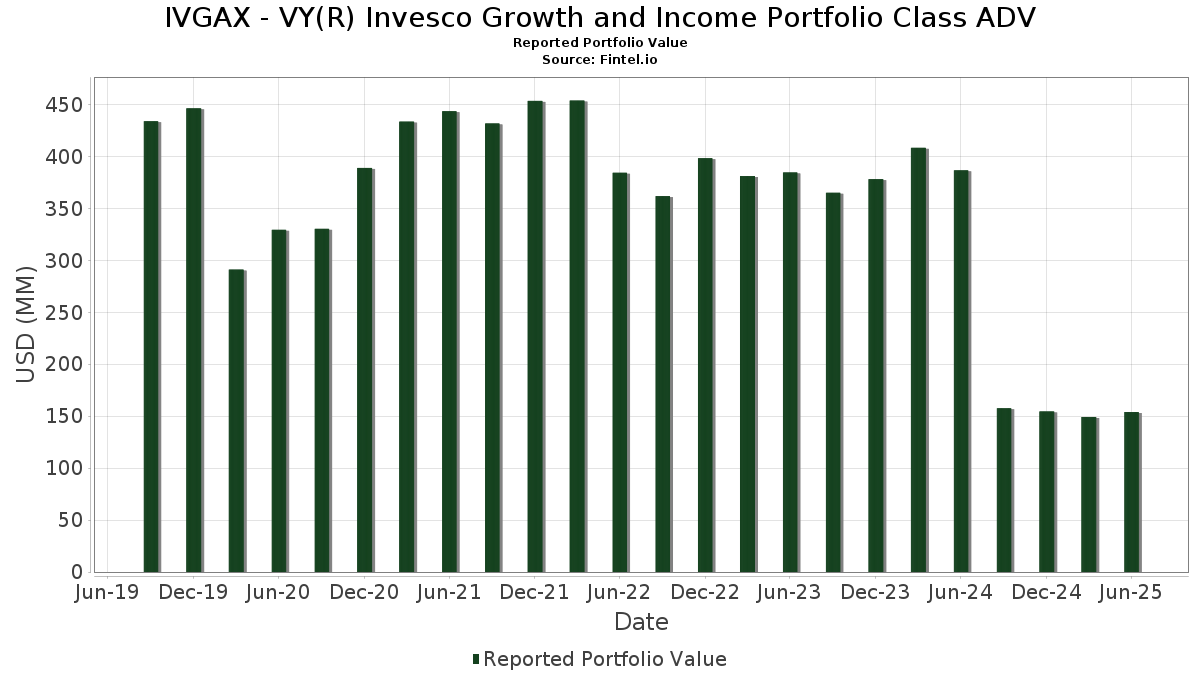
| Nilai Portfolio | $ 153,958,863 |
| Kedudukan Semasa | 95 |
Pegangan Terkini, Prestasi, AUM (dari 13F, 13D)
IVGAX - VY(R) Invesco Growth and Income Portfolio Class ADV telah mendedahkan 95 jumlah pegangan dalam pemfailan SEC terkini mereka. Nilai portfolio terkini dikira sebagai $ 153,958,863 USD. Aset Sebenar Di Bawah Pengurusan (AUM) ialah nilai ini ditambah dengan tunai (yang tidak didedahkan). Pegangan teratas IVGAX - VY(R) Invesco Growth and Income Portfolio Class ADV ialah Blackrock Liquidity Funds - BlackRock Liquidity Funds FedFund Portfolio Institutional Class (US:TFDXX) , Wells Fargo & Company (US:WFC) , Bank of America Corporation (US:BAC) , Amazon.com, Inc. (US:AMZN) , and Microsoft Corporation (US:MSFT) . Kedudukan baharu IVGAX - VY(R) Invesco Growth and Income Portfolio Class ADV termasuk NVIDIA Corporation (US:NVDA) , The Procter & Gamble Company (US:PG) , Vertiv Holdings Co (US:VRT) , Ralliant Corporation (US:RAL) , and .
Kenaikan Teratas Suku Tahun Ini
Kami menggunakan perubahan dalam peruntukan portfolio kerana ini adalah metrik yang paling bermakna. Perubahan boleh disebabkan oleh perdagangan atau perubahan dalam harga saham.
| Sekuriti | Saham (MM) |
Nilai (MM$) |
Portfolio % | ΔPortfolio % |
|---|---|---|---|---|
| 6.37 | 6.37 | 4.1331 | 2.4445 | |
| 0.01 | 2.18 | 1.4150 | 1.4150 | |
| 0.01 | 1.78 | 1.1549 | 1.1549 | |
| 0.05 | 3.68 | 2.3921 | 0.9158 | |
| 0.03 | 1.85 | 1.2043 | 0.9122 | |
| 0.01 | 1.40 | 0.9070 | 0.9070 | |
| 0.01 | 3.94 | 2.5557 | 0.5556 | |
| 0.01 | 2.30 | 1.4945 | 0.4359 | |
| 0.01 | 0.53 | 0.3463 | 0.3463 | |
| 0.02 | 3.05 | 1.9831 | 0.3463 |
Penurunan Teratas Suku Tahun Ini
Kami menggunakan perubahan dalam peruntukan portfolio kerana ini adalah metrik yang paling bermakna. Perubahan boleh disebabkan oleh perdagangan atau perubahan dalam harga saham.
| Sekuriti | Saham (MM) |
Nilai (MM$) |
Portfolio % | ΔPortfolio % |
|---|---|---|---|---|
| 0.00 | 0.00 | -1.0288 | ||
| 0.00 | 0.97 | 0.6293 | -0.6371 | |
| 0.02 | 1.14 | 0.7388 | -0.5713 | |
| 0.01 | 2.28 | 1.4797 | -0.5326 | |
| 0.00 | 1.07 | 0.6919 | -0.4729 | |
| 0.06 | 2.02 | 1.3082 | -0.4408 | |
| 0.03 | 2.94 | 1.9081 | -0.4275 | |
| 0.02 | 2.26 | 1.4667 | -0.4034 | |
| 0.07 | 5.46 | 3.5449 | -0.3783 | |
| 0.03 | 1.51 | 0.9790 | -0.3587 |
13F dan Pemfailan Dana
Borang ini telah difailkan pada 2025-08-26 untuk tempoh pelaporan 2025-06-30. Klik ikon pautan untuk melihat sejarah transaksi penuh.
Tingkatkan untuk membuka data premium dan eksport ke Excel ![]() .
.
| Sekuriti | Jenis | Purata Harga Saham | Saham (MM) |
ΔSaham (%) |
ΔSaham (%) |
Nilai ($MM) |
Portfolio (%) |
ΔPortfolio (%) |
|
|---|---|---|---|---|---|---|---|---|---|
| TFDXX / Blackrock Liquidity Funds - BlackRock Liquidity Funds FedFund Portfolio Institutional Class | 6.37 | 152.10 | 6.37 | 152.12 | 4.1331 | 2.4445 | |||
| WFC / Wells Fargo & Company | 0.07 | -16.61 | 5.46 | -6.94 | 3.5449 | -0.3783 | |||
| BAC / Bank of America Corporation | 0.11 | -4.04 | 5.15 | 8.84 | 3.3422 | 0.1788 | |||
| AMZN / Amazon.com, Inc. | 0.02 | 2.11 | 3.95 | 17.73 | 2.5655 | 0.3213 | |||
| MSFT / Microsoft Corporation | 0.01 | -0.68 | 3.94 | 31.59 | 2.5557 | 0.5556 | |||
| MCHP / Microchip Technology Incorporated | 0.05 | 14.81 | 3.68 | 66.92 | 2.3921 | 0.9158 | |||
| PM / Philip Morris International Inc. | 0.02 | -5.35 | 3.36 | 8.61 | 2.1784 | 0.1125 | |||
| PH / Parker-Hannifin Corporation | 0.00 | -2.97 | 3.22 | 11.50 | 2.0909 | 0.1595 | |||
| SCHW / The Charles Schwab Corporation | 0.03 | -0.68 | 3.07 | 15.76 | 1.9936 | 0.2198 | |||
| DIS / The Walt Disney Company | 0.02 | -0.69 | 3.05 | 24.81 | 1.9831 | 0.3463 | |||
| JNJ / Johnson & Johnson | 0.02 | -0.68 | 3.00 | -8.51 | 1.9464 | -0.2451 | |||
| TYIA / Johnson Controls International plc | 0.03 | -36.18 | 2.94 | -15.84 | 1.9081 | -0.4275 | |||
| WTY / Willis Towers Watson Public Limited Company | 0.01 | -2.93 | 2.79 | -11.95 | 1.8130 | -0.3080 | |||
| SYY / Sysco Corporation | 0.04 | 4.86 | 2.73 | 5.85 | 1.7725 | 0.0476 | |||
| MDT / Medtronic plc | 0.03 | -0.68 | 2.66 | -3.65 | 1.7300 | -0.1194 | |||
| USFD / US Foods Holding Corp. | 0.03 | -0.68 | 2.53 | 16.88 | 1.6451 | 0.1950 | |||
| CFG / Citizens Financial Group, Inc. | 0.06 | -0.68 | 2.49 | 8.50 | 1.6168 | 0.0817 | |||
| EMR / Emerson Electric Co. | 0.02 | -6.85 | 2.36 | 13.30 | 1.5318 | 0.1390 | |||
| CBRE / CBRE Group, Inc. | 0.02 | -19.80 | 2.32 | -14.05 | 1.5089 | -0.2998 | |||
| PPL / PPL Corporation | 0.07 | 5.18 | 2.31 | -1.28 | 1.5004 | -0.0651 | |||
| ORCL / Oracle Corporation | 0.01 | -7.01 | 2.30 | 45.36 | 1.4945 | 0.4359 | |||
| FI / Fiserv, Inc. | 0.01 | -2.99 | 2.28 | -24.26 | 1.4797 | -0.5326 | |||
| RTX / RTX Corporation | 0.02 | -26.72 | 2.26 | -19.21 | 1.4667 | -0.4034 | |||
| COP / ConocoPhillips | 0.03 | 3.61 | 2.25 | -11.46 | 1.4605 | -0.2385 | |||
| CVS / CVS Health Corporation | 0.03 | 2.97 | 2.23 | 4.84 | 1.4497 | 0.0255 | |||
| CVX / Chevron Corporation | 0.02 | -0.68 | 2.23 | -14.97 | 1.4493 | -0.3066 | |||
| XOM / Exxon Mobil Corporation | 0.02 | -0.68 | 2.23 | -9.99 | 1.4450 | -0.2082 | |||
| GS / The Goldman Sachs Group, Inc. | 0.00 | -11.42 | 2.21 | 14.78 | 1.4327 | 0.1469 | |||
| NVDA / NVIDIA Corporation | 0.01 | 2.18 | 1.4150 | 1.4150 | |||||
| CSCO / Cisco Systems, Inc. | 0.03 | -0.68 | 2.18 | 11.65 | 1.4131 | 0.1097 | |||
| PNC / The PNC Financial Services Group, Inc. | 0.01 | -0.69 | 2.13 | 5.35 | 1.3806 | 0.0306 | |||
| FIS / Fidelity National Information Services, Inc. | 0.03 | -0.68 | 2.06 | 8.30 | 1.3382 | 0.0652 | |||
| KKR / KKR & Co. Inc. | 0.02 | 8.22 | 2.05 | 24.51 | 1.3327 | 0.2304 | |||
| FERG / Ferguson Enterprises Inc. | 0.01 | -17.52 | 2.02 | 12.12 | 1.3096 | 0.1062 | |||
| SHEL / Shell plc | 0.06 | -19.62 | 2.02 | -22.94 | 1.3082 | -0.4408 | |||
| AIG / American International Group, Inc. | 0.02 | -0.68 | 2.00 | -2.21 | 1.2952 | -0.0691 | |||
| SAN / Santander UK plc - Preferred Stock | 0.02 | -0.68 | 1.99 | -13.15 | 1.2946 | -0.2408 | |||
| GOOGL / Alphabet Inc. | 0.01 | -25.18 | 1.99 | -14.73 | 1.2937 | -0.2690 | |||
| SBUX / Starbucks Corporation | 0.02 | 14.43 | 1.87 | 6.86 | 1.2139 | 0.0443 | |||
| NKE / NIKE, Inc. | 0.03 | 279.48 | 1.85 | 325.23 | 1.2043 | 0.9122 | |||
| NSC / Norfolk Southern Corporation | 0.01 | -15.45 | 1.83 | -8.60 | 1.1870 | -0.1509 | |||
| PG / The Procter & Gamble Company | 0.01 | 1.78 | 1.1549 | 1.1549 | |||||
| LRCX / Lam Research Corporation | 0.02 | -0.68 | 1.75 | 32.98 | 1.1362 | 0.2562 | |||
| CRM / Salesforce, Inc. | 0.01 | 9.08 | 1.75 | 10.86 | 1.1330 | 0.0802 | |||
| FTV / Fortive Corporation | 0.03 | 18.65 | 1.72 | -15.48 | 1.1167 | -0.2441 | |||
| COHR / Coherent Corp. | 0.02 | -0.68 | 1.70 | 36.41 | 1.1049 | 0.2708 | |||
| NXPI / NXP Semiconductors N.V. | 0.01 | -0.68 | 1.70 | 14.22 | 1.1006 | 0.1078 | |||
| CTSH / Cognizant Technology Solutions Corporation | 0.02 | -0.69 | 1.65 | 1.35 | 1.0719 | -0.0179 | |||
| FDX / FedEx Corporation | 0.01 | -0.68 | 1.65 | -7.41 | 1.0711 | -0.1202 | |||
| CTVA / Corteva, Inc. | 0.02 | -0.68 | 1.64 | 17.60 | 1.0679 | 0.1328 | |||
| TMUS / T-Mobile US, Inc. | 0.01 | -0.69 | 1.61 | -11.28 | 1.0469 | -0.1685 | |||
| UNH / UnitedHealth Group Incorporated | 0.01 | 45.92 | 1.58 | -13.06 | 1.0246 | -0.1896 | |||
| META / Meta Platforms, Inc. | 0.00 | -29.28 | 1.52 | -9.46 | 0.9886 | -0.1356 | |||
| CNC / Centene Corporation | 0.03 | -0.68 | 1.52 | -11.21 | 0.9877 | -0.1579 | |||
| BMY / Bristol-Myers Squibb Company | 0.03 | -0.68 | 1.51 | -24.65 | 0.9790 | -0.3587 | |||
| AEP / American Electric Power Company, Inc. | 0.01 | -0.69 | 1.44 | -5.69 | 0.9369 | -0.0863 | |||
| ZBRA / Zebra Technologies Corporation | 0.00 | -0.68 | 1.40 | 8.35 | 0.9107 | 0.0453 | |||
| VRT / Vertiv Holdings Co | 0.01 | 1.40 | 0.9070 | 0.9070 | |||||
| EQT / EQT Corporation | 0.02 | -0.68 | 1.39 | 8.41 | 0.9038 | 0.0451 | |||
| SU / Suncor Energy Inc. | 0.03 | -0.68 | 1.30 | -3.93 | 0.8413 | -0.0605 | |||
| TXT / Textron Inc. | 0.02 | -0.68 | 1.22 | 10.37 | 0.7949 | 0.0531 | |||
| ALL / The Allstate Corporation | 0.01 | -24.83 | 1.21 | -26.94 | 0.7840 | -0.3210 | |||
| FE / FirstEnergy Corp. | 0.03 | -0.68 | 1.15 | -1.12 | 0.7484 | -0.0308 | |||
| GM / General Motors Company | 0.02 | -44.49 | 1.14 | -41.96 | 0.7388 | -0.5713 | |||
| MRK / Merck & Co., Inc. | 0.01 | 5.72 | 1.13 | -6.83 | 0.7361 | -0.0771 | |||
| PPG / PPG Industries, Inc. | 0.01 | -0.68 | 1.09 | 3.41 | 0.7096 | 0.0022 | |||
| DD / DuPont de Nemours, Inc. | 0.02 | -0.69 | 1.07 | -8.76 | 0.6966 | -0.0900 | |||
| ELV / Elevance Health, Inc. | 0.00 | -31.59 | 1.07 | -38.86 | 0.6919 | -0.4729 | |||
| HUM / Humana Inc. | 0.00 | -44.61 | 0.97 | -48.84 | 0.6293 | -0.6371 | |||
| PFE / Pfizer Inc. | 0.04 | -13.86 | 0.96 | -17.57 | 0.6214 | -0.1553 | |||
| GEHC / GE HealthCare Technologies Inc. | 0.01 | -0.69 | 0.92 | -8.91 | 0.5979 | -0.0778 | |||
| RAL / Ralliant Corporation | 0.01 | 0.53 | 0.3463 | 0.3463 | |||||
| CURRENCY CONTRACT - EUR / DFE (000000000) | 0.00 | 0.0014 | 0.0014 | ||||||
| CURRENCY CONTRACT - EUR / DFE (000000000) | 0.00 | 0.0006 | 0.0006 | ||||||
| CURRENCY CONTRACT - EUR / DFE (000000000) | 0.00 | 0.0006 | 0.0006 | ||||||
| CURRENCY CONTRACT - EUR / DFE (000000000) | 0.00 | 0.0004 | 0.0004 | ||||||
| TD SECURITIES (USA) LLC / RA (000000000) | 0.00 | 0.0004 | 0.0004 | ||||||
| CURRENCY CONTRACT - EUR / DFE (000000000) | 0.00 | 0.0003 | 0.0003 | ||||||
| CURRENCY CONTRACT - CAD / DFE (000000000) | 0.00 | 0.0002 | 0.0002 | ||||||
| CURRENCY CONTRACT - GBP / DFE (000000000) | 0.00 | 0.0002 | 0.0002 | ||||||
| CURRENCY CONTRACT - USD / DFE (000000000) | 0.00 | 0.0001 | 0.0001 | ||||||
| CURRENCY CONTRACT - CAD / DFE (000000000) | 0.00 | 0.0001 | 0.0001 | ||||||
| CURRENCY CONTRACT - CAD / DFE (000000000) | 0.00 | 0.0001 | 0.0001 | ||||||
| CURRENCY CONTRACT - USD / DFE (000000000) | 0.00 | 0.0000 | 0.0000 | ||||||
| MRVL / Marvell Technology, Inc. | 0.00 | -100.00 | 0.00 | -100.00 | -1.0288 | ||||
| CVE / Cenovus Energy Inc. | 0.00 | -100.00 | 0.00 | -100.00 | -0.2483 | ||||
| CURRENCY CONTRACT - USD / DFE (000000000) | -0.00 | -0.0000 | -0.0000 | ||||||
| CURRENCY CONTRACT - USD / DFE (000000000) | -0.00 | -0.0001 | -0.0001 | ||||||
| CURRENCY CONTRACT - USD / DFE (000000000) | -0.00 | -0.0001 | -0.0001 | ||||||
| CURRENCY CONTRACT - USD / DFE (000000000) | -0.00 | -0.0003 | -0.0003 | ||||||
| CURRENCY CONTRACT - USD / DFE (000000000) | -0.00 | -0.0004 | -0.0004 | ||||||
| CURRENCY CONTRACT - USD / DFE (000000000) | -0.00 | -0.0004 | -0.0004 | ||||||
| CURRENCY CONTRACT - USD / DFE (000000000) | -0.00 | -0.0004 | -0.0004 | ||||||
| CURRENCY CONTRACT - USD / DFE (000000000) | -0.00 | -0.0005 | -0.0005 | ||||||
| CURRENCY CONTRACT - USD / DFE (000000000) | -0.00 | -0.0030 | -0.0030 | ||||||
| CURRENCY CONTRACT - USD / DFE (000000000) | -0.02 | -0.0123 | -0.0123 | ||||||
| CURRENCY CONTRACT - USD / DFE (000000000) | -0.05 | -0.0292 | -0.0292 |