Statistik Asas
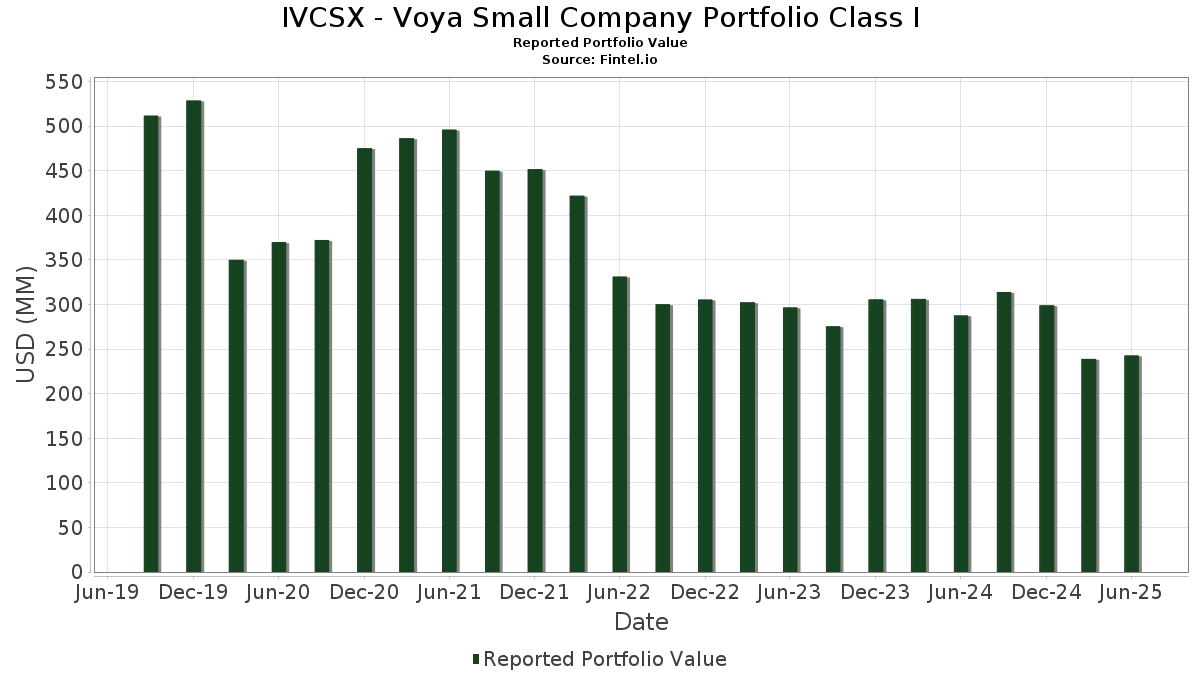
| Nilai Portfolio | $ 242,792,196 |
| Kedudukan Semasa | 191 |
Pegangan Terkini, Prestasi, AUM (dari 13F, 13D)
IVCSX - Voya Small Company Portfolio Class I telah mendedahkan 191 jumlah pegangan dalam pemfailan SEC terkini mereka. Nilai portfolio terkini dikira sebagai $ 242,792,196 USD. Aset Sebenar Di Bawah Pengurusan (AUM) ialah nilai ini ditambah dengan tunai (yang tidak didedahkan). Pegangan teratas IVCSX - Voya Small Company Portfolio Class I ialah First BanCorp. (US:FBP) , iShares Trust - iShares Russell 2000 ETF (US:IWM) , Box, Inc. (US:BOX) , AvePoint, Inc. (US:AVPT) , and Hancock Whitney Corporation (US:HWC) . Kedudukan baharu IVCSX - Voya Small Company Portfolio Class I termasuk Sprouts Farmers Market, Inc. (US:SFM) , FTAI Aviation Ltd. (US:FTAI) , Primoris Services Corporation (US:PRIM) , IonQ, Inc. (US:IONQ) , and AST SpaceMobile, Inc. (US:ASTS) .
Kenaikan Teratas Suku Tahun Ini
Kami menggunakan perubahan dalam peruntukan portfolio kerana ini adalah metrik yang paling bermakna. Perubahan boleh disebabkan oleh perdagangan atau perubahan dalam harga saham.
| Sekuriti | Saham (MM) |
Nilai (MM$) |
Portfolio % | ΔPortfolio % |
|---|---|---|---|---|
| 0.02 | 2.88 | 1.2292 | 1.2292 | |
| 2.14 | 0.9139 | 0.9139 | ||
| 2.14 | 0.9139 | 0.9139 | ||
| 2.03 | 0.8682 | 0.8682 | ||
| 0.02 | 1.80 | 0.7700 | 0.7700 | |
| 0.07 | 3.37 | 1.4364 | 0.7170 | |
| 1.50 | 0.6402 | 0.6402 | ||
| 0.03 | 1.38 | 0.5875 | 0.5875 | |
| 0.02 | 1.34 | 0.5729 | 0.5729 | |
| 0.03 | 1.27 | 0.5428 | 0.5428 |
Penurunan Teratas Suku Tahun Ini
Kami menggunakan perubahan dalam peruntukan portfolio kerana ini adalah metrik yang paling bermakna. Perubahan boleh disebabkan oleh perdagangan atau perubahan dalam harga saham.
| Sekuriti | Saham (MM) |
Nilai (MM$) |
Portfolio % | ΔPortfolio % |
|---|---|---|---|---|
| 0.09 | 2.18 | 0.9302 | -0.7056 | |
| 0.05 | 2.14 | 0.9143 | -0.5663 | |
| 0.11 | 2.00 | 0.8541 | -0.4922 | |
| 0.01 | 2.05 | 0.8755 | -0.4683 | |
| 0.07 | 1.76 | 0.7500 | -0.4466 | |
| 0.04 | 1.95 | 0.8342 | -0.4466 | |
| 0.00 | 0.00 | -0.4077 | ||
| 0.01 | 0.78 | 0.3335 | -0.3645 | |
| 0.04 | 2.94 | 1.2565 | -0.3102 | |
| 0.02 | 1.14 | 0.4852 | -0.3057 |
13F dan Pemfailan Dana
Borang ini telah difailkan pada 2025-08-26 untuk tempoh pelaporan 2025-06-30. Klik ikon pautan untuk melihat sejarah transaksi penuh.
Tingkatkan untuk membuka data premium dan eksport ke Excel ![]() .
.
| Sekuriti | Jenis | Purata Harga Saham | Saham (MM) |
ΔSaham (%) |
ΔSaham (%) |
Nilai ($MM) |
Portfolio (%) |
ΔPortfolio (%) |
|
|---|---|---|---|---|---|---|---|---|---|
| FBP / First BanCorp. | 0.19 | -4.70 | 4.04 | 3.54 | 1.7247 | 0.0405 | |||
| IWM / iShares Trust - iShares Russell 2000 ETF | 0.02 | -14.70 | 3.55 | -7.72 | 1.5160 | -0.1453 | |||
| BOX / Box, Inc. | 0.10 | -0.19 | 3.46 | 10.51 | 1.4758 | 0.1254 | |||
| QGEN / Qiagen N.V. | 0.07 | 68.67 | 3.37 | 101.92 | 1.4364 | 0.7170 | |||
| AVPT / AvePoint, Inc. | 0.17 | -1.94 | 3.22 | 31.16 | 1.3758 | 0.3149 | |||
| HWC / Hancock Whitney Corporation | 0.05 | 7.26 | 3.12 | 17.37 | 1.3326 | 0.1846 | |||
| FLS / Flowserve Corporation | 0.06 | 8.05 | 2.94 | 15.81 | 1.2567 | 0.1594 | |||
| NVT / nVent Electric plc | 0.04 | -41.96 | 2.94 | -18.90 | 1.2565 | -0.3102 | |||
| SFM / Sprouts Farmers Market, Inc. | 0.02 | 2.88 | 1.2292 | 1.2292 | |||||
| ESI / Element Solutions Inc | 0.13 | -5.24 | 2.86 | -5.08 | 1.2204 | -0.0795 | |||
| INSM / Insmed Incorporated | 0.03 | -12.87 | 2.64 | 30.90 | 1.1245 | 0.4075 | |||
| MUR / Murphy Oil Corporation | 0.11 | 11.56 | 2.45 | -11.60 | 1.0469 | -0.1508 | |||
| VCTR / Victory Capital Holdings, Inc. | 0.04 | -11.70 | 2.42 | -2.89 | 1.0335 | -0.0423 | |||
| COHU / Cohu, Inc. | 0.11 | 32.47 | 2.21 | 73.37 | 0.9419 | 0.3922 | |||
| MWA / Mueller Water Products, Inc. | 0.09 | -39.20 | 2.18 | -42.51 | 0.9302 | -0.7056 | |||
| EXLS / ExlService Holdings, Inc. | 0.05 | -32.68 | 2.14 | -37.57 | 0.9143 | -0.5663 | |||
| CANTOR FITZGERALD SECURITIES / RA (000000000) | 2.14 | 0.9139 | 0.9139 | ||||||
| DAIWA CAPITAL MARKETS AMERICA INC / RA (000000000) | 2.14 | 0.9139 | 0.9139 | ||||||
| UCB / United Community Banks, Inc. | 0.07 | 31.78 | 2.13 | 39.57 | 0.9079 | 0.2500 | |||
| MTW / The Manitowoc Company, Inc. | 0.18 | 1.08 | 2.11 | 41.46 | 0.9014 | 0.2569 | |||
| HRB / H&R Block, Inc. | 0.04 | 107.57 | 2.07 | 107.64 | 0.8818 | 0.4521 | |||
| AIT / Applied Industrial Technologies, Inc. | 0.01 | -36.14 | 2.05 | -34.14 | 0.8755 | -0.4683 | |||
| STATE OF WISCONSIN INVESTMENT BOARD / RA (000000000) | 2.03 | 0.8682 | 0.8682 | ||||||
| CRDO / Credo Technology Group Holding Ltd | 0.02 | -0.87 | 2.00 | 128.54 | 0.8545 | 0.4764 | |||
| AKR / Acadia Realty Trust | 0.11 | -27.62 | 2.00 | -35.84 | 0.8541 | -0.4922 | |||
| VERX / Vertex, Inc. | 0.06 | 10.60 | 1.98 | 11.59 | 0.8469 | 0.0797 | |||
| VLY / Valley National Bancorp | 0.22 | 44.45 | 1.98 | 45.05 | 0.8452 | 0.2562 | |||
| ACIW / ACI Worldwide, Inc. | 0.04 | -21.51 | 1.95 | -34.16 | 0.8342 | -0.4466 | |||
| PNR / Pentair plc | 0.02 | -4.14 | 1.95 | 12.55 | 0.8304 | 0.0840 | |||
| OPCH / Option Care Health, Inc. | 0.06 | 45.12 | 1.93 | 34.89 | 0.8249 | 0.2064 | |||
| AVA / Avista Corporation | 0.05 | 23.98 | 1.93 | 12.38 | 0.8215 | 0.0823 | |||
| TPH / Tri Pointe Homes, Inc. | 0.06 | 16.55 | 1.90 | 16.69 | 0.8087 | 0.1077 | |||
| EE / Excelerate Energy, Inc. | 0.06 | -12.85 | 1.87 | -10.94 | 0.7997 | -0.1079 | |||
| ALSN / Allison Transmission Holdings, Inc. | 0.02 | -10.29 | 1.84 | -10.96 | 0.7872 | -0.1064 | |||
| FTAI / FTAI Aviation Ltd. | 0.02 | 1.80 | 0.7700 | 0.7700 | |||||
| RRR / Red Rock Resorts, Inc. | 0.03 | -11.53 | 1.80 | 6.15 | 0.7662 | 0.0362 | |||
| GEO / The GEO Group, Inc. | 0.07 | -22.70 | 1.76 | -36.64 | 0.7500 | -0.4466 | |||
| YEXT / Yext, Inc. | 0.20 | 26.68 | 1.74 | 74.87 | 0.7428 | 0.3131 | |||
| EBC / Eastern Bankshares, Inc. | 0.11 | -12.43 | 1.70 | -18.47 | 0.7273 | -0.1747 | |||
| HQY / HealthEquity, Inc. | 0.02 | 18.03 | 1.66 | 39.98 | 0.7099 | 0.1969 | |||
| BRKR / Bruker Corporation | 0.04 | 27.21 | 1.66 | 25.60 | 0.7097 | 0.1382 | |||
| FULT / Fulton Financial Corporation | 0.09 | -7.99 | 1.65 | -8.26 | 0.7060 | -0.0720 | |||
| MGNI / Magnite, Inc. | 0.07 | -6.44 | 1.65 | 97.84 | 0.7027 | 0.3434 | |||
| GH / Guardant Health, Inc. | 0.03 | -10.29 | 1.64 | 9.61 | 0.7010 | 0.0542 | |||
| LECO / Lincoln Electric Holdings, Inc. | 0.01 | 2.90 | 1.63 | 12.75 | 0.6946 | 0.0718 | |||
| CXW / CoreCivic, Inc. | 0.08 | -11.74 | 1.59 | -8.39 | 0.6806 | -0.0703 | |||
| ADMA / ADMA Biologics, Inc. | 0.09 | -12.14 | 1.57 | -19.40 | 0.6704 | -0.1703 | |||
| UG6 / SFL Corporation Ltd. | 0.18 | 151.62 | 1.53 | 155.50 | 0.6545 | 0.3956 | |||
| CNOB / ConnectOne Bancorp, Inc. | 0.07 | -11.26 | 1.52 | -15.48 | 0.6503 | -0.1275 | |||
| BTSG / BrightSpring Health Services, Inc. | 0.06 | -11.99 | 1.52 | 14.74 | 0.6480 | 0.0770 | |||
| HSBC SECURITIES (USA) INC / RA (000000000) | 1.50 | 0.6402 | 0.6402 | ||||||
| LFUS / Littelfuse, Inc. | 0.01 | 28.58 | 1.49 | 48.21 | 0.6351 | 0.2017 | |||
| BGC / BGC Group, Inc. | 0.15 | -9.92 | 1.49 | 0.47 | 0.6345 | -0.0040 | |||
| CWAN / Clearwater Analytics Holdings, Inc. | 0.07 | 12.41 | 1.48 | -8.01 | 0.6323 | -0.0628 | |||
| CLF / Cleveland-Cliffs Inc. | 0.19 | 7.90 | 1.47 | -0.27 | 0.6292 | -0.0085 | |||
| ATEN / A10 Networks, Inc. | 0.08 | -10.29 | 1.46 | 6.25 | 0.6246 | 0.0301 | |||
| GNW / Genworth Financial, Inc. | 0.18 | 0.10 | 1.42 | 9.84 | 0.6053 | 0.0480 | |||
| EPAC / Enerpac Tool Group Corp. | 0.03 | -13.03 | 1.41 | -21.37 | 0.6031 | -0.1724 | |||
| PSTG / Pure Storage, Inc. | 0.02 | -32.02 | 1.41 | -11.58 | 0.5996 | -0.0862 | |||
| LADR / Ladder Capital Corp | 0.13 | -0.74 | 1.40 | -6.48 | 0.5971 | -0.0485 | |||
| BHLB / Berkshire Hills Bancorp, Inc. | 0.06 | 7.18 | 1.39 | 2.89 | 0.5925 | 0.0101 | |||
| NWE / NorthWestern Energy Group, Inc. | 0.03 | 1.38 | 0.5875 | 0.5875 | |||||
| DRH / DiamondRock Hospitality Company | 0.18 | 9.69 | 1.36 | 8.83 | 0.5790 | 0.0410 | |||
| PRIM / Primoris Services Corporation | 0.02 | 1.34 | 0.5729 | 0.5729 | |||||
| BCRX / BioCryst Pharmaceuticals, Inc. | 0.15 | -5.79 | 1.34 | 12.50 | 0.5726 | 0.0581 | |||
| AIV / Apartment Investment and Management Company | 0.15 | -12.72 | 1.33 | -14.23 | 0.5662 | -0.1011 | |||
| CTS / CTS Corporation | 0.03 | -10.52 | 1.33 | -8.24 | 0.5661 | -0.0577 | |||
| AROW / Arrow Financial Corporation | 0.05 | -12.99 | 1.32 | -12.52 | 0.5638 | -0.0882 | |||
| SFNC / Simmons First National Corporation | 0.07 | 27.75 | 1.29 | 17.99 | 0.5514 | 0.0788 | |||
| CXM / Sprinklr, Inc. | 0.15 | 12.31 | 1.29 | 13.77 | 0.5504 | 0.0613 | |||
| ALHC / Alignment Healthcare, Inc. | 0.09 | 111.63 | 1.28 | 59.13 | 0.5467 | 0.1993 | |||
| CSGS / CSG Systems International, Inc. | 0.02 | -8.71 | 1.27 | -1.39 | 0.5439 | -0.0139 | |||
| IONQ / IonQ, Inc. | 0.03 | 1.27 | 0.5428 | 0.5428 | |||||
| RWT / Redwood Trust, Inc. | 0.21 | 0.33 | 1.26 | -2.33 | 0.5368 | -0.0189 | |||
| FR / First Industrial Realty Trust, Inc. | 0.03 | 135.60 | 1.26 | 110.22 | 0.5356 | 0.2779 | |||
| DBX / Dropbox, Inc. | 0.04 | 9.12 | 1.25 | 16.85 | 0.5328 | 0.0717 | |||
| INTA / Intapp, Inc. | 0.02 | -4.31 | 1.25 | -15.39 | 0.5328 | -0.1039 | |||
| MFA / MFA Financial, Inc. | 0.13 | 39.95 | 1.25 | 29.09 | 0.5323 | 0.1152 | |||
| SHYF / The Shyft Group, Inc. | 0.10 | 2.37 | 1.24 | 58.75 | 0.5306 | 0.1925 | |||
| WT / WisdomTree, Inc. | 0.11 | -2.48 | 1.24 | 25.87 | 0.5276 | 0.1036 | |||
| POR / Portland General Electric Company | 0.03 | 120.80 | 1.24 | 101.14 | 0.5272 | 0.2622 | |||
| DOLE / Dole plc | 0.09 | -4.65 | 1.23 | -7.72 | 0.5256 | -0.0501 | |||
| PAYO / Payoneer Global Inc. | 0.18 | -3.38 | 1.22 | -9.47 | 0.5227 | -0.0611 | |||
| XP / XP Inc. | 0.06 | -1.13 | 1.21 | 45.30 | 0.5147 | 0.1564 | |||
| PHR / Phreesia, Inc. | 0.04 | -1.33 | 1.20 | 9.85 | 0.5140 | 0.0409 | |||
| ASTS / AST SpaceMobile, Inc. | 0.03 | 1.19 | 0.5093 | 0.5093 | |||||
| PX / P10, Inc. | 0.12 | 112.20 | 1.19 | 84.63 | 0.5078 | 0.2296 | |||
| HOPE / Hope Bancorp, Inc. | 0.11 | 30.15 | 1.19 | 33.45 | 0.5076 | 0.1228 | |||
| PGNY / Progyny, Inc. | 0.05 | 13.83 | 1.18 | -55.30 | 0.5043 | -0.0921 | |||
| YELP / Yelp Inc. | 0.03 | -2.58 | 1.17 | -9.85 | 0.5005 | -0.0608 | |||
| FELE / Franklin Electric Co., Inc. | 0.01 | -5.45 | 1.15 | -9.65 | 0.4915 | -0.0584 | |||
| SPNS / Sapiens International Corporation N.V. | 0.04 | 14.87 | 1.15 | 23.95 | 0.4907 | 0.0906 | |||
| BCPC / Balchem Corporation | 0.01 | -10.28 | 1.15 | -13.95 | 0.4895 | -0.0858 | |||
| CDRE / Cadre Holdings, Inc. | 0.04 | 70.56 | 1.14 | 83.60 | 0.4877 | 0.2189 | |||
| KMT / Kennametal Inc. | 0.05 | -10.32 | 1.14 | -3.31 | 0.4859 | -0.0224 | |||
| NSP / Insperity, Inc. | 0.02 | -7.93 | 1.14 | -37.99 | 0.4852 | -0.3057 | |||
| HTH / Hilltop Holdings Inc. | 0.04 | -12.49 | 1.13 | -12.79 | 0.4803 | -0.0765 | |||
| BKH / Black Hills Corporation | 0.02 | 54.11 | 1.11 | 41.45 | 0.4733 | 0.2151 | |||
| ZETA / Zeta Global Holdings Corp. | 0.07 | 24.75 | 1.10 | 42.43 | 0.4702 | 0.1365 | |||
| ASGN / ASGN Incorporated | 0.02 | -11.16 | 1.10 | -29.62 | 0.4688 | -0.2047 | |||
| DNOW / DNOW Inc. | 0.07 | -13.64 | 1.10 | -25.05 | 0.4676 | -0.1629 | |||
| RNST / Renasant Corporation | 0.03 | -12.30 | 1.07 | -7.09 | 0.4585 | -0.0407 | |||
| APOG / Apogee Enterprises, Inc. | 0.03 | -18.71 | 1.06 | -28.77 | 0.4512 | -0.1893 | |||
| PLAB / Photronics, Inc. | 0.06 | -10.41 | 1.05 | -18.76 | 0.4474 | -0.1094 | |||
| INN / Summit Hotel Properties, Inc. | 0.20 | 35.51 | 1.04 | 27.45 | 0.4441 | 0.0919 | |||
| HIMS / Hims & Hers Health, Inc. | 0.02 | -47.15 | 1.04 | -10.82 | 0.4435 | -0.0595 | |||
| UEC / Uranium Energy Corp. | 0.15 | 1.04 | 0.4429 | 0.4429 | |||||
| VRNT / Verint Systems Inc. | 0.05 | 8.30 | 1.04 | 19.35 | 0.4421 | 0.0675 | |||
| FCF / First Commonwealth Financial Corporation | 0.06 | 1.03 | 0.4398 | 0.4398 | |||||
| KN / Knowles Corporation | 0.06 | -11.61 | 1.03 | 2.39 | 0.4390 | 0.0057 | |||
| UAA / Under Armour, Inc. | 0.15 | -1.88 | 1.03 | 7.20 | 0.4385 | 0.0250 | |||
| FMNB / Farmers National Banc Corp. | 0.07 | -12.63 | 1.03 | -7.65 | 0.4378 | -0.0417 | |||
| FOLD / Amicus Therapeutics, Inc. | 0.18 | 10.06 | 1.02 | -22.78 | 0.4344 | -0.1340 | |||
| RYTM / Rhythm Pharmaceuticals, Inc. | 0.02 | -21.27 | 1.01 | -6.11 | 0.4331 | -0.0332 | |||
| GRND / Grindr Inc. | 0.04 | -16.54 | 1.00 | 5.83 | 0.4264 | 0.0190 | |||
| SABR / Sabre Corporation | 0.32 | 17.01 | 1.00 | 31.66 | 0.4261 | 0.0987 | |||
| MIRM / Mirum Pharmaceuticals, Inc. | 0.02 | 0.99 | 0.4229 | 0.4229 | |||||
| MCRI / Monarch Casino & Resort, Inc. | 0.01 | 46.56 | 0.98 | 63.17 | 0.4178 | 0.1585 | |||
| INGM / Ingram Micro Holding Corporation | 0.05 | 63.18 | 0.98 | 91.94 | 0.4171 | 0.1971 | |||
| PTCT / PTC Therapeutics, Inc. | 0.02 | 9.22 | 0.97 | 4.66 | 0.4126 | 0.0140 | |||
| TECH / Bio-Techne Corporation | 0.02 | -21.25 | 0.96 | -30.92 | 0.4114 | -0.1906 | |||
| AVNS / Avanos Medical, Inc. | 0.08 | 3.04 | 0.96 | -12.00 | 0.4105 | -0.0611 | |||
| PAGS / PagSeguro Digital Ltd. | 0.10 | -37.05 | 0.95 | -20.42 | 0.4042 | -0.1097 | |||
| OBK / Origin Bancorp, Inc. | 0.03 | 4.87 | 0.94 | 8.18 | 0.4007 | 0.0259 | |||
| SONO / Sonos, Inc. | 0.09 | 4.10 | 0.93 | 5.54 | 0.3987 | 0.0164 | |||
| ATMU / Atmus Filtration Technologies Inc. | 0.03 | -19.35 | 0.93 | -20.05 | 0.3985 | -0.1054 | |||
| CLNE / Clean Energy Fuels Corp. | 0.47 | 23.18 | 0.91 | 54.84 | 0.3896 | 0.1354 | |||
| CATY / Cathay General Bancorp | 0.02 | 41.99 | 0.90 | 50.25 | 0.3858 | 0.1261 | |||
| HE / Hawaiian Electric Industries, Inc. | 0.09 | -12.70 | 0.90 | -15.29 | 0.3856 | -0.0745 | |||
| HLX / Helix Energy Solutions Group, Inc. | 0.14 | 94.01 | 0.87 | 45.55 | 0.3700 | 0.1132 | |||
| NSA / National Storage Affiliates Trust | 0.03 | -28.17 | 0.86 | -41.68 | 0.3680 | -0.2700 | |||
| JBSS / John B. Sanfilippo & Son, Inc. | 0.01 | 0.86 | 0.3677 | 0.3677 | |||||
| SHOO / Steven Madden, Ltd. | 0.04 | -14.98 | 0.86 | -23.47 | 0.3677 | -0.1181 | |||
| LTC / LTC Properties, Inc. | 0.02 | 0.86 | 0.3658 | 0.3658 | |||||
| HPP / Hudson Pacific Properties, Inc. | 0.31 | -20.64 | 0.84 | -26.32 | 0.3586 | -0.1333 | |||
| MMSI / Merit Medical Systems, Inc. | 0.01 | -10.27 | 0.84 | -20.66 | 0.3573 | -0.0980 | |||
| TNET / TriNet Group, Inc. | 0.01 | 0.84 | 0.3564 | 0.3564 | |||||
| PCT / PureCycle Technologies, Inc. | 0.06 | 0.83 | 0.3552 | 0.3552 | |||||
| HNRG / Hallador Energy Company | 0.05 | 0.82 | 0.3514 | 0.3514 | |||||
| SEM / Select Medical Holdings Corporation | 0.05 | -9.55 | 0.82 | -17.74 | 0.3505 | -0.0806 | |||
| MXL / MaxLinear, Inc. | 0.06 | -10.95 | 0.82 | 16.60 | 0.3479 | 0.0460 | |||
| CERS / Cerus Corporation | 0.57 | -1.24 | 0.81 | 0.25 | 0.3458 | -0.0032 | |||
| NTLA / Intellia Therapeutics, Inc. | 0.09 | 36.40 | 0.80 | 79.95 | 0.3413 | 0.1495 | |||
| NWN / Northwest Natural Holding Company | 0.02 | 10.61 | 0.80 | 2.84 | 0.3406 | 0.0057 | |||
| AVNT / Avient Corporation | 0.02 | 71.01 | 0.80 | 48.69 | 0.3403 | 0.1089 | |||
| PKST / Peakstone Realty Trust | 0.06 | 10.69 | 0.79 | 16.03 | 0.3369 | 0.0434 | |||
| SWTX / SpringWorks Therapeutics, Inc. | 0.02 | 0.78 | 0.3338 | 0.3338 | |||||
| RMBS / Rambus Inc. | 0.01 | -60.92 | 0.78 | -51.70 | 0.3335 | -0.3645 | |||
| ZIP / ZipRecruiter, Inc. | 0.15 | -10.88 | 0.76 | -24.18 | 0.3254 | -0.1087 | |||
| NBTB / NBT Bancorp Inc. | 0.02 | -8.98 | 0.76 | -11.89 | 0.3228 | -0.0475 | |||
| ALEX / Alexander & Baldwin, Inc. | 0.04 | 0.76 | 0.3225 | 0.3225 | |||||
| TVTX / Travere Therapeutics, Inc. | 0.05 | 28.24 | 0.75 | 5.92 | 0.3212 | 0.0145 | |||
| INOD / Innodata Inc. | 0.01 | 0.75 | 0.3195 | 0.3195 | |||||
| AIN / Albany International Corp. | 0.01 | -12.85 | 0.74 | -11.52 | 0.3149 | -0.0448 | |||
| PD / PagerDuty, Inc. | 0.05 | -9.90 | 0.72 | -24.69 | 0.3088 | -0.1056 | |||
| EGHT / 8x8, Inc. | 0.37 | 23.97 | 0.72 | 21.62 | 0.3074 | 0.0515 | |||
| CNO / CNO Financial Group, Inc. | 0.02 | -19.61 | 0.72 | -25.60 | 0.3067 | -0.1098 | |||
| BCBP / BCB Bancorp, Inc. | 0.08 | -22.60 | 0.71 | -33.93 | 0.3020 | -0.1600 | |||
| FTRE / Fortrea Holdings Inc. | 0.14 | 121.82 | 0.70 | 45.15 | 0.3008 | 0.0912 | |||
| AMPL / Amplitude, Inc. | 0.06 | 15.11 | 0.70 | 40.08 | 0.2987 | 0.0830 | |||
| VMEO / Vimeo, Inc. | 0.17 | 6.24 | 0.69 | -18.35 | 0.2963 | -0.0709 | |||
| TNDM / Tandem Diabetes Care, Inc. | 0.04 | 31.59 | 0.69 | 28.12 | 0.2938 | 0.0617 | |||
| PLYM / Plymouth Industrial REIT, Inc. | 0.04 | 9.61 | 0.67 | 8.01 | 0.2877 | 0.0183 | |||
| HPK / HighPeak Energy, Inc. | 0.07 | 44.01 | 0.67 | 11.56 | 0.2843 | 0.0264 | |||
| SGRY / Surgery Partners, Inc. | 0.03 | -19.44 | 0.64 | -24.62 | 0.2748 | -0.0937 | |||
| CARG / CarGurus, Inc. | 0.02 | 0.63 | 0.2702 | 0.2702 | |||||
| MRTN / Marten Transport, Ltd. | 0.05 | -7.39 | 0.62 | -12.36 | 0.2664 | -0.0408 | |||
| SVRA / Savara Inc. | 0.27 | 0.62 | 0.2641 | 0.2641 | |||||
| IOSP / Innospec Inc. | 0.01 | -8.99 | 0.61 | -19.26 | 0.2614 | -0.0659 | |||
| UDMY / Udemy, Inc. | 0.09 | -8.90 | 0.61 | -17.46 | 0.2605 | -0.0587 | |||
| RC / Ready Capital Corporation | 0.14 | -11.31 | 0.61 | -23.87 | 0.2589 | -0.0849 | |||
| MNKD / MannKind Corporation | 0.16 | 13.56 | 0.60 | -15.52 | 0.2578 | -0.0509 | |||
| VIAV / Viavi Solutions Inc. | 0.06 | -27.69 | 0.60 | -34.91 | 0.2578 | -0.1428 | |||
| EXTR / Extreme Networks, Inc. | 0.03 | 0.60 | 0.2576 | 0.2576 | |||||
| OFIX / Orthofix Medical Inc. | 0.05 | 57.14 | 0.60 | 7.49 | 0.2574 | 0.0151 | |||
| TROX / Tronox Holdings plc | 0.12 | -15.84 | 0.60 | -39.41 | 0.2542 | -0.1699 | |||
| RIGL / Rigel Pharmaceuticals, Inc. | 0.03 | 58.54 | 0.59 | 65.35 | 0.2507 | 0.0971 | |||
| GTM / ZoomInfo Technologies Inc. | 0.06 | -39.09 | 0.58 | -38.34 | 0.2472 | -0.1583 | |||
| OPK / OPKO Health, Inc. | 0.43 | 22.16 | 0.57 | -2.72 | 0.2441 | -0.0100 | |||
| LAND / Gladstone Land Corporation | 0.06 | -10.32 | 0.57 | -13.22 | 0.2438 | -0.0406 | |||
| SKT / Tanger Inc. | 0.02 | -29.24 | 0.57 | -36.01 | 0.2415 | -0.1398 | |||
| RYAM / Rayonier Advanced Materials Inc. | 0.15 | 12.85 | 0.57 | -24.47 | 0.2412 | -0.0816 | |||
| BNL / Broadstone Net Lease, Inc. | 0.03 | -20.89 | 0.56 | -25.53 | 0.2391 | -0.0854 | |||
| KREF / KKR Real Estate Finance Trust Inc. | 0.06 | -2.57 | 0.55 | -20.98 | 0.2351 | -0.0654 | |||
| MPW / Medical Properties Trust, Inc. | 0.12 | -24.99 | 0.53 | -46.43 | 0.2278 | -0.2018 | |||
| US61747C7074 / Morgan Stanley Institutional Liquidity Funds Government Portfolio, Institutional Class | 0.44 | -40.38 | 0.44 | -40.38 | 0.1865 | -0.1298 | |||
| BNP PARIBAS SA / RA (000000000) | 0.31 | 0.1337 | 0.1337 | ||||||
| MIZUHO BANK LTD (NEW YORK BRANCH) / DBT (000000000) | 0.21 | 0.0896 | 0.0896 | ||||||
| ROYAL BANK OF CANADA (TORONTO BRANCH) / DBT (000000000) | 0.21 | 0.0896 | 0.0896 | ||||||
| CANADIAN IMPERIAL BANK OF COMMERCE (TORONTO BRANCH) / DBT (000000000) | 0.21 | 0.0896 | 0.0896 | ||||||
| LANDESBANK HESSEN THUERINGEN GIROZENTRALE(NEW YORK BRANCH) / DBT (000000000) | 0.20 | 0.0853 | 0.0853 | ||||||
| AOSL / Alpha and Omega Semiconductor Limited | 0.00 | -100.00 | 0.00 | -100.00 | -0.2580 | ||||
| MDU / MDU Resources Group, Inc. | 0.00 | -100.00 | 0.00 | -100.00 | -0.4077 |