Statistik Asas
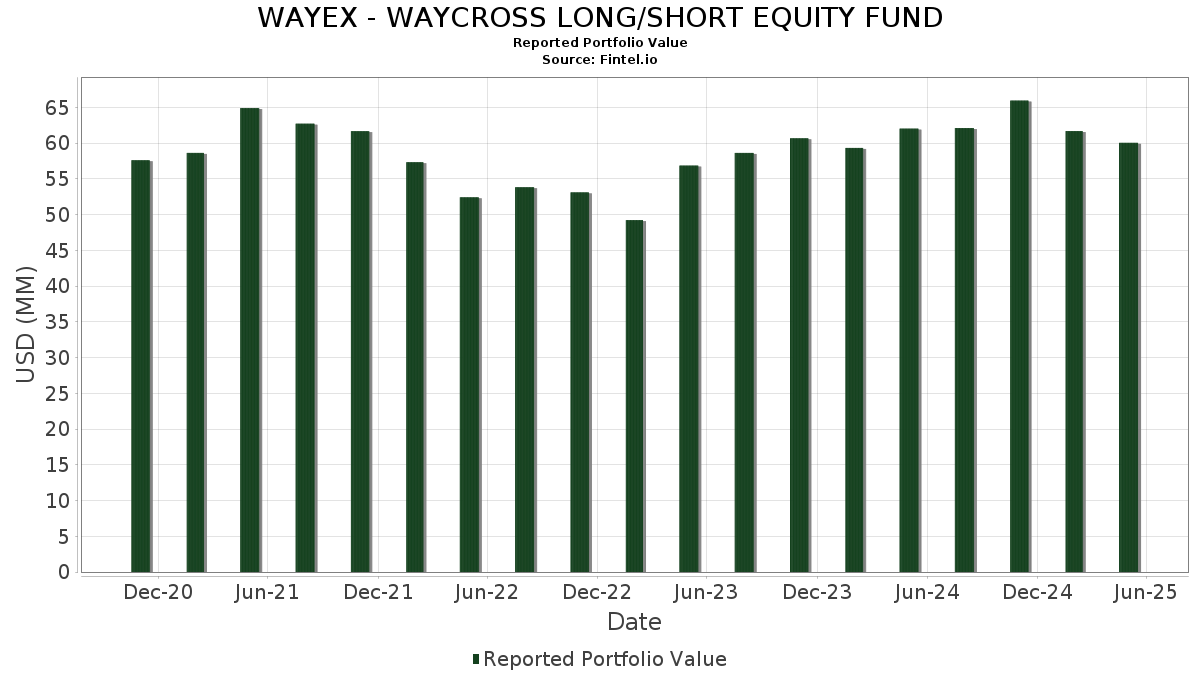
| Nilai Portfolio | $ 60,049,555 |
| Kedudukan Semasa | 98 |
Pegangan Terkini, Prestasi, AUM (dari 13F, 13D)
WAYEX - WAYCROSS LONG/SHORT EQUITY FUND telah mendedahkan 98 jumlah pegangan dalam pemfailan SEC terkini mereka. Nilai portfolio terkini dikira sebagai $ 60,049,555 USD. Aset Sebenar Di Bawah Pengurusan (AUM) ialah nilai ini ditambah dengan tunai (yang tidak didedahkan). Pegangan teratas WAYEX - WAYCROSS LONG/SHORT EQUITY FUND ialah Fidelity Colchester Street Trust - Fidelity Institutional Money Market Funds Government Portfolio Class I (US:FIGXX) , Microsoft Corporation (US:MSFT) , NVIDIA Corporation (US:NVDA) , Amazon.com, Inc. (US:AMZN) , and Meta Platforms, Inc. (US:META) . Kedudukan baharu WAYEX - WAYCROSS LONG/SHORT EQUITY FUND termasuk Fidelity Colchester Street Trust - Fidelity Institutional Money Market Funds Government Portfolio Class I (US:FIGXX) , Stanley Black & Decker, Inc. (US:SWK) , BlackRock, Inc. (US:BLK) , NXP Semiconductors N.V. (US:NXPI) , and The Southern Company (US:SO) .
Kenaikan Teratas Suku Tahun Ini
Kami menggunakan perubahan dalam peruntukan portfolio kerana ini adalah metrik yang paling bermakna. Perubahan boleh disebabkan oleh perdagangan atau perubahan dalam harga saham.
| Sekuriti | Saham (MM) |
Nilai (MM$) |
Portfolio % | ΔPortfolio % |
|---|---|---|---|---|
| 0.00 | 0.00 | 1.1596 | ||
| 0.00 | 1.60 | 1.5299 | 1.1456 | |
| 0.02 | 1.18 | 1.1257 | 1.1257 | |
| 0.00 | 0.00 | 1.1123 | ||
| 0.00 | 1.15 | 1.1005 | 1.1005 | |
| 0.01 | 2.61 | 2.4931 | 1.0652 | |
| 0.01 | 4.97 | 4.7466 | 0.9705 | |
| 0.00 | 0.00 | 0.9054 | ||
| 0.00 | 0.81 | 0.7699 | 0.7699 | |
| 0.00 | 0.00 | 0.7411 |
Penurunan Teratas Suku Tahun Ini
Kami menggunakan perubahan dalam peruntukan portfolio kerana ini adalah metrik yang paling bermakna. Perubahan boleh disebabkan oleh perdagangan atau perubahan dalam harga saham.
| Sekuriti | Saham (MM) |
Nilai (MM$) |
Portfolio % | ΔPortfolio % |
|---|---|---|---|---|
| -0.01 | -1.05 | -1.0055 | -1.8574 | |
| -0.00 | -0.78 | -0.7436 | -1.6881 | |
| -0.01 | -1.25 | -1.1986 | -1.1986 | |
| -0.01 | -1.00 | -0.9602 | -0.9602 | |
| 0.01 | 0.73 | 0.6938 | -0.7963 | |
| -0.01 | -0.79 | -0.7547 | -0.7547 | |
| 0.00 | 0.68 | 0.6467 | -0.7376 | |
| 0.00 | 0.00 | -0.7136 | ||
| 0.05 | 1.50 | 1.4355 | -0.6425 | |
| 0.00 | 1.13 | 1.0785 | -0.5980 |
13F dan Pemfailan Dana
Borang ini telah difailkan pada 2025-07-29 untuk tempoh pelaporan 2025-05-31. Klik ikon pautan untuk melihat sejarah transaksi penuh.
Tingkatkan untuk membuka data premium dan eksport ke Excel ![]() .
.
| Sekuriti | Jenis | Purata Harga Saham | Saham (MM) |
ΔSaham (%) |
ΔSaham (%) |
Nilai ($MM) |
Portfolio (%) |
ΔPortfolio (%) |
|
|---|---|---|---|---|---|---|---|---|---|
| FIGXX / Fidelity Colchester Street Trust - Fidelity Institutional Money Market Funds Government Portfolio Class I | 8.03 | -1.31 | 7.6793 | -0.0374 | |||||
| MSFT / Microsoft Corporation | 0.01 | 7.49 | 4.97 | 24.65 | 4.7466 | 0.9705 | |||
| NVDA / NVIDIA Corporation | 0.03 | 0.90 | 3.80 | 9.16 | 3.6334 | 0.3323 | |||
| AMZN / Amazon.com, Inc. | 0.01 | -3.18 | 3.06 | -6.50 | 2.9280 | -0.1773 | |||
| META / Meta Platforms, Inc. | 0.00 | 8.69 | 3.04 | 5.31 | 2.9026 | 0.1697 | |||
| GOOGL / Alphabet Inc. | 0.02 | 8.49 | 2.69 | 9.40 | 2.5702 | 0.2408 | |||
| BA / The Boeing Company | 0.01 | 15.28 | 2.68 | 36.89 | 2.5651 | 0.7065 | |||
| AVGO / Broadcom Inc. | 0.01 | 42.64 | 2.61 | 73.17 | 2.4931 | 1.0652 | |||
| MA / Mastercard Incorporated | 0.00 | 7.67 | 2.56 | 9.39 | 2.4505 | 0.2294 | |||
| ISRG / Intuitive Surgical, Inc. | 0.00 | 6.98 | 2.45 | 3.12 | 2.3372 | 0.0892 | |||
| WFC / Wells Fargo & Company | 0.03 | 7.63 | 2.42 | 2.76 | 2.3110 | 0.0809 | |||
| ABBV / AbbVie Inc. | 0.01 | 7.01 | 2.41 | -4.74 | 2.3042 | -0.0940 | |||
| AAPL / Apple Inc. | 0.01 | -5.36 | 2.34 | -21.41 | 2.2324 | -0.5842 | |||
| LOW / Lowe's Companies, Inc. | 0.01 | 10.88 | 2.15 | 0.70 | 2.0579 | 0.0306 | |||
| GS / The Goldman Sachs Group, Inc. | 0.00 | 8.84 | 2.11 | 4.99 | 2.0139 | 0.1123 | |||
| C / Citigroup Inc. | 0.03 | 8.44 | 1.89 | 2.16 | 1.8057 | 0.0530 | |||
| ADI / Analog Devices, Inc. | 0.01 | -8.88 | 1.87 | -15.24 | 1.7870 | -0.3038 | |||
| WMT / Walmart Inc. | 0.02 | 3.93 | 1.80 | 4.06 | 1.7161 | 0.0804 | |||
| MAR / Marriott International, Inc. | 0.01 | 3.93 | 1.65 | -2.20 | 1.5726 | -0.0224 | |||
| EMR / Emerson Electric Co. | 0.01 | 3.93 | 1.64 | 2.05 | 1.5705 | 0.0439 | |||
| INTU / Intuit Inc. | 0.00 | 3.91 | 1.62 | 27.56 | 1.5491 | 0.3447 | |||
| SCHW / The Charles Schwab Corporation | 0.02 | -13.69 | 1.60 | -4.13 | 1.5305 | -0.0526 | |||
| NOW / ServiceNow, Inc. | 0.00 | 263.07 | 1.60 | 295.06 | 1.5299 | 1.1456 | |||
| ORLY / O'Reilly Automotive, Inc. | 0.00 | 3.93 | 1.59 | 3.45 | 1.5215 | 0.0632 | |||
| COR / Cencora, Inc. | 0.01 | 3.92 | 1.57 | 19.35 | 1.5044 | 0.2547 | |||
| TFC / Truist Financial Corporation | 0.04 | 3.93 | 1.56 | -11.45 | 1.4871 | -0.1780 | |||
| EOG / EOG Resources, Inc. | 0.01 | 6.56 | 1.55 | -8.85 | 1.4775 | -0.1301 | |||
| BSX / Boston Scientific Corporation | 0.01 | 3.93 | 1.52 | 5.43 | 1.4482 | 0.0857 | |||
| ABT / Abbott Laboratories | 0.01 | 3.93 | 1.51 | 0.60 | 1.4464 | 0.0205 | |||
| FITB / Fifth Third Bancorp | 0.04 | 3.93 | 1.51 | -8.66 | 1.4416 | -0.1241 | |||
| CSX / CSX Corporation | 0.05 | -30.58 | 1.50 | -31.52 | 1.4355 | -0.6425 | |||
| CHKP / Check Point Software Technologies Ltd. | 0.01 | 21.57 | 1.47 | 26.31 | 1.4096 | 0.3030 | |||
| CRM / Salesforce, Inc. | 0.01 | 8.88 | 1.42 | -3.02 | 1.3532 | -0.0302 | |||
| TJX / The TJX Companies, Inc. | 0.01 | 3.93 | 1.39 | 5.69 | 1.3315 | 0.0824 | |||
| IR / Ingersoll Rand Inc. | 0.02 | 24.32 | 1.39 | 19.72 | 1.3291 | 0.2282 | |||
| NKE / NIKE, Inc. | 0.02 | 25.05 | 1.38 | -4.57 | 1.3181 | -0.0521 | |||
| BKR / Baker Hughes Company | 0.04 | 3.93 | 1.37 | -13.64 | 1.3139 | -0.1950 | |||
| XEL / Xcel Energy Inc. | 0.02 | -24.98 | 1.35 | -27.05 | 1.2868 | -0.4627 | |||
| TMUS / T-Mobile US, Inc. | 0.01 | -12.97 | 1.31 | -21.89 | 1.2492 | -0.3357 | |||
| CSL / Carlisle Companies Incorporated | 0.00 | 15.74 | 1.28 | 29.16 | 1.2239 | 0.2840 | |||
| SBUX / Starbucks Corporation | 0.01 | 3.93 | 1.22 | -24.68 | 1.1705 | -0.3703 | |||
| EIX / Edison International | 0.02 | 3.93 | 1.21 | 6.21 | 1.1609 | 0.0773 | |||
| SWK / Stanley Black & Decker, Inc. | 0.02 | 1.18 | 1.1257 | 1.1257 | |||||
| DD / DuPont de Nemours, Inc. | 0.02 | 45.59 | 1.17 | 18.96 | 1.1155 | 0.1854 | |||
| BLK / BlackRock, Inc. | 0.00 | 1.15 | 1.1005 | 1.1005 | |||||
| HON / Honeywell International Inc. | 0.00 | -40.08 | 1.13 | -36.20 | 1.0785 | -0.5980 | |||
| FANG / Diamondback Energy, Inc. | 0.01 | 3.92 | 1.09 | -12.03 | 1.0425 | -0.1328 | |||
| DHR / Danaher Corporation | 0.01 | 26.95 | 1.09 | 15.99 | 1.0404 | 0.1513 | |||
| IFF / International Flavors & Fragrances Inc. | 0.01 | 3.92 | 1.03 | -2.75 | 0.9826 | -0.0193 | |||
| SYY / Sysco Corporation | 0.01 | 0.00 | 0.92 | -3.37 | 0.8771 | -0.0229 | |||
| IDXX / IDEXX Laboratories, Inc. | 0.00 | 0.00 | 0.82 | 17.55 | 0.7812 | 0.1216 | |||
| NXPI / NXP Semiconductors N.V. | 0.00 | 0.81 | 0.7699 | 0.7699 | |||||
| DAL / Delta Air Lines, Inc. | 0.01 | -41.29 | 0.73 | -55.52 | 0.6938 | -0.7963 | |||
| BDX / Becton, Dickinson and Company | 0.00 | 0.00 | 0.71 | -23.45 | 0.6742 | -0.1995 | |||
| ADBE / Adobe Inc. | 0.00 | -51.05 | 0.68 | -53.70 | 0.6467 | -0.7376 | |||
| TGT / Target Corporation | 0.01 | 0.00 | 0.53 | -24.36 | 0.5084 | -0.1579 | |||
| KNX / Knight-Swift Transportation Holdings Inc. | 0.01 | 0.53 | 0.5084 | 0.5084 | |||||
| PYPL / PayPal Holdings, Inc. | 0.01 | -46.05 | 0.45 | -46.61 | 0.4292 | -0.3684 | |||
| SO / The Southern Company | 0.00 | 0.35 | 0.3363 | 0.3363 | |||||
| CSCO / Cisco Systems, Inc. | 0.00 | -100.00 | 0.00 | -100.00 | 0.9054 | ||||
| OLN / Olin Corporation | 0.00 | -100.00 | 0.00 | -100.00 | 0.7411 | ||||
| PFE / Pfizer Inc. | 0.00 | -100.00 | 0.00 | -100.00 | 1.1123 | ||||
| COF / Capital One Financial Corporation | 0.00 | -100.00 | 0.00 | -100.00 | 1.1596 | ||||
| CHTR / Charter Communications, Inc. | 0.00 | -100.00 | 0.00 | -100.00 | 0.5169 | ||||
| ON / ON Semiconductor Corporation | 0.00 | -100.00 | 0.00 | -100.00 | -0.7136 | ||||
| TEAM / Atlassian Corporation | Short | -0.00 | -0.56 | -0.5358 | -0.5358 | ||||
| STZ / Constellation Brands, Inc. | Short | -0.00 | -0.00 | -0.73 | 1.53 | -0.6987 | -0.0167 | ||
| ORCL / Oracle Corporation | Short | -0.00 | -178.33 | -0.78 | -178.01 | -0.7436 | -1.6881 | ||
| PAYX / Paychex, Inc. | Short | -0.01 | -0.79 | -0.7547 | -0.7547 | ||||
| OVV / Ovintiv Inc. | Short | -0.02 | -0.00 | -0.86 | -17.64 | -0.8217 | 0.1669 | ||
| BIIB / Biogen Inc. | Short | -0.01 | -0.00 | -0.87 | -7.65 | -0.8312 | 0.0611 | ||
| ACN / Accenture plc | Short | -0.00 | -0.00 | -0.91 | -9.03 | -0.8670 | 0.0787 | ||
| HD / The Home Depot, Inc. | Short | -0.00 | -0.00 | -0.92 | -7.16 | -0.8801 | 0.0597 | ||
| WDAY / Workday, Inc. | Short | -0.00 | -0.00 | -0.93 | -5.98 | -0.8879 | 0.0482 | ||
| PPG / PPG Industries, Inc. | Short | -0.01 | -0.00 | -0.95 | -2.16 | -0.9108 | 0.0121 | ||
| TXN / Texas Instruments Incorporated | Short | -0.01 | -0.00 | -0.98 | -6.68 | -0.9351 | 0.0588 | ||
| OXY / Occidental Petroleum Corporation | Short | -0.02 | -0.00 | -0.98 | -16.55 | -0.9355 | 0.1756 | ||
| LULU / lululemon athletica inc. | Short | -0.00 | 34.78 | -0.98 | 16.79 | -0.9383 | -0.1413 | ||
| MTD / Mettler-Toledo International Inc. | Short | -0.00 | -0.00 | -0.98 | -9.16 | -0.9388 | 0.0866 | ||
| RVTY / Revvity, Inc. | Short | -0.01 | -0.00 | -0.98 | -19.44 | -0.9395 | 0.2161 | ||
| BURL / Burlington Stores, Inc. | Short | -0.00 | -0.00 | -1.00 | -8.48 | -0.9600 | 0.0798 | ||
| MTB / M&T Bank Corporation | Short | -0.01 | -1.00 | -0.9602 | -0.9602 | ||||
| TROW / T. Rowe Price Group, Inc. | Short | -0.01 | -0.00 | -1.04 | -11.51 | -0.9930 | 0.1193 | ||
| CBSH / Commerce Bancshares, Inc. | Short | -0.02 | -0.00 | -1.05 | -3.15 | -0.9992 | 0.0237 | ||
| AMD / Advanced Micro Devices, Inc. | Short | -0.01 | -205.56 | -1.05 | -217.04 | -1.0055 | -1.8574 | ||
| PNC / The PNC Financial Services Group, Inc. | Short | -0.01 | -0.00 | -1.08 | -9.42 | -1.0300 | 0.0978 | ||
| EW / Edwards Lifesciences Corporation | Short | -0.01 | -0.00 | -1.10 | 9.28 | -1.0467 | -0.0963 | ||
| JNJ / Johnson & Johnson | Short | -0.01 | -0.00 | -1.10 | -5.98 | -1.0533 | 0.0572 | ||
| AZO / AutoZone, Inc. | Short | -0.00 | -0.00 | -1.12 | 6.88 | -1.0705 | -0.0772 | ||
| ADSK / Autodesk, Inc. | Short | -0.00 | -0.00 | -1.16 | 7.99 | -1.1124 | -0.0909 | ||
| ZBH / Zimmer Biomet Holdings, Inc. | Short | -0.01 | -0.00 | -1.18 | -11.68 | -1.1286 | 0.1381 | ||
| NOV / NOV Inc. | Short | -0.10 | -0.00 | -1.21 | -19.55 | -1.1527 | 0.2685 | ||
| PANW / Palo Alto Networks, Inc. | Short | -0.01 | -0.00 | -1.21 | 1.08 | -1.1587 | -0.0215 | ||
| LII / Lennox International Inc. | Short | -0.00 | 20.00 | -1.22 | 12.77 | -1.1654 | -0.1399 | ||
| MDT / Medtronic plc | Short | -0.01 | -0.00 | -1.23 | -9.77 | -1.1739 | 0.1170 | ||
| NSC / Norfolk Southern Corporation | Short | -0.01 | -0.00 | -1.24 | 0.57 | -1.1810 | -0.0163 | ||
| AMAT / Applied Materials, Inc. | Short | -0.01 | -1.25 | -1.1986 | -1.1986 | ||||
| CMCSA / Comcast Corporation | Short | -0.04 | 46.15 | -1.31 | 40.88 | -1.2557 | -0.3714 | ||
| ITW / Illinois Tool Works Inc. | Short | -0.01 | 31.71 | -1.32 | 22.27 | -1.2650 | -0.2391 | ||
| DIS / The Walt Disney Company | Short | -0.01 | -0.00 | -1.36 | -0.66 | -1.2966 | -0.0022 | ||
| LMT / Lockheed Martin Corporation | Short | -0.00 | -0.00 | -1.40 | 7.04 | -1.3371 | -0.0991 | ||
| ED / Consolidated Edison, Inc. | Short | -0.01 | -0.00 | -1.41 | 2.92 | -1.3483 | -0.0493 | ||
| ROK / Rockwell Automation, Inc. | Short | -0.00 | -0.00 | -1.55 | 9.88 | -1.4779 | -0.1442 | ||
| HLT / Hilton Worldwide Holdings Inc. | Short | -0.01 | 52.38 | -1.59 | 42.99 | -1.5198 | -0.4650 |