Statistik Asas
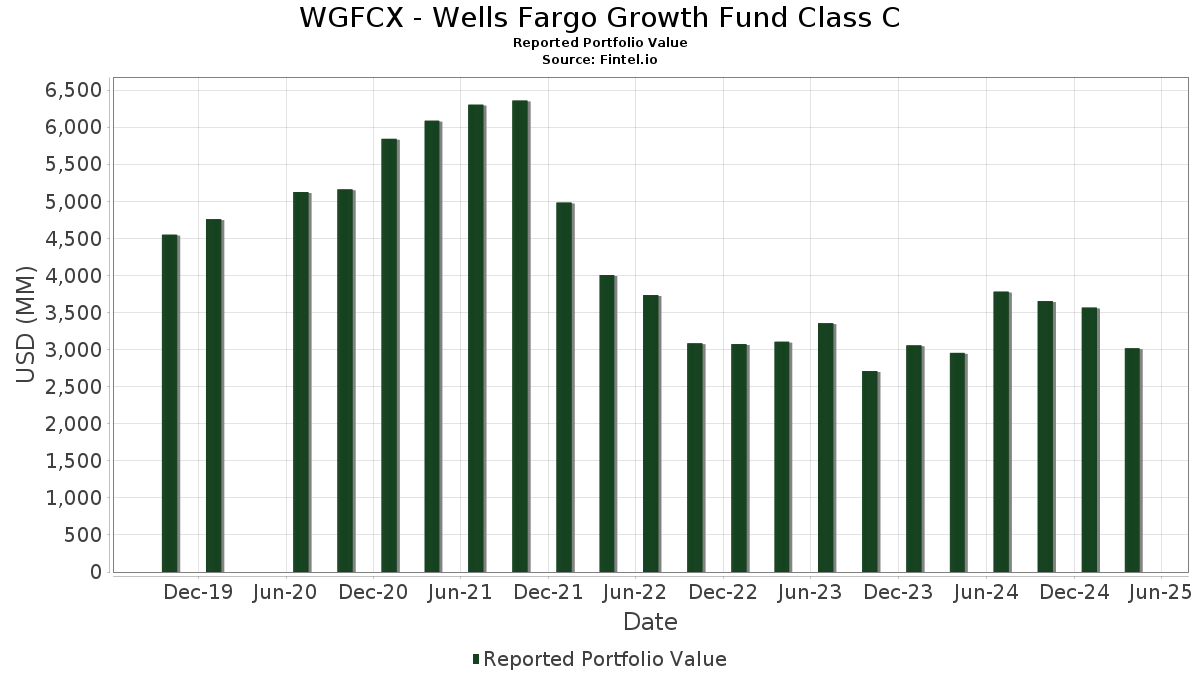
| Nilai Portfolio | $ 3,017,688,208 |
| Kedudukan Semasa | 69 |
Pegangan Terkini, Prestasi, AUM (dari 13F, 13D)
WGFCX - Wells Fargo Growth Fund Class C telah mendedahkan 69 jumlah pegangan dalam pemfailan SEC terkini mereka. Nilai portfolio terkini dikira sebagai $ 3,017,688,208 USD. Aset Sebenar Di Bawah Pengurusan (AUM) ialah nilai ini ditambah dengan tunai (yang tidak didedahkan). Pegangan teratas WGFCX - Wells Fargo Growth Fund Class C ialah Microsoft Corporation (US:MSFT) , NVIDIA Corporation (US:NVDA) , Meta Platforms, Inc. (US:META) , Amazon.com, Inc. (US:AMZN) , and Broadcom Inc. (US:AVGO) . Kedudukan baharu WGFCX - Wells Fargo Growth Fund Class C termasuk Verona Pharma plc - Depositary Receipt (Common Stock) (US:VRNA) , Alnylam Pharmaceuticals, Inc. (US:ALNY) , .
Kenaikan Teratas Suku Tahun Ini
Kami menggunakan perubahan dalam peruntukan portfolio kerana ini adalah metrik yang paling bermakna. Perubahan boleh disebabkan oleh perdagangan atau perubahan dalam harga saham.
| Sekuriti | Saham (MM) |
Nilai (MM$) |
Portfolio % | ΔPortfolio % |
|---|---|---|---|---|
| 0.05 | 60.67 | 2.0117 | 1.4822 | |
| 0.39 | 33.01 | 1.0945 | 1.0945 | |
| 0.15 | 31.32 | 1.0385 | 1.0385 | |
| 0.36 | 26.04 | 0.8636 | 0.8636 | |
| 0.55 | 105.30 | 3.4919 | 0.7693 | |
| 0.08 | 21.32 | 0.7069 | 0.7069 | |
| 0.02 | 44.51 | 1.4758 | 0.6522 | |
| 0.20 | 55.33 | 1.8349 | 0.6276 | |
| 1.24 | 29.62 | 0.9823 | 0.5689 | |
| 0.27 | 20.21 | 0.6703 | 0.5247 |
Penurunan Teratas Suku Tahun Ini
Kami menggunakan perubahan dalam peruntukan portfolio kerana ini adalah metrik yang paling bermakna. Perubahan boleh disebabkan oleh perdagangan atau perubahan dalam harga saham.
| Sekuriti | Saham (MM) |
Nilai (MM$) |
Portfolio % | ΔPortfolio % |
|---|---|---|---|---|
| 0.75 | 137.83 | 4.5705 | -2.2197 | |
| 0.32 | 175.59 | 5.8225 | -1.0401 | |
| 0.18 | 29.86 | 0.9903 | -1.0082 | |
| 0.96 | 47.01 | 1.5588 | -0.8661 | |
| 0.09 | 28.18 | 0.9345 | -0.8340 | |
| 0.06 | 14.87 | 0.4932 | -0.7185 | |
| 0.33 | 52.25 | 1.7325 | -0.6993 | |
| 0.00 | 0.00 | -0.6348 | ||
| 0.29 | 23.60 | 0.7827 | -0.6096 | |
| 0.00 | 0.00 | -0.5219 |
13F dan Pemfailan Dana
Borang ini telah difailkan pada 2025-06-25 untuk tempoh pelaporan 2025-04-30. Klik ikon pautan untuk melihat sejarah transaksi penuh.
Tingkatkan untuk membuka data premium dan eksport ke Excel ![]() .
.
| Sekuriti | Jenis | Purata Harga Saham | Saham (MM) |
ΔSaham (%) |
ΔSaham (%) |
Nilai ($MM) |
Portfolio (%) |
ΔPortfolio (%) |
|
|---|---|---|---|---|---|---|---|---|---|
| MSFT / Microsoft Corporation | 0.51 | -9.25 | 203.21 | -13.58 | 6.7385 | 0.1373 | |||
| NVDA / NVIDIA Corporation | 1.66 | -13.66 | 181.07 | -21.68 | 6.0043 | -0.4860 | |||
| META / Meta Platforms, Inc. | 0.32 | -9.83 | 175.59 | -28.17 | 5.8225 | -1.0401 | |||
| AMZN / Amazon.com, Inc. | 0.75 | -26.56 | 137.83 | -43.02 | 4.5705 | -2.2197 | |||
| AVGO / Broadcom Inc. | 0.55 | 24.83 | 105.30 | 8.58 | 3.4919 | 0.7693 | |||
| AAPL / Apple Inc. | 0.47 | -4.16 | 99.50 | -13.70 | 3.2993 | 0.0627 | |||
| MA / Mastercard Incorporated | 0.14 | 4.16 | 77.13 | 2.78 | 2.5577 | 0.4510 | |||
| NOW / ServiceNow, Inc. | 0.06 | 6.42 | 61.82 | -0.20 | 2.0500 | 0.3110 | |||
| NFLX / Netflix, Inc. | 0.05 | 88.59 | 60.67 | 287.62 | 2.0117 | 1.4822 | |||
| DASH / DoorDash, Inc. | 0.31 | -4.16 | 60.20 | -2.10 | 1.9963 | 0.2701 | |||
| BKNG / Booking Holdings Inc. | 0.01 | -4.15 | 58.21 | 3.17 | 1.9303 | 0.3464 | |||
| TW / Tradeweb Markets Inc. | 0.42 | -11.82 | 58.18 | -3.90 | 1.9293 | 0.2296 | |||
| PGR / The Progressive Corporation | 0.20 | 12.55 | 55.33 | 28.67 | 1.8349 | 0.6276 | |||
| GOOGL / Alphabet Inc. | 0.33 | -22.51 | 52.25 | -39.69 | 1.7325 | -0.6993 | |||
| ORLY / O'Reilly Automotive, Inc. | 0.03 | -4.15 | 48.56 | 4.79 | 1.6101 | 0.3093 | |||
| BSX / Boston Scientific Corporation | 0.47 | -4.16 | 48.06 | -3.68 | 1.5935 | 0.1929 | |||
| HOOD / Robinhood Markets, Inc. | 0.96 | -42.43 | 47.01 | -45.58 | 1.5588 | -0.8661 | |||
| GE / General Electric Company | 0.23 | -4.16 | 45.64 | -5.11 | 1.5134 | 0.1631 | |||
| MELI / MercadoLibre, Inc. | 0.02 | 25.10 | 44.51 | 51.70 | 1.4758 | 0.6522 | |||
| CYBR / CyberArk Software Ltd. | 0.12 | 15.11 | 43.53 | 9.27 | 1.4434 | 0.3251 | |||
| TKO / TKO Group Holdings, Inc. | 0.26 | -4.16 | 42.61 | 0.60 | 1.4130 | 0.2239 | |||
| SPOT / Spotify Technology S.A. | 0.07 | -4.16 | 42.50 | 7.28 | 1.4093 | 0.2971 | |||
| WCN / Waste Connections, Inc. | 0.21 | -4.16 | 41.47 | 3.07 | 1.3751 | 0.2457 | |||
| MSI / Motorola Solutions, Inc. | 0.09 | -4.16 | 40.83 | -10.05 | 1.3540 | 0.0796 | |||
| ISRG / Intuitive Surgical, Inc. | 0.08 | -4.16 | 40.64 | -13.56 | 1.3477 | 0.0278 | |||
| V / Visa Inc. | 0.11 | -4.16 | 38.39 | -3.12 | 1.2729 | 0.1606 | |||
| ORCL / Oracle Corporation | 0.27 | -4.16 | 38.27 | -20.69 | 1.2691 | -0.0856 | |||
| KKR / KKR & Co. Inc. | 0.33 | 8.27 | 38.25 | -25.94 | 1.2683 | -0.1816 | |||
| VMC / Vulcan Materials Company | 0.14 | -4.16 | 37.49 | -8.29 | 1.2433 | 0.0956 | |||
| TEVA / Teva Pharmaceutical Industries Limited - Depositary Receipt (Common Stock) | 2.37 | 39.62 | 36.80 | 22.14 | 1.2204 | 0.3745 | |||
| CW / Curtiss-Wright Corporation | 0.10 | 25.13 | 33.63 | 24.39 | 1.1151 | 0.3562 | |||
| RBLX / Roblox Corporation | 0.50 | 19.72 | 33.36 | 12.94 | 1.1061 | 0.2770 | |||
| JCI / Johnson Controls International plc | 0.39 | 33.01 | 1.0945 | 1.0945 | |||||
| ARGX / argenx SE - Depositary Receipt (Common Stock) | 0.05 | 15.19 | 32.03 | 13.43 | 1.0621 | 0.2694 | |||
| FICO / Fair Isaac Corporation | 0.02 | -4.15 | 31.84 | 1.79 | 1.0559 | 0.1777 | |||
| PEN / Penumbra, Inc. | 0.11 | 11.61 | 31.54 | 22.43 | 1.0457 | 0.3226 | |||
| RCL / Royal Caribbean Cruises Ltd. | 0.15 | 31.32 | 1.0385 | 1.0385 | |||||
| EME / EMCOR Group, Inc. | 0.08 | 23.30 | 30.18 | 10.27 | 1.0009 | 0.2325 | |||
| MPWR / Monolithic Power Systems, Inc. | 0.05 | 14.14 | 30.05 | 6.21 | 0.9964 | 0.2022 | |||
| TSM / Taiwan Semiconductor Manufacturing Company Limited - Depositary Receipt (Common Stock) | 0.18 | -47.32 | 29.86 | -58.05 | 0.9903 | -1.0082 | |||
| EQH / Equitable Holdings, Inc. | 0.60 | 50.71 | 29.72 | 36.95 | 0.9855 | 0.3763 | |||
| ADMA / ADMA Biologics, Inc. | 1.24 | 36.51 | 29.62 | 101.17 | 0.9823 | 0.5689 | |||
| RDNT / RadNet, Inc. | 0.55 | 46.57 | 28.77 | 17.26 | 0.9539 | 0.2652 | |||
| CDNS / Cadence Design Systems, Inc. | 0.09 | -55.28 | 28.18 | -55.27 | 0.9345 | -0.8340 | |||
| CRS / Carpenter Technology Corporation | 0.14 | -4.16 | 26.84 | -2.89 | 0.8901 | 0.1141 | |||
| CVLT / Commvault Systems, Inc. | 0.16 | -4.16 | 26.37 | 0.58 | 0.8745 | 0.1384 | |||
| VRNA / Verona Pharma plc - Depositary Receipt (Common Stock) | 0.36 | 26.04 | 0.8636 | 0.8636 | |||||
| MNDY / monday.com Ltd. | 0.09 | -24.76 | 25.77 | -17.24 | 0.8544 | -0.0197 | |||
| SHOP / Shopify Inc. | 0.27 | -4.16 | 25.74 | -22.04 | 0.8535 | -0.0734 | |||
| LYV / Live Nation Entertainment, Inc. | 0.19 | -4.16 | 25.46 | -12.26 | 0.8441 | 0.0297 | |||
| NTRA / Natera, Inc. | 0.16 | -4.16 | 24.85 | -18.24 | 0.8240 | -0.0292 | |||
| TOST / Toast, Inc. | 0.68 | -4.16 | 24.03 | -16.66 | 0.7967 | -0.0126 | |||
| ANET / Arista Networks Inc | 0.29 | -33.34 | 23.60 | -52.41 | 0.7827 | -0.6096 | |||
| NET / Cloudflare, Inc. | 0.19 | -46.36 | 23.53 | -66.73 | 0.7803 | -0.3415 | |||
| APP / AppLovin Corporation | 0.09 | -17.16 | 23.32 | -39.64 | 0.7731 | -0.3112 | |||
| PCOR / Procore Technologies, Inc. | 0.36 | 18.16 | 22.84 | 10.68 | 0.7573 | 0.0592 | |||
| LPLA / LPL Financial Holdings Inc. | 0.07 | -64.21 | 22.05 | -48.34 | 0.7312 | -0.4029 | |||
| PWR / Quanta Services, Inc. | 0.07 | -4.16 | 21.77 | -8.80 | 0.7217 | 0.0517 | |||
| ALNY / Alnylam Pharmaceuticals, Inc. | 0.08 | 21.32 | 0.7069 | 0.7069 | |||||
| CSGP / CoStar Group, Inc. | 0.27 | 404.99 | 20.21 | 410.30 | 0.6703 | 0.5247 | |||
| RGEN / Repligen Corporation | 0.14 | -4.16 | 19.21 | -20.43 | 0.6371 | -0.0407 | |||
| DKNG / DraftKings Inc. | 0.57 | -4.16 | 18.94 | -23.94 | 0.6281 | -0.0710 | |||
| SAIA / Saia, Inc. | 0.07 | -4.16 | 16.98 | -51.29 | 0.5632 | -0.4156 | |||
| IOT / Samsara Inc. | 0.40 | -4.16 | 15.70 | -26.19 | 0.5207 | -0.0765 | |||
| BRBR / BellRing Brands, Inc. | 0.20 | -4.16 | 15.45 | -4.42 | 0.5124 | 0.0586 | |||
| ALLSPRING GOVERNMENT MONEY MAR / STIV (000000000) | 15.35 | 15.35 | 0.5089 | 0.5089 | |||||
| ZBRA / Zebra Technologies Corporation | 0.06 | -46.05 | 14.87 | -65.54 | 0.4932 | -0.7185 | |||
| CH1134540470 / On Holding AG | 0.27 | -52.08 | 13.11 | -61.50 | 0.4346 | -0.5210 | |||
| DECK / Deckers Outdoor Corporation | 0.09 | -37.48 | 10.36 | -60.93 | 0.3435 | -0.4008 | |||
| PCVX / Vaxcyte, Inc. | 0.00 | -100.00 | 0.00 | -100.00 | -0.5219 | ||||
| FRPT / Freshpet, Inc. | 0.00 | -100.00 | 0.00 | -100.00 | -0.6348 |