Statistik Asas
| Profil Orang Dalam | CARLSON CAPITAL L P |
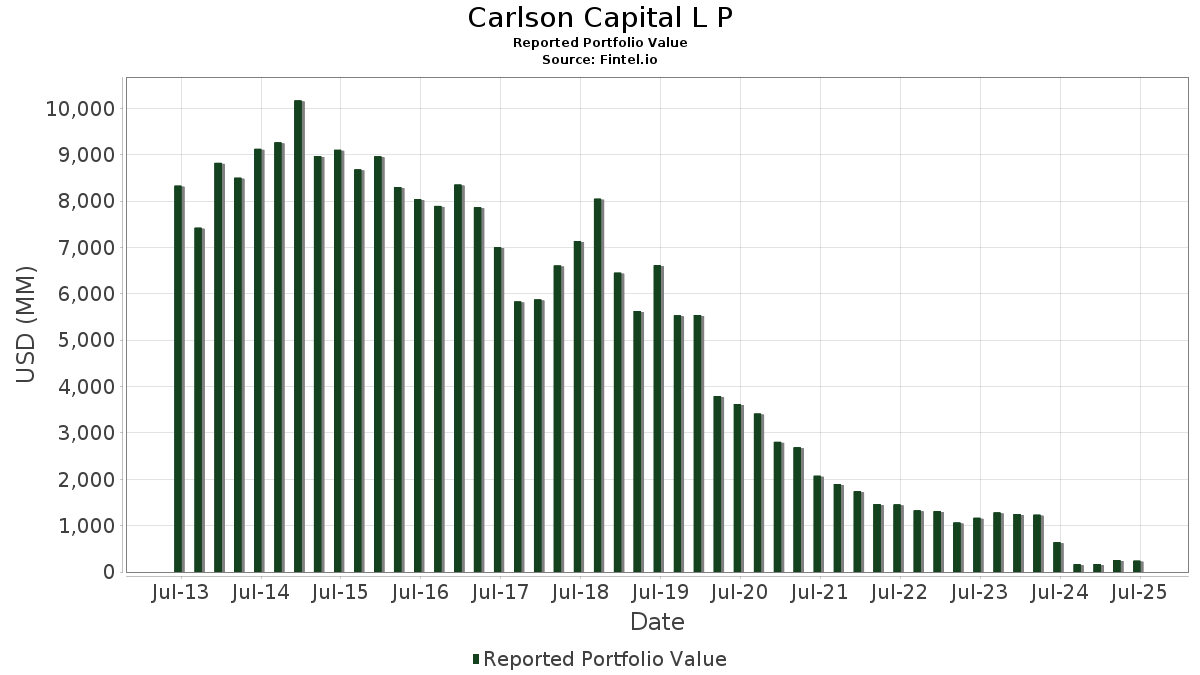
| Nilai Portfolio | $ 242,111,554 |
| Kedudukan Semasa | 65 |
Pegangan Terkini, Prestasi, AUM (dari 13F, 13D)
Carlson Capital L P telah mendedahkan 65 jumlah pegangan dalam pemfailan SEC terkini mereka. Nilai portfolio terkini dikira sebagai $ 242,111,554 USD. Aset Sebenar Di Bawah Pengurusan (AUM) ialah nilai ini ditambah dengan tunai (yang tidak didedahkan). Pegangan teratas Carlson Capital L P ialah SWK Holdings Corporation (US:SWKH) , iShares Trust - iShares iBoxx $ High Yield Corporate Bond ETF (US:HYG) , NVIDIA Corporation (US:NVDA) , Kellanova (US:K) , and Hess Corporation (US:HES) . Kedudukan baharu Carlson Capital L P termasuk Redfin Corporation (US:RDFN) , Frontier Communications Parent, Inc. (US:FYBR) , iShares Trust - iShares Russell 2000 ETF (US:IWM) , Dun & Bradstreet Holdings, Inc. (US:DNB) , and El Pollo Loco Holdings, Inc. (US:LOCO) . Industri teratas Carlson Capital L P ialah "Lumber And Wood Products, Except Furniture" (sic 24) , "Stone, Clay, Glass, And Concrete Products" (sic 32) , and "Fabricated Metal Products, Except Machinery And Transportation Equipment" (sic 34) .
Kenaikan Teratas Suku Tahun Ini
Kami menggunakan perubahan dalam peruntukan portfolio kerana ini adalah metrik yang paling bermakna. Perubahan boleh disebabkan oleh perdagangan atau perubahan dalam harga saham.
| Sekuriti | Saham (MM) |
Nilai (MM$) |
Portfolio % | ΔPortfolio % |
|---|---|---|---|---|
| 0.03 | 4.74 | 1.9577 | 1.9577 | |
| 0.02 | 2.42 | 0.9984 | 0.9984 | |
| 0.21 | 2.35 | 0.9706 | 0.9706 | |
| 0.01 | 2.15 | 0.8875 | 0.8875 | |
| 0.04 | 2.01 | 0.8306 | 0.8306 | |
| 0.04 | 2.77 | 1.1423 | 0.6131 | |
| 0.05 | 3.82 | 1.5767 | 0.5753 | |
| 0.01 | 1.53 | 0.6301 | 0.4898 | |
| 0.02 | 1.46 | 0.6044 | 0.4450 | |
| 0.01 | 0.92 | 0.3782 | 0.3782 |
Penurunan Teratas Suku Tahun Ini
Kami menggunakan perubahan dalam peruntukan portfolio kerana ini adalah metrik yang paling bermakna. Perubahan boleh disebabkan oleh perdagangan atau perubahan dalam harga saham.
| Sekuriti | Saham (MM) |
Nilai (MM$) |
Portfolio % | ΔPortfolio % |
|---|---|---|---|---|
| 8.49 | 125.19 | 51.7068 | -5.9465 | |
| 0.65 | 52.42 | 21.6522 | -5.1395 | |
| 0.00 | 0.00 | -0.4654 | ||
| 0.00 | 0.00 | -0.4199 | ||
| 0.00 | 0.00 | -0.3787 | ||
| 0.00 | 0.00 | -0.3722 | ||
| 0.00 | 0.00 | -0.2459 | ||
| 0.00 | 0.00 | -0.2276 | ||
| 0.00 | 0.47 | 0.1933 | -0.1737 | |
| 0.01 | 2.54 | 1.0496 | -0.1643 |
Pemfailan 13D/G
Ini ialah senarai pemfailan 13D dan 13G yang dibuat pada tahun lepas (jika ada). Klik ikon pautan untuk melihat sejarah transaksi penuh. Baris hijau menunjukkan kedudukan baharu. Baris merah menunjukkan kedudukan tertutup.
| Tarikh Fail | Borang | Sekuriti | Saham Terdahulu |
Saham Semasa |
ΔSaham % | % Pemilikan |
% ΔPemilikan | |
|---|---|---|---|---|---|---|---|---|
| 2024-11-19 | TFFP / TFF Pharmaceuticals, Inc. | 217,960 | 124,000 | -43.11 | 3.45 | -62.17 | ||
| 2024-11-06 | MAGN / Magnera Corporation | 284,750 | 0.81 | |||||
| 2024-10-25 | SWKH / SWK Holdings Corporation | 9,093,766 | 8,907,528 | -2.05 | 72.00 | 1.41 | ||
| 2024-09-30 | GLT / Glatfelter Corporation | 4,705,691 | 3,983,288 | -15.35 | 8.80 | -15.38 |
13F dan Pemfailan Dana
Borang ini telah difailkan pada 2025-08-13 untuk tempoh pelaporan 2025-06-30. Klik ikon pautan untuk melihat sejarah transaksi penuh.
Tingkatkan untuk membuka data premium dan eksport ke Excel ![]() .
.
| Sekuriti | Jenis | Purata Harga Saham | Saham (MM) |
ΔSaham (%) |
ΔSaham (%) |
Nilai ($MM) |
Portfolio (%) |
ΔPortfolio (%) |
|
|---|---|---|---|---|---|---|---|---|---|
| SWKH / SWK Holdings Corporation | 8.49 | 0.00 | 125.19 | -15.24 | 51.7068 | -5.9465 | |||
| HYG / iShares Trust - iShares iBoxx $ High Yield Corporate Bond ETF | Put | 0.65 | -25.29 | 52.42 | -23.62 | 21.6522 | -5.1395 | ||
| NVDA / NVIDIA Corporation | Put | 0.03 | 4.74 | 1.9577 | 1.9577 | ||||
| K / Kellanova | 0.05 | 54.34 | 3.82 | 48.81 | 1.5767 | 0.5753 | |||
| HES / Hess Corporation | 0.02 | 0.00 | 3.05 | -13.29 | 1.2589 | -0.1129 | |||
| AFRM / Affirm Holdings, Inc. | Put | 0.04 | 33.33 | 2.77 | 104.06 | 1.1423 | 0.6131 | ||
| SOFI / SoFi Technologies, Inc. | Put | 0.15 | -40.00 | 2.73 | -6.05 | 1.1282 | -0.0068 | ||
| TSLA / Tesla, Inc. | Put | 0.01 | -33.33 | 2.54 | -18.27 | 1.0496 | -0.1643 | ||
| COOP / Mr. Cooper Group Inc. | 0.02 | 2.42 | 0.9984 | 0.9984 | |||||
| RDFN / Redfin Corporation | 0.21 | 2.35 | 0.9706 | 0.9706 | |||||
| NVDA / NVIDIA Corporation | 0.01 | 2.15 | 0.8875 | 0.8875 | |||||
| AZEK / The AZEK Company Inc. | 0.04 | 2.01 | 0.8306 | 0.8306 | |||||
| GOOG / Alphabet Inc. | 0.01 | 273.91 | 1.53 | 324.79 | 0.6301 | 0.4898 | |||
| FITB / Fifth Third Bancorp | 0.04 | 87.50 | 1.48 | 96.81 | 0.6116 | 0.3178 | |||
| SSB / SouthState Corporation | 0.02 | 261.36 | 1.46 | 258.58 | 0.6044 | 0.4450 | |||
| CCRN / Cross Country Healthcare, Inc. | 0.10 | 42.86 | 1.30 | 25.24 | 0.5390 | 0.1321 | |||
| SNV / Synovus Financial Corp. | 0.02 | 100.88 | 1.19 | 122.74 | 0.4895 | 0.2815 | |||
| FANG / Diamondback Energy, Inc. | 0.01 | 94.44 | 0.96 | 67.13 | 0.3973 | 0.1726 | |||
| MS / Morgan Stanley | 0.01 | 0.92 | 0.3782 | 0.3782 | |||||
| TFC / Truist Financial Corporation | 0.02 | 0.91 | 0.3764 | 0.3764 | |||||
| PEP / PepsiCo, Inc. | 0.01 | 0.88 | 0.3654 | 0.3654 | |||||
| ANSS / ANSYS, Inc. | 0.00 | -19.35 | 0.88 | -10.50 | 0.3627 | -0.0204 | |||
| FYBR / Frontier Communications Parent, Inc. | 0.02 | 0.87 | 0.3608 | 0.3608 | |||||
| IWM / iShares Trust - iShares Russell 2000 ETF | 0.00 | 0.86 | 0.3565 | 0.3565 | |||||
| PSX / Phillips 66 | 0.01 | 0.84 | 0.3449 | 0.3449 | |||||
| PNC / The PNC Financial Services Group, Inc. | 0.00 | -37.14 | 0.82 | -33.33 | 0.3388 | -0.1415 | |||
| TLT / iShares Trust - iShares 20+ Year Treasury Bond ETF | 0.01 | 0.81 | 0.3353 | 0.3353 | |||||
| ACI / Albertsons Companies, Inc. | 0.04 | 35.27 | 0.80 | 32.45 | 0.3305 | 0.0944 | |||
| LOW / Lowe's Companies, Inc. | 0.00 | 140.00 | 0.80 | 128.65 | 0.3299 | 0.1933 | |||
| MTDR / Matador Resources Company | 0.02 | 0.78 | 0.3232 | 0.3232 | |||||
| BOKF / BOK Financial Corporation | 0.01 | 41.07 | 0.77 | 32.25 | 0.3186 | 0.0909 | |||
| MSFT / Microsoft Corporation | 0.00 | 0.75 | 0.3082 | 0.3082 | |||||
| WMT / Walmart Inc. | 0.01 | 0.73 | 0.3029 | 0.3029 | |||||
| BRSL / Brightstar Lottery PLC | 0.04 | 0.71 | 0.2939 | 0.2939 | |||||
| DNB / Dun & Bradstreet Holdings, Inc. | 0.07 | 0.68 | 0.2816 | 0.2816 | |||||
| CYTK / Cytokinetics, Incorporated | 0.02 | 173.33 | 0.68 | 124.92 | 0.2798 | 0.1621 | |||
| QS / QuantumScape Corporation | Put | 0.10 | 0.67 | 0.2776 | 0.2776 | ||||
| LOCO / El Pollo Loco Holdings, Inc. | 0.06 | 0.67 | 0.2774 | 0.2774 | |||||
| GPN / Global Payments Inc. | 0.01 | 62.00 | 0.65 | 32.52 | 0.2678 | 0.0767 | |||
| SFNC / Simmons First National Corporation | 0.03 | 0.62 | 0.2576 | 0.2576 | |||||
| FI / Fiserv, Inc. | 0.00 | 0.62 | 0.2564 | 0.2564 | |||||
| DECK / Deckers Outdoor Corporation | 0.01 | 136.00 | 0.61 | 117.92 | 0.2512 | 0.1421 | |||
| ROST / Ross Stores, Inc. | 0.00 | 0.60 | 0.2477 | 0.2477 | |||||
| ONB / Old National Bancorp | 0.03 | 0.59 | 0.2450 | 0.2450 | |||||
| BJ / BJ's Wholesale Club Holdings, Inc. | 0.01 | 0.59 | 0.2450 | 0.2450 | |||||
| ORLY / O'Reilly Automotive, Inc. | 0.01 | 0.58 | 0.2383 | 0.2383 | |||||
| OII / Oceaneering International, Inc. | 0.03 | 0.57 | 0.2371 | 0.2371 | |||||
| ZION / Zions Bancorporation, National Association | 0.01 | 0.56 | 0.2317 | 0.2317 | |||||
| CAG / Conagra Brands, Inc. | 0.03 | 0.54 | 0.2232 | 0.2232 | |||||
| KRE / SPDR Series Trust - SPDR S&P Regional Banking ETF | 0.01 | 0.53 | 0.2183 | 0.2183 | |||||
| CNI / Canadian National Railway Company | 0.00 | 0.51 | 0.2106 | 0.2106 | |||||
| FND / Floor & Decor Holdings, Inc. | 0.01 | 0.51 | 0.2102 | 0.2102 | |||||
| OMC / Omnicom Group Inc. | 0.01 | 0.49 | 0.2044 | 0.2044 | |||||
| STT / State Street Corporation | 0.00 | -58.10 | 0.47 | -50.32 | 0.1933 | -0.1737 | |||
| CLX / The Clorox Company | 0.00 | 0.44 | 0.1835 | 0.1835 | |||||
| TXN / Texas Instruments Incorporated | 0.00 | 0.44 | 0.1801 | 0.1801 | |||||
| AR / Antero Resources Corporation | 0.01 | 0.42 | 0.1730 | 0.1730 | |||||
| SKX / Skechers U.S.A., Inc. | 0.01 | 0.38 | 0.1564 | 0.1564 | |||||
| CVAC / CureVac N.V. | 0.06 | 0.30 | 0.1234 | 0.1234 | |||||
| LWAY / Lifeway Foods, Inc. | 0.01 | 0.25 | 0.1018 | 0.1018 | |||||
| SNPS / Synopsys, Inc. | 0.00 | 0.25 | 0.1016 | 0.1016 | |||||
| KNF / Knife River Corporation | 0.00 | 0.24 | 0.1012 | 0.1012 | |||||
| ENVX / Enovix Corporation | Put | 0.02 | 0.21 | 0.0854 | 0.0854 | ||||
| SLDP / Solid Power, Inc. | Put | 0.05 | 0.11 | 0.0452 | 0.0452 | ||||
| ALMS / Alumis Inc. | 0.03 | 0.09 | 0.0372 | 0.0372 | |||||
| DLTR / Dollar Tree, Inc. | 0.00 | -100.00 | 0.00 | 0.0000 | |||||
| COP / ConocoPhillips | 0.00 | -100.00 | 0.00 | 0.0000 | |||||
| XOM / Exxon Mobil Corporation | 0.00 | -100.00 | 0.00 | 0.0000 | |||||
| USB / U.S. Bancorp | 0.00 | -100.00 | 0.00 | 0.0000 | |||||
| DFS / Discover Financial Services | 0.00 | -100.00 | 0.00 | 0.0000 | |||||
| HAL / Halliburton Company | 0.00 | -100.00 | 0.00 | -100.00 | -0.4199 | ||||
| MAGN / Magnera Corporation | 0.00 | -100.00 | 0.00 | -100.00 | -0.2276 | ||||
| CARR / Carrier Global Corporation | 0.00 | -100.00 | 0.00 | -100.00 | -0.1485 | ||||
| CKPT / Checkpoint Therapeutics, Inc. | 0.00 | -100.00 | 0.00 | -100.00 | -0.0946 | ||||
| CMRX / Chimerix, Inc. | 0.00 | -100.00 | 0.00 | -100.00 | -0.3787 | ||||
| CHX / ChampionX Corporation | 0.00 | -100.00 | 0.00 | -100.00 | -0.3722 | ||||
| FAF / First American Financial Corporation | 0.00 | -100.00 | 0.00 | -100.00 | -0.2459 | ||||
| NVDA / NVIDIA Corporation | Call | 0.00 | -100.00 | 0.00 | -100.00 | -0.4654 | |||
| NTRS / Northern Trust Corporation | 0.00 | -100.00 | 0.00 | -100.00 | -0.1579 | ||||
| ITCI / Intra-Cellular Therapies, Inc. | 0.00 | -100.00 | 0.00 | 0.0000 | |||||
| AMTM / Amentum Holdings, Inc. | 0.00 | -100.00 | 0.00 | 0.0000 | |||||
| BAC / Bank of America Corporation | 0.00 | -100.00 | 0.00 | 0.0000 | |||||
| CSX / CSX Corporation | 0.00 | -100.00 | 0.00 | 0.0000 |