Statistik Asas
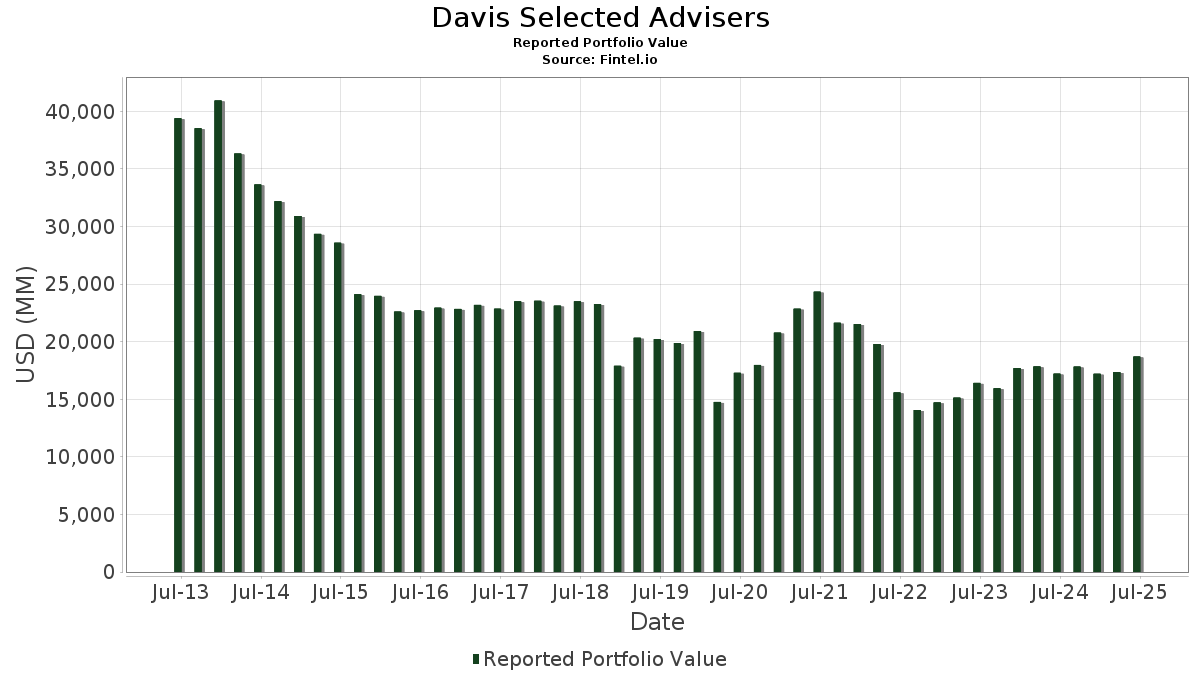
| Nilai Portfolio | $ 18,702,346,980 |
| Kedudukan Semasa | 107 |
Pegangan Terkini, Prestasi, AUM (dari 13F, 13D)
Davis Selected Advisers telah mendedahkan 107 jumlah pegangan dalam pemfailan SEC terkini mereka. Nilai portfolio terkini dikira sebagai $ 18,702,346,980 USD. Aset Sebenar Di Bawah Pengurusan (AUM) ialah nilai ini ditambah dengan tunai (yang tidak didedahkan). Pegangan teratas Davis Selected Advisers ialah Capital One Financial Corporation (US:COF) , Meta Platforms, Inc. (US:META) , Applied Materials, Inc. (US:AMAT) , U.S. Bancorp (US:USB) , and MGM Resorts International (US:MGM) . Kedudukan baharu Davis Selected Advisers termasuk Direxion Shares ETF Trust - Direxion Daily NVDA Bear 1X Shares (US:NVDD) , Realty Income Corporation (US:O) , Taiwan Semiconductor Manufacturing Company Limited - Depositary Receipt (Common Stock) (US:TSM) , . Industri teratas Davis Selected Advisers ialah "Wholesale Trade-durable Goods" (sic 50) , "Electric, Gas, And Sanitary Services " (sic 49) , and "Health Services" (sic 80) .
Kenaikan Teratas Suku Tahun Ini
Kami menggunakan perubahan dalam peruntukan portfolio kerana ini adalah metrik yang paling bermakna. Perubahan boleh disebabkan oleh perdagangan atau perubahan dalam harga saham.
| Sekuriti | Saham (MM) |
Nilai (MM$) |
Portfolio % | ΔPortfolio % |
|---|---|---|---|---|
| 1.13 | 353.43 | 1.8897 | 1.7433 | |
| 9.34 | 237.00 | 1.2672 | 1.2672 | |
| 19.33 | 874.76 | 4.6773 | 1.0541 | |
| 2.11 | 1,555.76 | 8.3185 | 0.9760 | |
| 8.96 | 501.02 | 2.6789 | 0.9578 | |
| 8.96 | 1,905.42 | 10.1882 | 0.8877 | |
| 23.82 | 819.21 | 4.3802 | 0.8242 | |
| 4.96 | 907.59 | 4.8528 | 0.6763 | |
| 5.75 | 172.42 | 0.9219 | 0.1786 | |
| 11.64 | 137.42 | 0.7348 | 0.1592 |
Penurunan Teratas Suku Tahun Ini
Kami menggunakan perubahan dalam peruntukan portfolio kerana ini adalah metrik yang paling bermakna. Perubahan boleh disebabkan oleh perdagangan atau perubahan dalam harga saham.
| Sekuriti | Saham (MM) |
Nilai (MM$) |
Portfolio % | ΔPortfolio % |
|---|---|---|---|---|
| 0.00 | 776.17 | 4.1501 | -3.0199 | |
| 0.66 | 216.82 | 1.1593 | -1.5585 | |
| 1.65 | 404.06 | 2.1605 | -1.3951 | |
| 1.35 | 243.29 | 1.3009 | -1.0283 | |
| 0.55 | 269.04 | 1.4385 | -0.6441 | |
| 2.28 | 85.16 | 0.4554 | -0.2484 | |
| 11.59 | 799.26 | 4.2736 | -0.2363 | |
| 1.07 | 310.53 | 1.6604 | -0.2306 | |
| 4.95 | 290.24 | 1.5519 | -0.2302 | |
| 1.77 | 243.29 | 1.3008 | -0.1704 |
Pemfailan 13D/G
Ini ialah senarai pemfailan 13D dan 13G yang dibuat pada tahun lepas (jika ada). Klik ikon pautan untuk melihat sejarah transaksi penuh. Baris hijau menunjukkan kedudukan baharu. Baris merah menunjukkan kedudukan tertutup.
| Tarikh Fail | Borang | Sekuriti | Saham Terdahulu |
Saham Semasa |
ΔSaham % | % Pemilikan |
% ΔPemilikan | |
|---|---|---|---|---|---|---|---|---|
| 2025-08-07 | MGM / MGM Resorts International | 20,815,057 | 23,821,109 | 14.44 | 9.50 | 17.28 | ||
| 2025-08-07 | VTRS / Viatris Inc. | 64,948,236 | 66,375,520 | 2.20 | 6.20 | 3.33 | ||
| 2024-11-12 | HOLI / Hollysys Automation Technologies Ltd. | 5,248,240 | 0 | -100.00 | 0.00 | -100.00 |
13F dan Pemfailan Dana
Borang ini telah difailkan pada 2025-08-08 untuk tempoh pelaporan 2025-06-30. Klik ikon pautan untuk melihat sejarah transaksi penuh.
Tingkatkan untuk membuka data premium dan eksport ke Excel ![]() .
.
| Sekuriti | Jenis | Purata Harga Saham | Saham (MM) |
ΔSaham (%) |
ΔSaham (%) |
Nilai ($MM) |
Portfolio (%) |
ΔPortfolio (%) |
|
|---|---|---|---|---|---|---|---|---|---|
| COF / Capital One Financial Corporation | 8.96 | -0.49 | 1,905.42 | 18.09 | 10.1882 | 0.8877 | |||
| META / Meta Platforms, Inc. | 2.11 | -4.63 | 1,555.76 | 22.13 | 8.3185 | 0.9760 | |||
| AMAT / Applied Materials, Inc. | 4.96 | -0.71 | 907.59 | 25.25 | 4.8528 | 0.6763 | |||
| USB / U.S. Bancorp | 19.33 | 29.84 | 874.76 | 39.16 | 4.6773 | 1.0541 | |||
| MGM / MGM Resorts International | 23.82 | 14.44 | 819.21 | 32.78 | 4.3802 | 0.8242 | |||
| CVS / CVS Health Corporation | 11.59 | 0.33 | 799.26 | 2.15 | 4.2736 | -0.2363 | |||
| BRK.A / Berkshire Hathaway Inc. | 0.00 | -31.64 | 776.17 | -37.61 | 4.1501 | -3.0199 | |||
| MKL / Markel Group Inc. | 0.37 | -0.09 | 741.28 | 6.74 | 3.9636 | -0.0394 | |||
| AMZN / Amazon.com, Inc. | 3.27 | -7.12 | 717.22 | 7.09 | 3.8349 | -0.0251 | |||
| WFC / Wells Fargo & Company | 8.18 | -3.45 | 655.10 | 7.75 | 3.5027 | -0.0014 | |||
| VTRS / Viatris Inc. | 66.38 | 2.20 | 592.73 | 4.78 | 3.1693 | -0.0913 | |||
| GOOGL / Alphabet Inc. | 2.85 | -6.09 | 503.03 | 7.02 | 2.6897 | -0.0195 | |||
| TSN / Tyson Foods, Inc. | 8.96 | 91.39 | 501.02 | 67.79 | 2.6789 | 0.9578 | |||
| TXN / Texas Instruments Incorporated | 2.38 | -2.09 | 494.18 | 13.12 | 2.6423 | 0.1244 | |||
| TECK / Teck Resources Limited | 11.03 | -1.39 | 445.59 | 9.30 | 2.3826 | 0.0328 | |||
| SOLV / Solventum Corporation | 5.49 | 3.87 | 416.56 | 3.59 | 2.2273 | -0.0903 | |||
| HUM / Humana Inc. | 1.65 | -29.11 | 404.06 | -34.50 | 2.1605 | -1.3951 | |||
| UNH / UnitedHealth Group Incorporated | 1.13 | 2,234.93 | 353.43 | 1,290.84 | 1.8897 | 1.7433 | |||
| CB / Chubb Limited | 1.07 | -1.34 | 310.53 | -5.35 | 1.6604 | -0.2306 | |||
| TCOM / Trip.com Group Limited - Depositary Receipt (Common Stock) | 4.95 | 1.78 | 290.24 | -6.13 | 1.5519 | -0.2302 | |||
| BRK.B / Berkshire Hathaway Inc. | 0.55 | -18.37 | 269.04 | -25.54 | 1.4385 | -0.6441 | |||
| DGX / Quest Diagnostics Incorporated | 1.35 | -43.29 | 243.29 | -39.79 | 1.3009 | -1.0283 | |||
| OC / Owens Corning | 1.77 | -1.02 | 243.29 | -4.69 | 1.3008 | -0.1704 | |||
| CTRA / Coterra Energy Inc. | 9.34 | 237.00 | 1.2672 | 1.2672 | |||||
| QSR / Restaurant Brands International Inc. | 3.42 | 1.40 | 226.69 | 0.87 | 1.2121 | -0.0833 | |||
| CI / The Cigna Group | 0.66 | -54.24 | 216.82 | -54.02 | 1.1593 | -1.5585 | |||
| AGCO / AGCO Corporation | 1.80 | -10.99 | 186.16 | -0.80 | 0.9954 | -0.0863 | |||
| JPM / JPMorgan Chase & Co. | 0.64 | -0.60 | 184.39 | 17.48 | 0.9859 | 0.0813 | |||
| BK / The Bank of New York Mellon Corporation | 1.90 | -0.64 | 172.97 | 7.94 | 0.9248 | 0.0012 | |||
| CPNG / Coupang, Inc. | 5.75 | -2.14 | 172.42 | 33.69 | 0.9219 | 0.1786 | |||
| DUSA / Davis Fundamental ETF Trust - Davis Select U.S. Equity ETF | 3.38 | 0.00 | 156.58 | 9.36 | 0.8372 | 0.0119 | |||
| COP / ConocoPhillips | 1.59 | 13.09 | 142.29 | -3.37 | 0.7608 | -0.0879 | |||
| YMM / Full Truck Alliance Co. Ltd. - Depositary Receipt (Common Stock) | 11.64 | 48.81 | 137.42 | 37.62 | 0.7348 | 0.1592 | |||
| MSFT / Microsoft Corporation | 0.25 | -3.34 | 123.34 | 28.08 | 0.6595 | 0.1044 | |||
| GOOG / Alphabet Inc. | 0.65 | 0.57 | 115.37 | 14.19 | 0.6169 | 0.0346 | |||
| FITB / Fifth Third Bancorp | 2.51 | 2.10 | 103.35 | 7.13 | 0.5526 | -0.0034 | |||
| DINT / Davis Fundamental ETF Trust - Davis Select International ETF | 3.89 | 0.00 | 100.60 | 11.90 | 0.5379 | 0.0197 | |||
| PNC / The PNC Financial Services Group, Inc. | 0.50 | 1.32 | 93.65 | 7.46 | 0.5007 | -0.0016 | |||
| DAR / Darling Ingredients Inc. | 2.44 | -1.33 | 92.71 | 19.83 | 0.4957 | 0.0498 | |||
| DFNL / Davis Fundamental ETF Trust - Davis Select Financial ETF | 2.13 | 0.00 | 91.46 | 9.32 | 0.4890 | 0.0068 | |||
| AXP / American Express Company | 0.27 | -0.34 | 86.28 | 18.15 | 0.4614 | 0.0404 | |||
| IAC / IAC Inc. | 2.28 | -14.19 | 85.16 | -30.25 | 0.4554 | -0.2484 | |||
| NTES / NetEase, Inc. - Depositary Receipt (Common Stock) | 0.59 | -0.46 | 79.85 | 30.15 | 0.4270 | 0.0733 | |||
| DWLD / Davis Fundamental ETF Trust - Davis Select Worldwide ETF | 1.92 | 0.00 | 79.41 | 9.95 | 0.4246 | 0.0083 | |||
| APP / AppLovin Corporation | 0.22 | 31.94 | 75.29 | 74.32 | 0.4026 | 0.1536 | |||
| SE / Sea Limited - Depositary Receipt (Common Stock) | 0.45 | -12.89 | 71.70 | 6.77 | 0.3834 | -0.0037 | |||
| L / Loews Corporation | 0.60 | -0.29 | 54.75 | -0.56 | 0.2928 | -0.0246 | |||
| BAC / Bank of America Corporation | 1.15 | -0.24 | 54.58 | 13.12 | 0.2918 | 0.0137 | |||
| WCC / WESCO International, Inc. | 0.29 | 12.47 | 53.85 | 34.13 | 0.2879 | 0.0565 | |||
| NTB / The Bank of N.T. Butterfield & Son Limited | 1.06 | -0.58 | 47.04 | 13.12 | 0.2515 | 0.0118 | |||
| RKT / Rocket Companies, Inc. | 3.13 | -0.21 | 44.42 | 17.23 | 0.2375 | 0.0191 | |||
| RNR / RenaissanceRe Holdings Ltd. | 0.14 | -0.51 | 34.75 | 0.69 | 0.1858 | -0.0131 | |||
| BEKE / KE Holdings Inc. - Depositary Receipt (Common Stock) | 1.85 | -0.41 | 32.87 | -12.07 | 0.1757 | -0.0397 | |||
| ORCL / Oracle Corporation | 0.13 | -3.52 | 28.77 | 50.87 | 0.1538 | 0.0439 | |||
| VALE / Vale S.A. - Depositary Receipt (Common Stock) | 2.95 | 7.87 | 28.63 | 4.95 | 0.1531 | -0.0042 | |||
| SCHW / The Charles Schwab Corporation | 0.30 | -0.39 | 27.05 | 16.10 | 0.1446 | 0.0103 | |||
| JCI / Johnson Controls International plc | 0.25 | -39.30 | 25.91 | -19.97 | 0.1385 | -0.0481 | |||
| AMT / American Tower Corporation | 0.09 | 3.05 | 20.26 | 4.67 | 0.1083 | -0.0032 | |||
| ANGI / Angi Inc. | 1.18 | -71.60 | 18.04 | -65.23 | 0.0964 | -0.1243 | |||
| SAP / SAP SE - Depositary Receipt (Common Stock) | 0.05 | -38.56 | 14.22 | -30.40 | 0.0760 | -0.0417 | |||
| BXP / Boston Properties, Inc. | 0.21 | 3.04 | 14.14 | 3.47 | 0.0756 | -0.0032 | |||
| NVDD / Direxion Shares ETF Trust - Direxion Daily NVDA Bear 1X Shares | 0.09 | 14.08 | 0.0753 | 0.0753 | |||||
| CUZ / Cousins Properties Incorporated | 0.46 | 2.98 | 13.82 | 4.82 | 0.0739 | -0.0021 | |||
| PLD / Prologis, Inc. | 0.13 | -24.76 | 13.58 | -29.25 | 0.0726 | -0.0380 | |||
| EG / Everest Group, Ltd. | 0.04 | -0.41 | 13.42 | -6.84 | 0.0718 | -0.0113 | |||
| REXR / Rexford Industrial Realty, Inc. | 0.38 | 3.13 | 13.34 | -6.29 | 0.0713 | -0.0107 | |||
| BRX / Brixmor Property Group Inc. | 0.50 | 2.90 | 12.98 | 0.93 | 0.0694 | -0.0047 | |||
| VTR / Ventas, Inc. | 0.20 | -18.72 | 12.84 | -25.36 | 0.0687 | -0.0305 | |||
| EQIX / Equinix, Inc. | 0.02 | 1.89 | 12.46 | -0.60 | 0.0666 | -0.0056 | |||
| NOAH / Noah Holdings Limited - Depositary Receipt (Common Stock) | 1.02 | -38.27 | 12.20 | -22.00 | 0.0652 | -0.0249 | |||
| DLR / Digital Realty Trust, Inc. | 0.07 | 1.98 | 11.93 | 24.07 | 0.0638 | 0.0084 | |||
| PSA / Public Storage | 0.04 | -18.81 | 11.85 | -20.40 | 0.0634 | -0.0225 | |||
| AVB / AvalonBay Communities, Inc. | 0.06 | 2.07 | 11.77 | -3.22 | 0.0629 | -0.0072 | |||
| ARE / Alexandria Real Estate Equities, Inc. | 0.16 | 3.22 | 11.34 | -18.97 | 0.0607 | -0.0200 | |||
| JD / JD.com, Inc. - Depositary Receipt (Common Stock) | 0.34 | -0.57 | 11.21 | -21.08 | 0.0599 | -0.0219 | |||
| SHO / Sunstone Hotel Investors, Inc. | 1.16 | 45.94 | 10.03 | 34.62 | 0.0536 | 0.0107 | |||
| MTB / M&T Bank Corporation | 0.05 | -0.46 | 9.88 | 8.02 | 0.0528 | 0.0001 | |||
| SPG / Simon Property Group, Inc. | 0.06 | -13.68 | 9.44 | -16.45 | 0.0505 | -0.0146 | |||
| AMH / American Homes 4 Rent | 0.25 | 2.98 | 9.03 | -1.76 | 0.0483 | -0.0047 | |||
| CPT / Camden Property Trust | 0.08 | 2.80 | 8.86 | -5.28 | 0.0474 | -0.0065 | |||
| REG / Regency Centers Corporation | 0.12 | 3.12 | 8.68 | -0.42 | 0.0464 | -0.0038 | |||
| EXR / Extra Space Storage Inc. | 0.06 | -0.04 | 8.37 | -0.75 | 0.0448 | -0.0038 | |||
| ESS / Essex Property Trust, Inc. | 0.03 | 2.92 | 8.09 | -4.86 | 0.0432 | -0.0058 | |||
| MAA / Mid-America Apartment Communities, Inc. | 0.05 | 3.11 | 7.85 | -8.93 | 0.0420 | -0.0077 | |||
| EGP / EastGroup Properties, Inc. | 0.05 | 3.08 | 7.71 | -2.19 | 0.0412 | -0.0042 | |||
| STT / State Street Corporation | 0.07 | -0.62 | 7.68 | 18.04 | 0.0411 | 0.0036 | |||
| EQR / Equity Residential | 0.10 | 1.87 | 6.87 | -3.95 | 0.0367 | -0.0045 | |||
| DOC / Healthpeak Properties, Inc. | 0.39 | 57.69 | 6.81 | 36.55 | 0.0364 | 0.0077 | |||
| TFC / Truist Financial Corporation | 0.16 | -0.37 | 6.70 | 4.07 | 0.0358 | -0.0013 | |||
| UDR / UDR, Inc. | 0.16 | 2.13 | 6.61 | -7.68 | 0.0354 | -0.0059 | |||
| HPP / Hudson Pacific Properties, Inc. | 2.30 | -0.04 | 6.29 | -7.17 | 0.0336 | -0.0054 | |||
| TRNO / Terreno Realty Corporation | 0.10 | 3.34 | 5.84 | -8.35 | 0.0312 | -0.0055 | |||
| VICI / VICI Properties Inc. | 0.17 | 18.34 | 5.53 | 18.25 | 0.0296 | 0.0026 | |||
| CHCT / Community Healthcare Trust Incorporated | 0.33 | 10.12 | 5.53 | 0.84 | 0.0295 | -0.0020 | |||
| SUI / Sun Communities, Inc. | 0.04 | 53.23 | 4.85 | 50.67 | 0.0260 | 0.0074 | |||
| CCI / Crown Castle Inc. | 0.04 | 3.17 | 4.35 | 1.68 | 0.0232 | -0.0014 | |||
| DEI / Douglas Emmett, Inc. | 0.28 | 2.95 | 4.16 | -3.23 | 0.0223 | -0.0025 | |||
| CDP / COPT Defense Properties | 0.15 | 4.07 | 0.0218 | 0.0218 | |||||
| NTST / NETSTREIT Corp. | 0.22 | 91.81 | 3.73 | 104.88 | 0.0200 | 0.0095 | |||
| O / Realty Income Corporation | 0.05 | 2.82 | 0.0151 | 0.0151 | |||||
| IVE / iShares Trust - iShares S&P 500 Value ETF | 0.01 | -44.31 | 2.15 | -42.89 | 0.0115 | -0.0102 | |||
| TSM / Taiwan Semiconductor Manufacturing Company Limited - Depositary Receipt (Common Stock) | 0.01 | 1.63 | 0.0087 | 0.0087 | |||||
| LRCX / Lam Research Corporation | 0.01 | 0.00 | 1.20 | 33.97 | 0.0064 | 0.0012 | |||
| CCK / Crown Holdings, Inc. | 0.01 | 0.00 | 0.88 | 15.45 | 0.0047 | 0.0003 | |||
| RH / RH | 0.00 | 0.00 | 0.42 | -19.43 | 0.0023 | -0.0008 | |||
| AAPL / Apple Inc. | 0.00 | 0.26 | 0.0014 | 0.0014 | |||||
| XOM / Exxon Mobil Corporation | 0.00 | -99.01 | 0.22 | -98.82 | 0.0012 | -0.0465 | |||
| SKX / Skechers U.S.A., Inc. | 0.00 | -100.00 | 0.00 | 0.0000 | |||||
| INTC / Intel Corporation | 0.00 | -100.00 | 0.00 | 0.0000 | |||||
| HIW / Highwoods Properties, Inc. | 0.00 | -100.00 | 0.00 | 0.0000 | |||||
| FRT / Federal Realty Investment Trust | 0.00 | -100.00 | 0.00 | 0.0000 | |||||
| YOU / Clear Secure, Inc. | 0.00 | -100.00 | 0.00 | 0.0000 |