Statistik Asas
| Profil Orang Dalam | Minerva Advisors LLC |
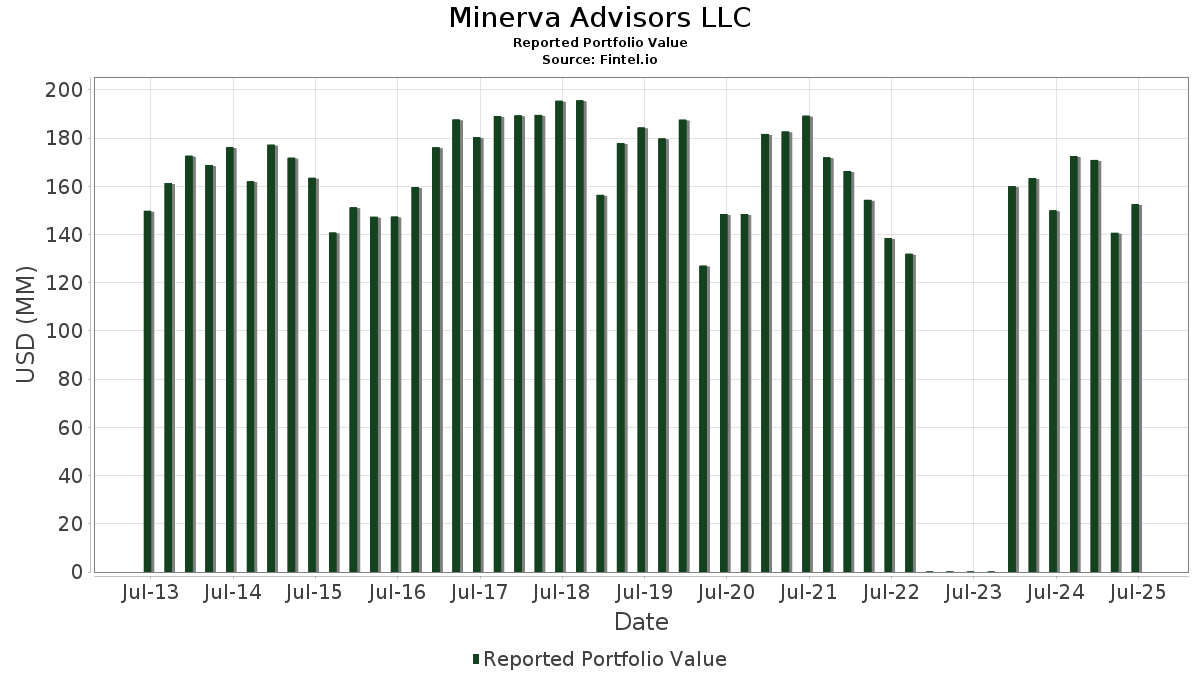
| Nilai Portfolio | $ 152,589,767 |
| Kedudukan Semasa | 56 |
Pegangan Terkini, Prestasi, AUM (dari 13F, 13D)
Minerva Advisors LLC telah mendedahkan 56 jumlah pegangan dalam pemfailan SEC terkini mereka. Nilai portfolio terkini dikira sebagai $ 152,589,767 USD. Aset Sebenar Di Bawah Pengurusan (AUM) ialah nilai ini ditambah dengan tunai (yang tidak didedahkan). Pegangan teratas Minerva Advisors LLC ialah Great Lakes Dredge & Dock Corporation (US:GLDD) , Tredegar Corporation (US:TG) , The Eastern Company (US:EML) , Virco Mfg. Corporation (US:VIRC) , and Astronics Corporation (US:ATRO) . Kedudukan baharu Minerva Advisors LLC termasuk Marathon Bancorp, Inc. (US:MBBC) , Kelly Services, Inc. (US:KELYA) , . Industri teratas Minerva Advisors LLC ialah "Fabricated Metal Products, Except Machinery And Transportation Equipment" (sic 34) , "Engineering, Accounting, Research, Management, And Related Services" (sic 87) , and "Water Transportation" (sic 44) .
Kenaikan Teratas Suku Tahun Ini
Kami menggunakan perubahan dalam peruntukan portfolio kerana ini adalah metrik yang paling bermakna. Perubahan boleh disebabkan oleh perdagangan atau perubahan dalam harga saham.
| Sekuriti | Saham (MM) |
Nilai (MM$) |
Portfolio % | ΔPortfolio % |
|---|---|---|---|---|
| 0.20 | 4.68 | 2.2937 | 0.4515 | |
| 0.05 | 0.54 | 0.3572 | 0.3572 | |
| 0.04 | 0.47 | 0.3064 | 0.3064 | |
| 1.11 | 6.44 | 3.1593 | 0.2278 | |
| 0.08 | 1.49 | 0.7293 | 0.2203 | |
| 0.08 | 4.50 | 2.2073 | 0.1426 | |
| 0.22 | 1.89 | 0.9258 | 0.0650 |
Penurunan Teratas Suku Tahun Ini
Kami menggunakan perubahan dalam peruntukan portfolio kerana ini adalah metrik yang paling bermakna. Perubahan boleh disebabkan oleh perdagangan atau perubahan dalam harga saham.
| Sekuriti | Saham (MM) |
Nilai (MM$) |
Portfolio % | ΔPortfolio % |
|---|---|---|---|---|
| 0.26 | 8.56 | 4.1991 | -3.7565 | |
| 0.53 | 11.98 | 5.8759 | -3.2300 | |
| 1.28 | 10.24 | 5.0230 | -3.1158 | |
| 0.54 | 7.49 | 3.6714 | -2.1771 | |
| 1.66 | 14.58 | 7.1514 | -1.9177 | |
| 0.26 | 3.94 | 1.9314 | -1.1324 | |
| 0.09 | 5.27 | 2.5830 | -0.8784 | |
| 0.28 | 2.83 | 1.3856 | -0.8603 | |
| 1.26 | 3.69 | 1.8103 | -0.8403 | |
| 0.09 | 3.63 | 1.7820 | -0.7943 |
Pemfailan 13D/G
Ini ialah senarai pemfailan 13D dan 13G yang dibuat pada tahun lepas (jika ada). Klik ikon pautan untuk melihat sejarah transaksi penuh. Baris hijau menunjukkan kedudukan baharu. Baris merah menunjukkan kedudukan tertutup.
| Tarikh Fail | Borang | Sekuriti | Saham Terdahulu |
Saham Semasa |
ΔSaham % | % Pemilikan |
% ΔPemilikan | |
|---|---|---|---|---|---|---|---|---|
| 2025-06-06 | NUVR / Nuvera Communications, Inc. | 608,955 | 11.80 | |||||
| 2025-04-11 | UFI / Unifi, Inc. | 921,787 | 5.00 | |||||
| 2025-02-05 | USAP / Universal Stainless & Alloy Products, Inc. | 391,487 | 4.20 | |||||
| 2024-11-01 | KEQU / Kewaunee Scientific Corporation | |||||||
| 2024-10-17 | DLHC / DLH Holdings Corp. |
13F dan Pemfailan Dana
Borang ini telah difailkan pada 2025-08-13 untuk tempoh pelaporan 2025-06-30. Klik ikon pautan untuk melihat sejarah transaksi penuh.
Tingkatkan untuk membuka data premium dan eksport ke Excel ![]() .
.
| Sekuriti | Jenis | Purata Harga Saham | Saham (MM) |
ΔSaham (%) |
ΔSaham (%) |
Nilai ($MM) |
Portfolio (%) |
ΔPortfolio (%) |
|
|---|---|---|---|---|---|---|---|---|---|
| GLDD / Great Lakes Dredge & Dock Corporation | 1.39 | 0.00 | 16.93 | 40.00 | 8.3015 | -0.2925 | |||
| TG / Tredegar Corporation | 1.66 | 0.00 | 14.58 | 14.29 | 7.1514 | -1.9177 | |||
| EML / The Eastern Company | 0.53 | 3.77 | 11.98 | -6.48 | 5.8759 | -3.2300 | |||
| VIRC / Virco Mfg. Corporation | 1.28 | 6.04 | 10.24 | -10.55 | 5.0230 | -3.1158 | |||
| ATRO / Astronics Corporation | 0.26 | -44.74 | 8.56 | -23.51 | 4.1991 | -3.7565 | |||
| ESCA / Escalade, Incorporated | 0.54 | 0.00 | 7.49 | -9.02 | 3.6714 | -2.1771 | |||
| DLHC / DLH Holdings Corp. | 1.11 | 9.07 | 6.44 | 56.21 | 3.1593 | 0.2278 | |||
| INFU / InfuSystem Holdings, Inc. | 0.99 | 9.24 | 6.18 | 26.09 | 3.0295 | -0.4528 | |||
| UFI / Unifi, Inc. | 1.09 | 19.55 | 5.66 | 29.73 | 2.7780 | -0.3254 | |||
| UTMD / Utah Medical Products, Inc. | 0.09 | 7.08 | 5.27 | 8.17 | 2.5830 | -0.8784 | |||
| THRY / Thryv Holdings, Inc. | 0.20 | 0.00 | 4.68 | 80.51 | 2.2937 | 0.4515 | |||
| KEQU / Kewaunee Scientific Corporation | 0.08 | 4.98 | 4.50 | 54.96 | 2.2073 | 0.1426 | |||
| NVGS / Navigator Holdings Ltd. | 0.30 | 0.00 | 4.30 | 7.18 | 2.1075 | -0.7420 | |||
| PBHC / Pathfinder Bancorp, Inc. | 0.26 | 0.00 | 3.94 | -8.63 | 1.9314 | -1.1324 | |||
| SSP / The E.W. Scripps Company | 1.26 | 0.00 | 3.69 | -1.02 | 1.8103 | -0.8403 | |||
| CAC / Camden National Corporation | 0.09 | 0.00 | 3.63 | 0.25 | 1.7820 | -0.7943 | |||
| SGA / Saga Communications, Inc. | 0.23 | 0.00 | 2.89 | 2.26 | 1.4174 | -0.5918 | |||
| CRD.B / Crawford & Company | 0.28 | 1.81 | 2.83 | -10.57 | 1.3856 | -0.8603 | |||
| RAIL / FreightCar America, Inc. | 0.22 | 0.00 | 1.89 | 55.82 | 0.9258 | 0.0650 | |||
| FSTR / L.B. Foster Company | 0.08 | 5.22 | 1.83 | 16.62 | 0.8981 | -0.2181 | |||
| SIF / SIFCO Industries, Inc. | 0.47 | 0.03 | 1.74 | 35.17 | 0.8541 | -0.0616 | |||
| NODK / NI Holdings, Inc. | 0.13 | 0.00 | 1.65 | -10.69 | 0.8116 | -0.5050 | |||
| UIS / Unisys Corporation | 0.35 | 0.00 | 1.56 | -1.32 | 0.7672 | -0.3594 | |||
| MPB / Mid Penn Bancorp, Inc. | 0.05 | 4.73 | 1.53 | 13.81 | 0.7479 | -0.2048 | |||
| CTGO / Contango Ore, Inc. | 0.08 | 8.55 | 1.49 | 107.68 | 0.7293 | 0.2203 | |||
| CFG / Citizens Financial Group, Inc. | 0.02 | 0.00 | 1.06 | 9.21 | 0.5176 | -0.1692 | |||
| DORM / Dorman Products, Inc. | 0.01 | 0.00 | 1.05 | 1.74 | 0.5165 | -0.2194 | |||
| HONE / HarborOne Bancorp, Inc. | 0.09 | 0.00 | 1.03 | 12.66 | 0.5064 | -0.1452 | |||
| FNB / F.N.B. Corporation | 0.06 | 0.00 | 0.93 | 8.48 | 0.4581 | -0.1544 | |||
| DGICA / Donegal Group Inc. | 0.05 | 0.00 | 0.93 | 1.97 | 0.4562 | -0.1924 | |||
| CZNC / Citizens & Northern Corporation | 0.04 | 0.00 | 0.81 | -5.91 | 0.3985 | -0.2150 | |||
| ECBK / ECB Bancorp, Inc. | 0.05 | 0.00 | 0.77 | 1.98 | 0.3781 | -0.1596 | |||
| CPBI / Central Plains Bancshares, Inc. | 0.05 | 0.00 | 0.74 | 1.09 | 0.3632 | -0.1576 | |||
| FRBA / First Bank | 0.04 | 0.00 | 0.64 | 4.27 | 0.3115 | -0.1216 | |||
| USLM / United States Lime & Minerals, Inc. | 0.01 | 0.00 | 0.62 | 12.86 | 0.3059 | -0.0867 | |||
| MBBC / Marathon Bancorp, Inc. | 0.05 | 0.54 | 0.3572 | 0.3572 | |||||
| HBNC / Horizon Bancorp, Inc. | 0.04 | 0.00 | 0.54 | 1.89 | 0.2639 | -0.1118 | |||
| SSB / SouthState Corporation | 0.01 | 0.00 | 0.52 | -0.95 | 0.2554 | -0.1180 | |||
| CLBK / Columbia Financial, Inc. | 0.03 | 0.00 | 0.49 | -3.16 | 0.2405 | -0.1198 | |||
| NWBI / Northwest Bancshares, Inc. | 0.04 | 0.00 | 0.49 | 6.36 | 0.2382 | -0.0865 | |||
| LSBK / Lake Shore Bancorp, Inc. | 0.03 | 1.18 | 0.48 | 1.26 | 0.2361 | -0.1021 | |||
| KELYA / Kelly Services, Inc. | 0.04 | 0.47 | 0.3064 | 0.3064 | |||||
| CZFS / Citizens Financial Services, Inc. | 0.01 | 1.00 | 0.46 | 2.21 | 0.2269 | -0.0950 | |||
| FCF / First Commonwealth Financial Corporation | 0.03 | 0.00 | 0.42 | 4.53 | 0.2036 | -0.0787 | |||
| RMBI / Richmond Mutual Bancorporation, Inc. | 0.03 | 0.00 | 0.41 | 7.81 | 0.2030 | -0.0699 | |||
| FSFG / First Savings Financial Group, Inc. | 0.02 | 0.00 | 0.40 | -3.36 | 0.1980 | -0.0990 | |||
| PRA / ProAssurance Corporation | 0.02 | 0.00 | 0.39 | -2.24 | 0.1930 | -0.0931 | |||
| ACNT / Ascent Industries Co. | 0.03 | 0.00 | 0.38 | -0.52 | 0.1881 | -0.0856 | |||
| FRME / First Merchants Corporation | 0.01 | 0.00 | 0.38 | -5.26 | 0.1855 | -0.0984 | |||
| CBU / Community Financial System, Inc. | 0.01 | 0.00 | 0.37 | -2.66 | 0.1797 | -0.0877 | |||
| PBBK / PB Bankshares, Inc. | 0.02 | 0.00 | 0.36 | 6.21 | 0.1764 | -0.0639 | |||
| NWFL / Norwood Financial Corp. | 0.01 | 0.00 | 0.35 | 6.67 | 0.1730 | -0.0621 | |||
| EBMT / Eagle Bancorp Montana, Inc. | 0.02 | 0.00 | 0.35 | -0.57 | 0.1722 | -0.0790 | |||
| DGICB / Donegal Group Inc. | 0.02 | 0.00 | 0.31 | 6.10 | 0.1535 | -0.0565 | |||
| DLX / Deluxe Corporation | 0.01 | 0.00 | 0.22 | 0.91 | 0.1085 | -0.0477 | |||
| ASRV / AmeriServ Financial, Inc. | 0.06 | 0.00 | 0.17 | 23.40 | 0.0856 | -0.0149 | |||
| VBFC / Village Bank and Trust Financial Corp. | 0.00 | -100.00 | 0.00 | 0.0000 |