Statistik Asas
| Profil Orang Dalam | Opaleye Management Inc. |
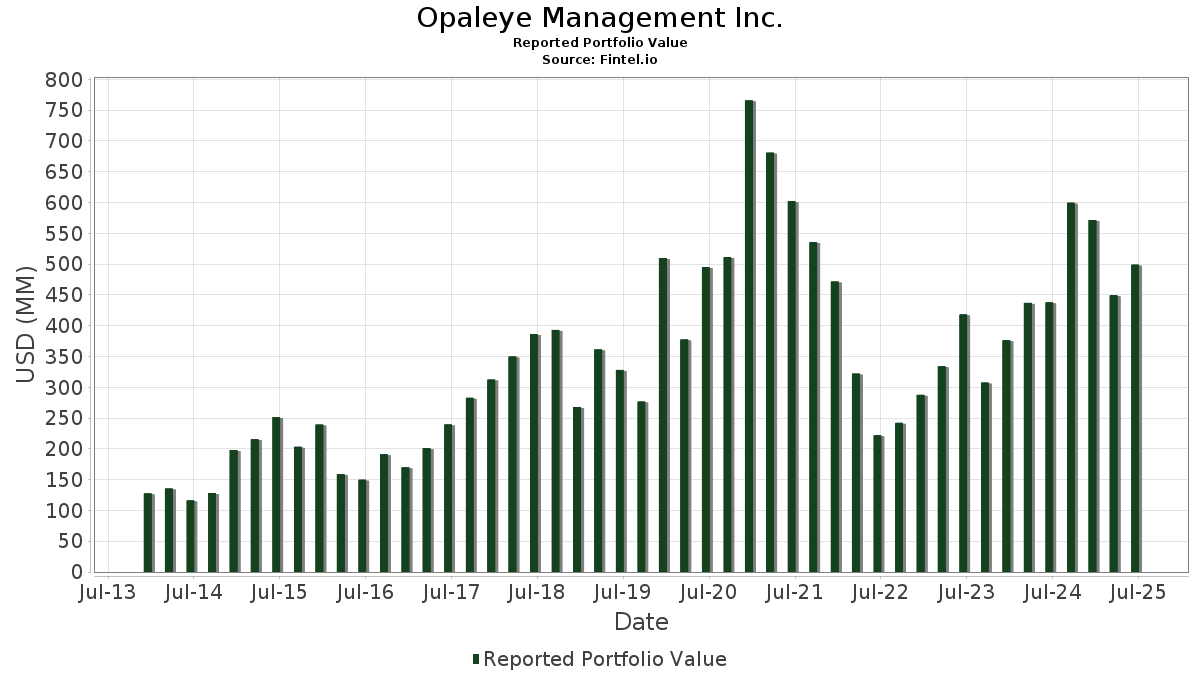
| Nilai Portfolio | $ 494,141,450 |
| Kedudukan Semasa | 41 |
Pegangan Terkini, Prestasi, AUM (dari 13F, 13D)
Opaleye Management Inc. telah mendedahkan 41 jumlah pegangan dalam pemfailan SEC terkini mereka. Nilai portfolio terkini dikira sebagai $ 494,141,450 USD. Aset Sebenar Di Bawah Pengurusan (AUM) ialah nilai ini ditambah dengan tunai (yang tidak didedahkan). Pegangan teratas Opaleye Management Inc. ialah Harrow, Inc. (US:HROW) , Eton Pharmaceuticals, Inc. (US:ETON) , Immunome, Inc. (US:IMNM) , SANUWAVE Health, Inc. (US:SNWV) , and Liquidia Corporation (US:LQDA) . Kedudukan baharu Opaleye Management Inc. termasuk Sarepta Therapeutics, Inc. (US:SRPT) , Vigil Neuroscience, Inc. (US:VIGL) , Gossamer Bio Inc (US:US38341PAA03) , Karyopharm Therapeutics Inc (US:US48576UAA43) , and Revolution Medicines, Inc. (US:RVMD) . Industri teratas Opaleye Management Inc. ialah "Miscellaneous Retail " (sic 59) , "Measuring, Analyzing, And Controlling Instruments; Photographic, Medical And Optical Goods; Watches And Clocks" (sic 38) , and "Chemicals And Allied Products" (sic 28) .
Kenaikan Teratas Suku Tahun Ini
Kami menggunakan perubahan dalam peruntukan portfolio kerana ini adalah metrik yang paling bermakna. Perubahan boleh disebabkan oleh perdagangan atau perubahan dalam harga saham.
| Sekuriti | Saham (MM) |
Nilai (MM$) |
Portfolio % | ΔPortfolio % |
|---|---|---|---|---|
| 0.50 | 8.55 | 1.7303 | 1.7303 | |
| 1.00 | 7.95 | 1.6089 | 1.6089 | |
| 4.11 | 11.88 | 2.4037 | 1.4875 | |
| 3.53 | 32.83 | 6.6429 | 1.3236 | |
| 0.19 | 9.87 | 1.9979 | 1.0585 | |
| 0.56 | 6.38 | 1.2911 | 0.8470 | |
| 0.10 | 3.86 | 0.7817 | 0.7817 | |
| 3.90 | 119.26 | 24.1345 | 0.7120 | |
| 12.60 | 30.74 | 6.2217 | 0.5321 | |
| 0.90 | 4.03 | 0.8154 | 0.5152 |
Penurunan Teratas Suku Tahun Ini
Kami menggunakan perubahan dalam peruntukan portfolio kerana ini adalah metrik yang paling bermakna. Perubahan boleh disebabkan oleh perdagangan atau perubahan dalam harga saham.
| Sekuriti | Saham (MM) |
Nilai (MM$) |
Portfolio % | ΔPortfolio % |
|---|---|---|---|---|
| 2.48 | 30.84 | 6.2408 | -1.1809 | |
| 0.98 | 32.20 | 6.5169 | -1.1374 | |
| 0.85 | 2.59 | 0.5243 | -1.1166 | |
| 0.54 | 19.25 | 3.8966 | -0.8000 | |
| 0.39 | 2.13 | 0.4317 | -0.6816 | |
| 0.49 | 6.42 | 1.3000 | -0.6347 | |
| 1.68 | 12.36 | 2.5023 | -0.5845 | |
| 0.39 | 2.06 | 0.4170 | -0.3804 | |
| 0.50 | 5.62 | 1.1383 | -0.3782 | |
| 0.38 | 0.28 | 0.0577 | -0.2780 |
Pemfailan 13D/G
Ini ialah senarai pemfailan 13D dan 13G yang dibuat pada tahun lepas (jika ada). Klik ikon pautan untuk melihat sejarah transaksi penuh. Baris hijau menunjukkan kedudukan baharu. Baris merah menunjukkan kedudukan tertutup.
| Tarikh Fail | Borang | Sekuriti | Saham Terdahulu |
Saham Semasa |
ΔSaham % | % Pemilikan |
% ΔPemilikan | |
|---|---|---|---|---|---|---|---|---|
| 2025-08-29 | SLGL / Sol-Gel Technologies Ltd. | 139,386 | 5.00 | |||||
| 2025-08-29 | LRMR / Larimar Therapeutics, Inc. | 3,952,409 | 4,110,000 | 3.99 | 4.80 | -22.20 | ||
| 2025-04-28 | TARA / Protara Therapeutics, Inc. | 1,825,000 | 1,730,000 | -5.21 | 4.71 | -11.47 | ||
| 2025-02-14 | OCUL / Ocular Therapeutix, Inc. | 6,070,000 | 4,342,500 | -28.46 | 2.76 | -49.91 | ||
| 2025-02-14 | IBIO / iBio, Inc. | 650,000 | 750,000 | 15.38 | 7.60 | -0.39 | ||
| 2025-02-14 | CNTX / Context Therapeutics Inc. | 820,000 | 0 | -100.00 | 0.00 | -100.00 | ||
| 2024-10-22 | SNWV / SANUWAVE Health, Inc. | 944,132 | 11.06 | |||||
| 2024-09-18 | CDXS / Codexis, Inc. | 3,540,000 | 7,524,000 | 112.54 | 10.61 | 111.35 | ||
| 2024-09-12 | ETON / Eton Pharmaceuticals, Inc. | 2,524,887 | 2,672,500 | 5.85 | 10.34 | 5.08 |
13F dan Pemfailan Dana
Borang ini telah difailkan pada 2025-08-15 untuk tempoh pelaporan 2025-06-30. Klik ikon pautan untuk melihat sejarah transaksi penuh.
Tingkatkan untuk membuka data premium dan eksport ke Excel ![]() .
.
| Sekuriti | Jenis | Purata Harga Saham | Saham (MM) |
ΔSaham (%) |
ΔSaham (%) |
Nilai ($MM) |
Portfolio (%) |
ΔPortfolio (%) |
|
|---|---|---|---|---|---|---|---|---|---|
| HROW / Harrow, Inc. | 3.90 | -1.26 | 119.26 | 13.36 | 24.1345 | 0.7120 | |||
| ETON / Eton Pharmaceuticals, Inc. | 2.86 | 0.28 | 40.76 | 10.09 | 8.2476 | 0.0055 | |||
| IMNM / Immunome, Inc. | 3.53 | -0.58 | 32.83 | 37.39 | 6.6429 | 1.3236 | |||
| SNWV / SANUWAVE Health, Inc. | 0.98 | 0.82 | 32.20 | -6.33 | 6.5169 | -1.1374 | |||
| LQDA / Liquidia Corporation | 2.48 | 9.51 | 30.84 | -7.49 | 6.2408 | -1.1809 | |||
| CDXS / Codexis, Inc. | 12.60 | 32.63 | 30.74 | 20.31 | 6.2217 | 0.5321 | |||
| RYTM / Rhythm Pharmaceuticals, Inc. | 0.47 | -3.06 | 30.02 | 15.64 | 6.0742 | 0.2955 | |||
| TGTX / TG Therapeutics, Inc. | 0.54 | 0.00 | 19.25 | -8.73 | 3.8966 | -0.8000 | |||
| OCUL / Ocular Therapeutix, Inc. | 1.59 | 0.00 | 14.80 | 26.60 | 2.9954 | 0.3924 | |||
| ARVN / Arvinas, Inc. | 1.68 | -14.94 | 12.36 | -10.82 | 2.5023 | -0.5845 | |||
| LRMR / Larimar Therapeutics, Inc. | 4.11 | 114.72 | 11.88 | 188.63 | 2.4037 | 1.4875 | |||
| IRON / Disc Medicine, Inc. | 0.19 | 119.32 | 9.87 | 133.99 | 1.9979 | 1.0585 | |||
| SRPT / Sarepta Therapeutics, Inc. | 0.50 | 8.55 | 1.7303 | 1.7303 | |||||
| VIGL / Vigil Neuroscience, Inc. | 1.00 | 7.95 | 1.6089 | 1.6089 | |||||
| CGON / CG Oncology, Inc. | 0.27 | 62.21 | 6.92 | 72.21 | 1.3996 | 0.5055 | |||
| XOMA / XOMA Royalty Corporation | 0.26 | 0.81 | 6.43 | 27.46 | 1.3009 | 0.1781 | |||
| EWTX / Edgewise Therapeutics, Inc. | 0.49 | 24.05 | 6.42 | -26.09 | 1.3000 | -0.6347 | |||
| STOK / Stoke Therapeutics, Inc. | 0.56 | 87.37 | 6.38 | 219.80 | 1.2911 | 0.8470 | |||
| ANIK / Anika Therapeutics, Inc. | 0.59 | 49.06 | 6.23 | 4.94 | 1.2607 | -0.0611 | |||
| US38341PAA03 / Gossamer Bio Inc | 5.95 | -5.87 | 1.2039 | -0.2030 | |||||
| PTGX / Protagonist Therapeutics, Inc. | 0.10 | 0.00 | 5.80 | 14.30 | 1.1744 | 0.0439 | |||
| DNA / Ginkgo Bioworks Holdings, Inc. | 0.50 | -58.16 | 5.62 | -17.41 | 1.1383 | -0.3782 | |||
| US48576UAA43 / Karyopharm Therapeutics Inc | 4.56 | 0.00 | 0.9220 | -0.0925 | |||||
| GOSS / Gossamer Bio, Inc. | 3.54 | -17.32 | 4.36 | -7.55 | 0.8824 | -0.1676 | |||
| RZLT / Rezolute, Inc. | 0.90 | 94.29 | 4.03 | 198.89 | 0.8154 | 0.5152 | |||
| RVMD / Revolution Medicines, Inc. | 0.10 | 3.86 | 0.7817 | 0.7817 | |||||
| EPIX / ESSA Pharma Inc. | 2.21 | 0.00 | 3.76 | 7.59 | 0.7603 | -0.0171 | |||
| CRGX / CARGO Therapeutics, Inc. | 0.67 | 0.00 | 2.75 | 1.22 | 0.5557 | -0.0482 | |||
| MBX / MBX Biosciences, Inc. | 0.24 | -4.27 | 2.73 | 47.97 | 0.5526 | 0.1418 | |||
| ZYME / Zymeworks Inc. | 0.21 | 20.00 | 2.64 | 26.44 | 0.5333 | 0.0693 | |||
| TARA / Protara Therapeutics, Inc. | 0.85 | -50.58 | 2.59 | -64.85 | 0.5243 | -1.1166 | |||
| ALMS / Alumis Inc. | 0.78 | 2.33 | 0.4705 | 0.4705 | |||||
| ZNTL / Zentalis Pharmaceuticals, Inc. | 1.92 | -3.06 | 2.23 | -29.28 | 0.4517 | -0.2510 | |||
| TRVI / Trevi Therapeutics, Inc. | 0.39 | -50.94 | 2.13 | -57.34 | 0.4317 | -0.6816 | |||
| RCEL / AVITA Medical, Inc. | 0.39 | -11.47 | 2.06 | -42.47 | 0.4170 | -0.3804 | |||
| IRD / Opus Genetics, Inc. | 1.22 | 3.83 | 1.15 | -25.68 | 0.2326 | -0.1117 | |||
| DERM / Journey Medical Corporation | 0.10 | 37.04 | 0.68 | 66.75 | 0.1380 | 0.0470 | |||
| ELEV / Elevation Oncology, Inc. | 1.44 | 0.53 | 0.1071 | 0.1071 | |||||
| IBIO / iBio, Inc. | 0.38 | 0.00 | 0.28 | -81.09 | 0.0577 | -0.2780 | |||
| PEPG / PepGen Inc. | 0.24 | -42.86 | 0.27 | -54.92 | 0.0539 | -0.0775 | |||
| ADGM / Adagio Medical Holdings, Inc. | 0.11 | 0.00 | 0.14 | 55.43 | 0.0291 | 0.0086 | |||
| NRIX / Nurix Therapeutics, Inc. | 0.00 | -100.00 | 0.00 | 0.0000 | |||||
| ANAB / AnaptysBio, Inc. | 0.00 | -100.00 | 0.00 | 0.0000 | |||||
| VTYX / Ventyx Biosciences, Inc. | 0.00 | -100.00 | 0.00 | 0.0000 | |||||
| BDSX / Biodesix, Inc. | 0.00 | -100.00 | 0.00 | 0.0000 | |||||
| SGMO / Sangamo Therapeutics, Inc. | 0.00 | -100.00 | 0.00 | -100.00 | -0.1540 | ||||
| OPTN / OptiNose, Inc. | 0.00 | -100.00 | 0.00 | 0.0000 | |||||
| SLRN / Acelyrin, Inc. | 0.00 | -100.00 | 0.00 | 0.0000 | |||||
| PVLA / Palvella Therapeutics, Inc. | 0.00 | -100.00 | 0.00 | 0.0000 | |||||
| KNSA / Kiniksa Pharmaceuticals, Ltd. | 0.00 | -100.00 | 0.00 | 0.0000 |