Statistik Asas
| Profil Orang Dalam | Select Equity Group, L.P. |
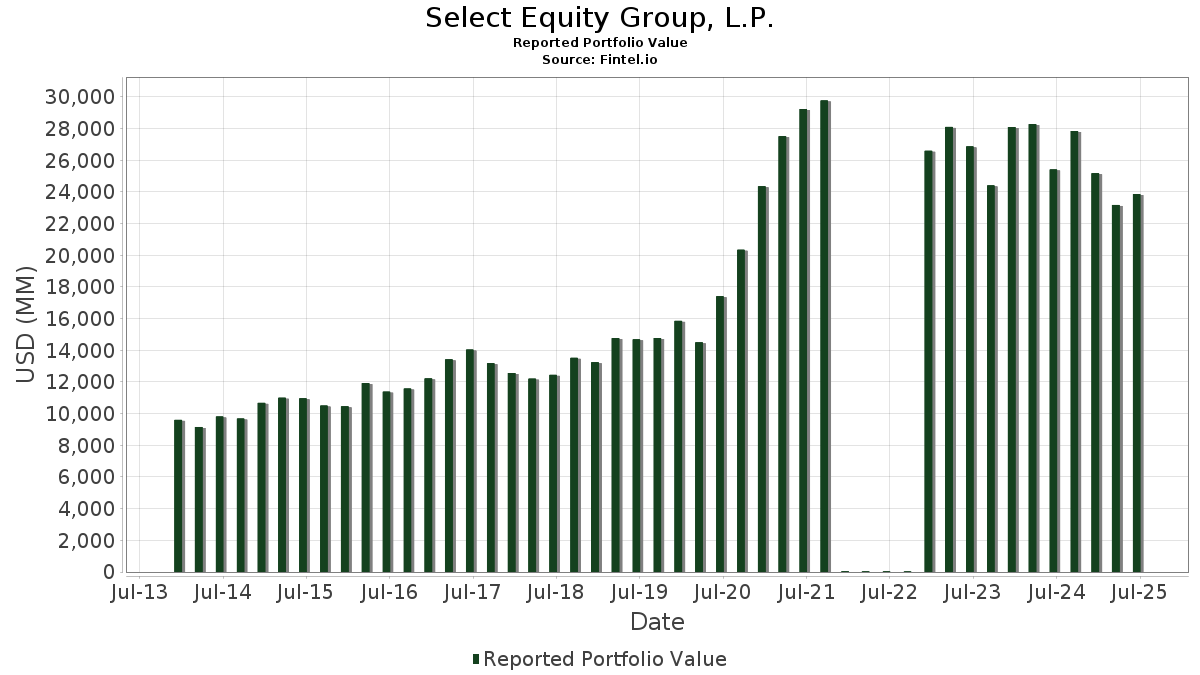
| Nilai Portfolio | $ 23,862,889,621 |
| Kedudukan Semasa | 152 |
Pegangan Terkini, Prestasi, AUM (dari 13F, 13D)
Select Equity Group, L.P. telah mendedahkan 152 jumlah pegangan dalam pemfailan SEC terkini mereka. Nilai portfolio terkini dikira sebagai $ 23,862,889,621 USD. Aset Sebenar Di Bawah Pengurusan (AUM) ialah nilai ini ditambah dengan tunai (yang tidak didedahkan). Pegangan teratas Select Equity Group, L.P. ialah Live Nation Entertainment, Inc. (US:LYV) , Viking Holdings Ltd (US:VIK) , Somnigroup International Inc. (US:SGI) , CRH plc (US:CRH) , and Westinghouse Air Brake Technologies Corporation (US:WAB) . Kedudukan baharu Select Equity Group, L.P. termasuk Newmont Corporation (US:NEM) , NVIDIA Corporation (US:NVDA) , Newmont Corporation (US:NEM) , Nasdaq, Inc. (US:NDAQ) , and QXO, Inc. (US:QXO) . Industri teratas Select Equity Group, L.P. ialah "Apparel And Other Finished Products Made From Fabrics And Similar Materials" (sic 23) , "Food And Kindred Products" (sic 20) , and "Hotels, Rooming Houses, Camps, And Other Lodging Places" (sic 70) .
Kenaikan Teratas Suku Tahun Ini
Kami menggunakan perubahan dalam peruntukan portfolio kerana ini adalah metrik yang paling bermakna. Perubahan boleh disebabkan oleh perdagangan atau perubahan dalam harga saham.
| Sekuriti | Saham (MM) |
Nilai (MM$) |
Portfolio % | ΔPortfolio % |
|---|---|---|---|---|
| 0.34 | 671.85 | 2.8155 | 1.2728 | |
| 4.10 | 239.05 | 1.0018 | 1.0018 | |
| 1.02 | 384.55 | 1.6115 | 0.9527 | |
| 2.26 | 511.86 | 2.1450 | 0.8173 | |
| 17.88 | 952.87 | 3.9931 | 0.7931 | |
| 1.09 | 172.83 | 0.7243 | 0.7243 | |
| 12.71 | 670.89 | 2.8114 | 0.6812 | |
| 2.25 | 259.12 | 1.0859 | 0.6051 | |
| 4.05 | 723.77 | 3.0331 | 0.4773 | |
| 1.92 | 111.84 | 0.4687 | 0.4687 |
Penurunan Teratas Suku Tahun Ini
Kami menggunakan perubahan dalam peruntukan portfolio kerana ini adalah metrik yang paling bermakna. Perubahan boleh disebabkan oleh perdagangan atau perubahan dalam harga saham.
| Sekuriti | Saham (MM) |
Nilai (MM$) |
Portfolio % | ΔPortfolio % |
|---|---|---|---|---|
| 5.19 | 267.40 | 1.1206 | -1.1016 | |
| 1.57 | 81.71 | 0.3424 | -1.0815 | |
| 2.55 | 141.13 | 0.5914 | -0.7762 | |
| 4.73 | 680.76 | 2.8528 | -0.7632 | |
| 2.92 | 150.21 | 0.6295 | -0.7281 | |
| 5.75 | 637.03 | 2.6695 | -0.6984 | |
| 2.92 | 235.45 | 0.9867 | -0.5512 | |
| 0.55 | 57.44 | 0.2407 | -0.5218 | |
| 1.47 | 91.05 | 0.3816 | -0.4855 | |
| 0.54 | 191.84 | 0.8039 | -0.3585 |
Pemfailan 13D/G
Ini ialah senarai pemfailan 13D dan 13G yang dibuat pada tahun lepas (jika ada). Klik ikon pautan untuk melihat sejarah transaksi penuh. Baris hijau menunjukkan kedudukan baharu. Baris merah menunjukkan kedudukan tertutup.
| Tarikh Fail | Borang | Sekuriti | Saham Terdahulu |
Saham Semasa |
ΔSaham % | % Pemilikan |
% ΔPemilikan | |
|---|---|---|---|---|---|---|---|---|
| 2025-08-14 | FBIN / Fortune Brands Innovations, Inc. | 8,559,466 | 5,194,296 | -39.32 | 4.30 | -37.68 | ||
| 2025-05-15 | MIDD / The Middleby Corporation | 6,561,001 | 5,517,126 | -15.91 | 10.30 | -15.57 | ||
| 2025-05-15 | SCI / Service Corporation International | 9,123,512 | 7,019,395 | -23.06 | 4.90 | -22.22 | ||
| 2025-05-15 | DAY / Dayforce Inc. | 11,400,740 | 5,436,576 | -52.31 | 3.40 | -52.78 | ||
| 2025-05-15 | SGI / Somnigroup International Inc. | 18,770,274 | 15,130,546 | -19.39 | 7.30 | -32.41 | ||
| 2025-02-27 | SIG / Signet Jewelers Limited | 4,306,370 | 4,217,695 | -2.06 | 9.70 | -2.02 | ||
| 2025-02-14 | VIK / Viking Holdings Ltd | 17,279,911 | 5.70 | |||||
| 2025-02-14 | TTC / The Toro Company | 5,557,179 | 4,905,975 | -11.72 | 4.80 | -11.11 | ||
| 2025-02-14 | LYV / Live Nation Entertainment, Inc. | 12,573,719 | 8,442,456 | -32.86 | 3.60 | -33.33 | ||
| 2025-02-14 | CNM / Core & Main, Inc. | 16,375,022 | 13,182,779 | -19.49 | 6.90 | -18.82 | ||
| 2025-02-14 | NEOG / Neogen Corporation | 13,241,197 | 9,396,150 | -29.04 | 4.30 | -29.51 | ||
| 2024-11-14 | MTN / Vail Resorts, Inc. | 2,722,916 | 616,355 | -77.36 | 1.60 | -77.78 | ||
| 2024-11-14 | RVTY / Revvity, Inc. | 11,272,550 | 5,174,224 | -54.10 | 4.30 | -52.75 | ||
| 2024-11-14 | MORN / Morningstar, Inc. | 2,984,115 | 1,759,321 | -41.04 | 4.10 | -41.43 | ||
| 2024-11-14 | OSW / OneSpaWorld Holdings Limited | 8,448,600 | 5,165,163 | -38.86 | 4.97 | -41.53 | ||
| 2024-11-14 | NAPA / The Duckhorn Portfolio, Inc. | 8,406,702 | 176,255 | -97.90 | 0.10 | -98.63 | ||
| 2024-11-14 | BRO / Brown & Brown, Inc. | 14,310,766 | 9,573,280 | -33.10 | 3.30 | -34.00 | ||
| 2024-11-14 | CLH / Clean Harbors, Inc. | 2,957,014 | 1,671,042 | -43.49 | 3.10 | -43.64 | ||
| 2024-11-14 | ITT / ITT Inc. | 4,237,979 | 5.20 |
13F dan Pemfailan Dana
Borang ini telah difailkan pada 2025-08-14 untuk tempoh pelaporan 2025-06-30. Klik ikon pautan untuk melihat sejarah transaksi penuh.
Tingkatkan untuk membuka data premium dan eksport ke Excel ![]() .
.
| Sekuriti | Jenis | Purata Harga Saham | Saham (MM) |
ΔSaham (%) |
ΔSaham (%) |
Nilai ($MM) |
Portfolio (%) |
ΔPortfolio (%) |
|
|---|---|---|---|---|---|---|---|---|---|
| LYV / Live Nation Entertainment, Inc. | 6.85 | -3.34 | 1,036.48 | 11.99 | 4.3435 | 0.3498 | |||
| VIK / Viking Holdings Ltd | 17.88 | -4.16 | 952.87 | 28.49 | 3.9931 | 0.7931 | |||
| SGI / Somnigroup International Inc. | 13.84 | -8.51 | 941.59 | 3.98 | 3.9458 | 0.0383 | |||
| CRH / CRH plc | 9.70 | -6.48 | 890.20 | -2.41 | 3.7305 | -0.2054 | |||
| WAB / Westinghouse Air Brake Technologies Corporation | 4.06 | -11.27 | 849.86 | 2.43 | 3.5614 | -0.0187 | |||
| CDW / CDW Corporation | 4.05 | 9.65 | 723.77 | 22.19 | 3.0331 | 0.4773 | |||
| CNM / Core & Main, Inc. | 11.47 | -10.99 | 691.95 | 11.19 | 2.8997 | 0.2144 | |||
| MIDD / The Middleby Corporation | 4.73 | -14.26 | 680.76 | -18.77 | 2.8528 | -0.7632 | |||
| MKL / Markel Group Inc. | 0.34 | 75.90 | 671.85 | 87.92 | 2.8155 | 1.2728 | |||
| TSCO / Tractor Supply Company | 12.71 | 41.89 | 670.89 | 35.89 | 2.8114 | 0.6812 | |||
| ITT / ITT Inc. | 4.23 | -11.29 | 663.04 | 7.72 | 2.7785 | 0.1226 | |||
| TRMB / Trimble Inc. | 8.64 | -6.34 | 656.82 | 8.40 | 2.7525 | 0.1379 | |||
| MLM / Martin Marietta Materials, Inc. | 1.18 | -0.68 | 649.57 | 14.03 | 2.7221 | 0.2641 | |||
| BRO / Brown & Brown, Inc. | 5.75 | -8.43 | 637.03 | -18.39 | 2.6695 | -0.6984 | |||
| ALC / Alcon Inc. | 6.76 | 23.44 | 596.38 | 15.73 | 2.4992 | 0.2757 | |||
| PAYX / Paychex, Inc. | 4.05 | 15.94 | 589.32 | 9.31 | 2.4696 | 0.1434 | |||
| SCI / Service Corporation International | 6.92 | -1.29 | 563.67 | 0.19 | 2.3621 | -0.0655 | |||
| LH / Labcorp Holdings Inc. | 2.13 | -3.93 | 559.88 | 8.36 | 2.3462 | 0.1167 | |||
| TSM / Taiwan Semiconductor Manufacturing Company Limited - Depositary Receipt (Common Stock) | 2.26 | 21.92 | 511.86 | 66.35 | 2.1450 | 0.8173 | |||
| STE / STERIS plc | 2.05 | -7.35 | 493.04 | -1.80 | 2.0661 | -0.1003 | |||
| EME / EMCOR Group, Inc. | 0.91 | -12.21 | 485.07 | 27.04 | 2.0327 | 0.3851 | |||
| PWR / Quanta Services, Inc. | 1.02 | 69.32 | 384.55 | 151.85 | 1.6115 | 0.9527 | |||
| CPAY / Corpay, Inc. | 1.13 | -7.63 | 373.60 | -12.11 | 1.5656 | -0.2685 | |||
| MORN / Morningstar, Inc. | 1.11 | -5.05 | 349.50 | -0.60 | 1.4646 | -0.0526 | |||
| SIG / Signet Jewelers Limited | 3.92 | -2.82 | 311.47 | 33.15 | 1.3052 | 0.2959 | |||
| IDXX / IDEXX Laboratories, Inc. | 0.57 | 23.66 | 307.71 | 57.93 | 1.2895 | 0.4488 | |||
| CP / Canadian Pacific Kansas City Limited | 3.38 | -11.75 | 268.05 | -0.29 | 1.1233 | -0.0366 | |||
| FBIN / Fortune Brands Innovations, Inc. | 5.19 | -38.60 | 267.40 | -48.08 | 1.1206 | -1.1016 | |||
| BJ / BJ's Wholesale Club Holdings, Inc. | 2.41 | 38.64 | 260.03 | 31.02 | 1.0897 | 0.2333 | |||
| SHOP / Shopify Inc. | 2.25 | 92.50 | 259.12 | 132.56 | 1.0859 | 0.6051 | |||
| KEX / Kirby Corporation | 2.17 | 10.81 | 245.64 | 24.41 | 1.0294 | 0.1774 | |||
| NEM / Newmont Corporation | Call | 4.10 | 239.05 | 1.0018 | 1.0018 | ||||
| JLL / Jones Lang LaSalle Incorporated | 0.93 | -12.11 | 238.77 | -9.32 | 1.0006 | -0.1355 | |||
| ENTG / Entegris, Inc. | 2.92 | -28.34 | 235.45 | -33.94 | 0.9867 | -0.5512 | |||
| CAE / CAE Inc. | 7.91 | 0.58 | 231.35 | 19.68 | 0.9695 | 0.1354 | |||
| CLH / Clean Harbors, Inc. | 0.95 | -13.29 | 218.92 | 1.70 | 0.9174 | -0.0115 | |||
| TDY / Teledyne Technologies Incorporated | 0.43 | 7.12 | 218.67 | 10.26 | 0.9164 | 0.0606 | |||
| V / Visa Inc. | 0.54 | -29.71 | 191.84 | -28.79 | 0.8039 | -0.3585 | |||
| NVDA / NVIDIA Corporation | 1.09 | 172.83 | 0.7243 | 0.7243 | |||||
| WDAY / Workday, Inc. | 0.67 | 31.15 | 160.56 | 34.78 | 0.6729 | 0.1588 | |||
| TECH / Bio-Techne Corporation | 2.92 | -45.59 | 150.21 | -52.26 | 0.6295 | -0.7281 | |||
| DAY / Dayforce Inc. | 2.55 | -53.11 | 141.13 | -55.47 | 0.5914 | -0.7762 | |||
| ADBE / Adobe Inc. | 0.36 | -29.26 | 140.76 | -28.64 | 0.5899 | -0.2613 | |||
| CR / Crane Company | 0.74 | 1.12 | 139.94 | 25.35 | 0.5864 | 0.1047 | |||
| INTU / Intuit Inc. | 0.17 | -25.05 | 136.17 | -3.85 | 0.5706 | -0.0405 | |||
| PTC / PTC Inc. | 0.78 | 26.66 | 133.58 | 40.88 | 0.5598 | 0.1506 | |||
| GOOG / Alphabet Inc. | 0.69 | 66.95 | 121.83 | 89.57 | 0.5105 | 0.2332 | |||
| MSFT / Microsoft Corporation | 0.24 | 53.46 | 121.30 | 103.34 | 0.5083 | 0.2509 | |||
| NEM / Newmont Corporation | 1.92 | 111.84 | 0.4687 | 0.4687 | |||||
| CRM / Salesforce, Inc. | 0.41 | 7.26 | 110.46 | 8.99 | 0.4629 | 0.0256 | |||
| NDAQ / Nasdaq, Inc. | 1.23 | 110.26 | 0.4621 | 0.4621 | |||||
| ZTS / Zoetis Inc. | 0.69 | 95.25 | 108.19 | 84.93 | 0.4534 | 0.2010 | |||
| COO / The Cooper Companies, Inc. | 1.44 | 92.49 | 102.60 | 62.39 | 0.4300 | 0.1573 | |||
| AVGO / Broadcom Inc. | 0.36 | 1,445.11 | 99.31 | 2,444.43 | 0.4162 | 0.3993 | |||
| APO / Apollo Global Management, Inc. | 0.69 | 52.86 | 97.78 | 58.36 | 0.4098 | 0.1433 | |||
| AMZN / Amazon.com, Inc. | 0.43 | 7.65 | 95.22 | 24.13 | 0.3990 | 0.0680 | |||
| APG / APi Group Corporation | 1.86 | -58.77 | 95.16 | -41.14 | 0.3988 | -0.2989 | |||
| BN / Brookfield Corporation | 1.47 | -61.61 | 91.05 | -54.69 | 0.3816 | -0.4855 | |||
| GRMN / Garmin Ltd. | 0.43 | -23.75 | 90.67 | -26.70 | 0.3800 | -0.1538 | |||
| DHR / Danaher Corporation | 0.42 | 96.18 | 82.45 | 89.04 | 0.3455 | 0.1573 | |||
| FTV / Fortive Corporation | 1.57 | -65.24 | 81.71 | -75.24 | 0.3424 | -1.0815 | |||
| PKG / Packaging Corporation of America | 0.42 | -38.74 | 79.57 | -41.70 | 0.3335 | -0.2555 | |||
| META / Meta Platforms, Inc. | 0.10 | 75.46 | 76.58 | 124.70 | 0.3209 | 0.1739 | |||
| ROL / Rollins, Inc. | 1.27 | 149.57 | 71.40 | 160.62 | 0.2992 | 0.1810 | |||
| QXO / QXO, Inc. | 3.25 | 70.01 | 0.2934 | 0.2934 | |||||
| BWXT / BWX Technologies, Inc. | 0.48 | 68.90 | 0.2887 | 0.2887 | |||||
| APH / Amphenol Corporation | 0.68 | -26.56 | 66.84 | 10.57 | 0.2801 | 0.0193 | |||
| BIO / Bio-Rad Laboratories, Inc. | 0.26 | -3.47 | 61.78 | -4.35 | 0.2589 | -0.0198 | |||
| NET / Cloudflare, Inc. | 0.30 | -52.85 | 59.39 | -18.06 | 0.2489 | -0.0639 | |||
| TMO / Thermo Fisher Scientific Inc. | 0.15 | 7.78 | 59.38 | -12.18 | 0.2489 | -0.0429 | |||
| PYPL / PayPal Holdings, Inc. | 0.78 | -15.72 | 57.82 | -4.00 | 0.2423 | -0.0176 | |||
| MHK / Mohawk Industries, Inc. | 0.55 | -64.60 | 57.44 | -67.50 | 0.2407 | -0.5218 | |||
| OWL / Blue Owl Capital Inc. | 2.76 | 42.28 | 52.93 | 36.39 | 0.2218 | 0.0544 | |||
| MTD / Mettler-Toledo International Inc. | 0.04 | 46.33 | 0.1942 | 0.1942 | |||||
| KKR / KKR & Co. Inc. | 0.35 | 46.09 | 0.1931 | 0.1931 | |||||
| NET / Cloudflare, Inc. | Call | 0.23 | 1,208.57 | 44.85 | 2,174.09 | 0.1879 | 0.1794 | ||
| MIR / Mirion Technologies, Inc. | 2.03 | -11.55 | 43.65 | 31.34 | 0.1829 | 0.0395 | |||
| WSM / Williams-Sonoma, Inc. | 0.27 | -6.25 | 43.58 | -3.13 | 0.1826 | -0.0115 | |||
| NOW / ServiceNow, Inc. | 0.04 | 37.18 | 0.1558 | 0.1558 | |||||
| USLM / United States Lime & Minerals, Inc. | 0.36 | 4.83 | 35.55 | 18.37 | 0.1490 | 0.0194 | |||
| DOCU / DocuSign, Inc. | 0.46 | -6.96 | 35.48 | -10.97 | 0.1487 | -0.0233 | |||
| CARG / CarGurus, Inc. | 1.05 | 14.91 | 35.15 | 32.03 | 0.1473 | 0.0324 | |||
| FXI / iShares Trust - iShares China Large-Cap ETF | Call | 0.92 | 2.68 | 33.64 | 5.32 | 0.1410 | 0.0031 | ||
| WTM / White Mountains Insurance Group, Ltd. | 0.02 | -36.17 | 32.09 | -40.48 | 0.1345 | -0.0982 | |||
| IRDM / Iridium Communications Inc. | 1.00 | 12.87 | 30.21 | 24.64 | 0.1266 | 0.0220 | |||
| CASY / Casey's General Stores, Inc. | 0.06 | -40.26 | 30.20 | -29.77 | 0.1265 | -0.0590 | |||
| OSW / OneSpaWorld Holdings Limited | 1.42 | 4.40 | 28.93 | 26.78 | 0.1212 | 0.0228 | |||
| SPGI / S&P Global Inc. | 0.05 | -33.38 | 27.15 | -30.86 | 0.1138 | -0.0557 | |||
| MCO / Moody's Corporation | 0.05 | 24.25 | 26.87 | 33.83 | 0.1126 | 0.0260 | |||
| CWST / Casella Waste Systems, Inc. | 0.23 | 12.73 | 26.77 | 16.64 | 0.1122 | 0.0132 | |||
| CINF / Cincinnati Financial Corporation | 0.18 | -44.19 | 26.20 | -43.73 | 0.1098 | -0.0911 | |||
| GDDY / GoDaddy Inc. | 0.14 | 25.77 | 0.1080 | 0.1080 | |||||
| CHEF / The Chefs' Warehouse, Inc. | 0.39 | -13.15 | 25.10 | 1.76 | 0.1052 | -0.0012 | |||
| FMC / FMC Corporation | Call | 0.59 | 2.26 | 24.76 | 1.19 | 0.1038 | -0.0018 | ||
| MSCI / MSCI Inc. | 0.04 | 10.34 | 24.56 | 12.53 | 0.1029 | 0.0088 | |||
| RAL / Ralliant Corporation | 0.49 | 23.67 | 0.0992 | 0.0992 | |||||
| FORM / FormFactor, Inc. | 0.62 | 78.59 | 21.25 | 117.23 | 0.0890 | 0.0468 | |||
| PII / Polaris Inc. | 0.52 | -67.89 | 21.15 | -68.12 | 0.0886 | -0.1976 | |||
| FAST / Fastenal Company | 0.47 | -38.50 | 19.82 | -66.69 | 0.0831 | -0.1737 | |||
| ALKT / Alkami Technology, Inc. | 0.58 | 9.55 | 17.37 | 25.78 | 0.0728 | 0.0132 | |||
| AMRZ / Amrize AG | 0.35 | 17.18 | 0.0720 | 0.0720 | |||||
| DKS / DICK'S Sporting Goods, Inc. | 0.08 | 16.73 | 0.0701 | 0.0701 | |||||
| CDRE / Cadre Holdings, Inc. | 0.49 | 8.50 | 15.46 | 16.71 | 0.0648 | 0.0076 | |||
| KAI / Kadant Inc. | 0.04 | -44.66 | 14.17 | -47.86 | 0.0594 | -0.0579 | |||
| LLY / Eli Lilly and Company | Put | 0.02 | 114.81 | 13.56 | 102.77 | 0.0568 | 0.0280 | ||
| CSW / CSW Industrials, Inc. | 0.04 | 14.83 | 12.57 | 12.97 | 0.0527 | 0.0047 | |||
| ALRM / Alarm.com Holdings, Inc. | 0.22 | 9.08 | 12.37 | 10.88 | 0.0518 | 0.0037 | |||
| PTLO / Portillo's Inc. | 1.03 | -3.44 | 12.07 | -5.22 | 0.0506 | -0.0044 | |||
| BMI / Badger Meter, Inc. | 0.05 | 30.86 | 12.03 | 68.49 | 0.0504 | 0.0196 | |||
| ROST / Ross Stores, Inc. | 0.09 | 11.88 | 0.0498 | 0.0498 | |||||
| BL / BlackLine, Inc. | 0.21 | 112.89 | 11.87 | 148.96 | 0.0498 | 0.0292 | |||
| FELE / Franklin Electric Co., Inc. | 0.13 | 40.51 | 11.68 | 34.31 | 0.0489 | 0.0114 | |||
| KRMN / Karman Holdings Inc. | 0.23 | 15.88 | 11.44 | 74.66 | 0.0479 | 0.0197 | |||
| WAY / Waystar Holding Corp. | 0.28 | 11.25 | 0.0471 | 0.0471 | |||||
| GE / General Electric Company | 0.04 | 10.87 | 0.0456 | 0.0456 | |||||
| LAMR / Lamar Advertising Company | 0.09 | -69.68 | 10.69 | -67.66 | 0.0448 | -0.0978 | |||
| BWIN / The Baldwin Insurance Group, Inc. | 0.24 | 50.66 | 10.40 | 44.32 | 0.0436 | 0.0125 | |||
| VRRM / Verra Mobility Corporation | 0.41 | -23.14 | 10.40 | -13.31 | 0.0436 | -0.0082 | |||
| BIP / Brookfield Infrastructure Partners L.P. - Limited Partnership | 0.31 | -88.31 | 10.38 | -86.85 | 0.0435 | -0.2971 | |||
| MYRG / MYR Group Inc. | 0.06 | 34.78 | 10.34 | 116.25 | 0.0433 | 0.0227 | |||
| WINA / Winmark Corporation | 0.03 | 16.01 | 10.27 | 37.81 | 0.0430 | 0.0109 | |||
| AON / Aon plc | 0.03 | 10.00 | 0.0419 | 0.0419 | |||||
| ERII / Energy Recovery, Inc. | 0.77 | 15.37 | 9.84 | -7.22 | 0.0412 | -0.0045 | |||
| OUT / OUTFRONT Media Inc. | 0.60 | 22.57 | 9.73 | 23.93 | 0.0408 | 0.0069 | |||
| CERT / Certara, Inc. | 0.83 | -24.47 | 9.67 | -10.74 | 0.0405 | -0.0062 | |||
| BOOT / Boot Barn Holdings, Inc. | 0.06 | -38.16 | 9.64 | -12.50 | 0.0404 | -0.0071 | |||
| MLAB / Mesa Laboratories, Inc. | 0.10 | 38.30 | 9.63 | 9.82 | 0.0404 | 0.0025 | |||
| COHR / Coherent Corp. | 0.11 | -41.38 | 9.44 | -19.47 | 0.0395 | -0.0110 | |||
| ADEA / Adeia Inc. | 0.54 | 6.37 | 7.66 | 13.76 | 0.0321 | 0.0030 | |||
| FNV N / Franco-Nevada Corporation | 0.05 | 7.66 | 0.0321 | 0.0321 | |||||
| SPSC / SPS Commerce, Inc. | 0.06 | 15.28 | 7.53 | 18.20 | 0.0315 | 0.0041 | |||
| CLFD / Clearfield, Inc. | 0.17 | -3.13 | 7.41 | 41.50 | 0.0311 | 0.0085 | |||
| GOGO / Gogo Inc. | 0.50 | 24.08 | 7.34 | 111.34 | 0.0308 | 0.0158 | |||
| ACA / Arcosa, Inc. | 0.08 | 54.87 | 7.26 | 74.15 | 0.0304 | 0.0124 | |||
| JOE / The St. Joe Company | 0.13 | 6.35 | 0.0266 | 0.0266 | |||||
| CIEN / Ciena Corporation | 0.07 | -2.88 | 5.68 | 30.71 | 0.0238 | 0.0051 | |||
| CLBT / Cellebrite DI Ltd. | 0.35 | 5.56 | 0.0233 | 0.0233 | |||||
| LOAR / Loar Holdings Inc. | 0.06 | 191.83 | 5.46 | 256.07 | 0.0229 | 0.0162 | |||
| UBER / Uber Technologies, Inc. | 0.06 | -54.36 | 5.43 | -41.57 | 0.0228 | -0.0174 | |||
| MLNK / MeridianLink, Inc. | 0.32 | 3.77 | 5.18 | -9.10 | 0.0217 | -0.0029 | |||
| GSHD / Goosehead Insurance, Inc | 0.04 | 342.34 | 4.57 | 295.42 | 0.0192 | 0.0142 | |||
| MRCY / Mercury Systems, Inc. | 0.08 | 351.57 | 4.51 | 464.58 | 0.0189 | 0.0155 | |||
| EL / The Estée Lauder Companies Inc. | Call | 0.05 | -38.11 | 3.87 | -24.24 | 0.0162 | -0.0058 | ||
| PTON / Peloton Interactive, Inc. | 0.51 | 3.56 | 0.0149 | 0.0149 | |||||
| AIN / Albany International Corp. | 0.05 | -61.14 | 3.44 | -60.53 | 0.0144 | -0.0232 | |||
| PII / Polaris Inc. | Call | 0.08 | 3.11 | 0.0130 | 0.0130 | ||||
| VFC / V.F. Corporation | Call | 0.23 | 104.90 | 2.70 | 55.17 | 0.0113 | 0.0038 | ||
| TENB / Tenable Holdings, Inc. | 0.07 | 32.72 | 2.28 | 28.20 | 0.0096 | 0.0019 | |||
| DOO / BRP Inc. | 0.04 | 1.79 | 0.0075 | 0.0075 | |||||
| INTC / Intel Corporation | 0.03 | 0.58 | 0.0024 | 0.0024 | |||||
| GFS / GLOBALFOUNDRIES Inc. | 0.01 | 0.57 | 0.0024 | 0.0024 | |||||
| TRI / Thomson Reuters Corporation | 0.00 | 0.00 | 0.42 | 16.34 | 0.0018 | 0.0002 | |||
| CIGI / Colliers International Group Inc. | 0.00 | -100.00 | 0.00 | 0.0000 | |||||
| LNTH / Lantheus Holdings, Inc. | 0.00 | -100.00 | 0.00 | 0.0000 | |||||
| H / Hyatt Hotels Corporation | 0.00 | -100.00 | 0.00 | 0.0000 | |||||
| POOL / Pool Corporation | 0.00 | -100.00 | 0.00 | 0.0000 | |||||
| MRVL / Marvell Technology, Inc. | 0.00 | -100.00 | 0.00 | 0.0000 | |||||
| RMD / ResMed Inc. | Put | 0.00 | -100.00 | 0.00 | 0.0000 | ||||
| ATS / ATS Corporation | 0.00 | -100.00 | 0.00 | 0.0000 | |||||
| TYL / Tyler Technologies, Inc. | 0.00 | -100.00 | 0.00 | 0.0000 | |||||
| SSB / SouthState Corporation | 0.00 | -100.00 | 0.00 | 0.0000 | |||||
| BE / Bloom Energy Corporation | 0.00 | -100.00 | 0.00 | 0.0000 | |||||
| MKC / McCormick & Company, Incorporated | 0.00 | -100.00 | 0.00 | 0.0000 | |||||
| AMD / Advanced Micro Devices, Inc. | 0.00 | -100.00 | 0.00 | 0.0000 | |||||
| CACI / CACI International Inc | 0.00 | -100.00 | 0.00 | 0.0000 | |||||
| AEIS / Advanced Energy Industries, Inc. | 0.00 | -100.00 | 0.00 | 0.0000 | |||||
| NEOG / Neogen Corporation | 0.00 | -100.00 | 0.00 | 0.0000 | |||||
| SAIA / Saia, Inc. | 0.00 | -100.00 | 0.00 | 0.0000 | |||||
| NKE / NIKE, Inc. | 0.00 | -100.00 | 0.00 | 0.0000 | |||||
| NCNO / nCino, Inc. | 0.00 | -100.00 | 0.00 | 0.0000 | |||||
| TTC / The Toro Company | 0.00 | -100.00 | 0.00 | 0.0000 | |||||
| AOS / A. O. Smith Corporation | 0.00 | -100.00 | 0.00 | 0.0000 | |||||
| IWR / iShares Trust - iShares Russell Mid-Cap ETF | 0.00 | -100.00 | 0.00 | 0.0000 | |||||
| SPOT / Spotify Technology S.A. | 0.00 | -100.00 | 0.00 | 0.0000 | |||||
| IWM / iShares Trust - iShares Russell 2000 ETF | Put | 0.00 | -100.00 | 0.00 | 0.0000 | ||||
| SSNC / SS&C Technologies Holdings, Inc. | 0.00 | -100.00 | 0.00 | 0.0000 |