Statistik Asas
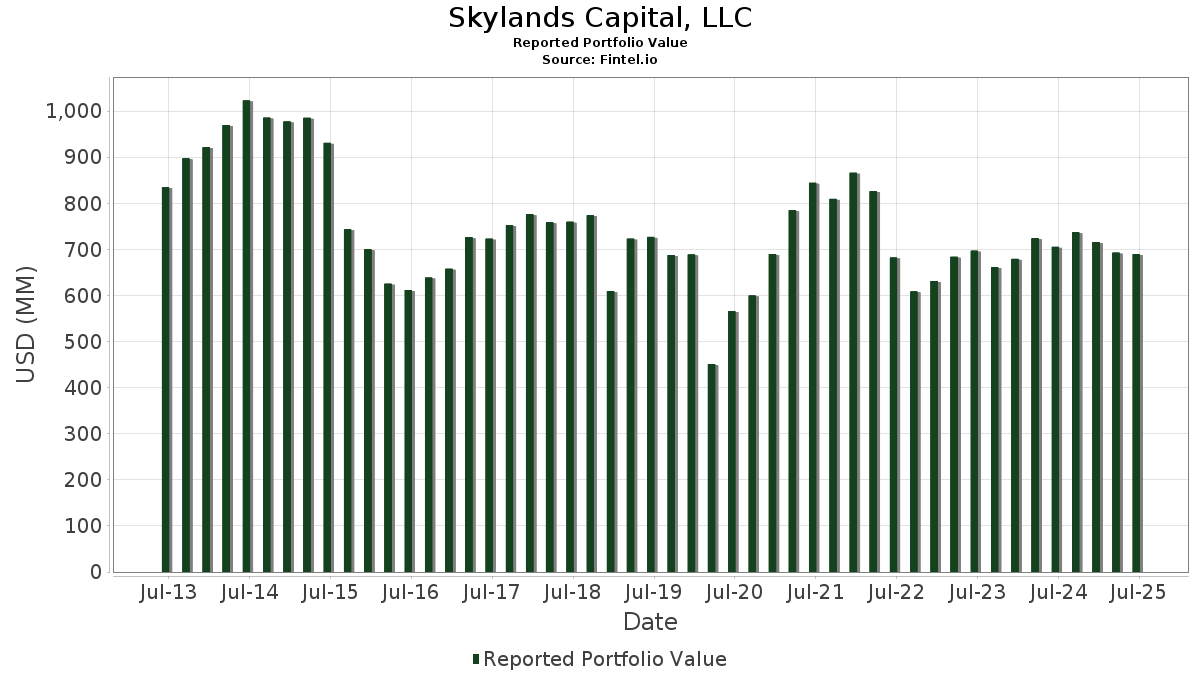
| Nilai Portfolio | $ 689,542,860 |
| Kedudukan Semasa | 152 |
Pegangan Terkini, Prestasi, AUM (dari 13F, 13D)
Skylands Capital, LLC telah mendedahkan 152 jumlah pegangan dalam pemfailan SEC terkini mereka. Nilai portfolio terkini dikira sebagai $ 689,542,860 USD. Aset Sebenar Di Bawah Pengurusan (AUM) ialah nilai ini ditambah dengan tunai (yang tidak didedahkan). Pegangan teratas Skylands Capital, LLC ialah Union Pacific Corporation (US:UNP) , Alphabet Inc. (US:GOOGL) , Diebold Nixdorf, Incorporated (US:DBD) , General Motors Company (US:GM) , and Apple Inc. (US:AAPL) . Kedudukan baharu Skylands Capital, LLC termasuk UnitedHealth Group Incorporated (US:UNH) , Metallus Inc. (US:MTUS) , ICON Public Limited Company (US:ICLR) , Thermo Fisher Scientific Inc. (US:TMO) , and Neogen Corporation (US:NEOG) . Industri teratas Skylands Capital, LLC ialah "Apparel And Other Finished Products Made From Fabrics And Similar Materials" (sic 23) , "Primary Metal Industries" (sic 33) , and "General Merchandise Stores" (sic 53) .
Kenaikan Teratas Suku Tahun Ini
Kami menggunakan perubahan dalam peruntukan portfolio kerana ini adalah metrik yang paling bermakna. Perubahan boleh disebabkan oleh perdagangan atau perubahan dalam harga saham.
| Sekuriti | Saham (MM) |
Nilai (MM$) |
Portfolio % | ΔPortfolio % |
|---|---|---|---|---|
| 0.21 | 37.66 | 5.4623 | 1.3126 | |
| 0.53 | 29.54 | 4.2847 | 0.8096 | |
| 0.17 | 18.77 | 2.7227 | 0.5602 | |
| 0.14 | 12.93 | 1.8753 | 0.5478 | |
| 0.11 | 5.30 | 0.7686 | 0.4380 | |
| 0.01 | 2.41 | 0.3490 | 0.3490 | |
| 0.15 | 2.25 | 0.3264 | 0.3264 | |
| 0.42 | 5.98 | 0.8679 | 0.2812 | |
| 0.14 | 11.91 | 1.7270 | 0.2800 | |
| 0.49 | 7.19 | 1.0433 | 0.2610 |
Penurunan Teratas Suku Tahun Ini
Kami menggunakan perubahan dalam peruntukan portfolio kerana ini adalah metrik yang paling bermakna. Perubahan boleh disebabkan oleh perdagangan atau perubahan dalam harga saham.
| Sekuriti | Saham (MM) |
Nilai (MM$) |
Portfolio % | ΔPortfolio % |
|---|---|---|---|---|
| 0.04 | 8.07 | 1.1698 | -0.4511 | |
| 0.13 | 25.67 | 3.7233 | -0.4302 | |
| 0.04 | 3.11 | 0.4514 | -0.3486 | |
| 0.24 | 16.56 | 2.4010 | -0.2918 | |
| 0.00 | 0.05 | 0.0068 | -0.2750 | |
| 0.05 | 2.55 | 0.3695 | -0.2603 | |
| 0.12 | 2.36 | 0.3428 | -0.2373 | |
| 0.03 | 2.06 | 0.2981 | -0.2136 | |
| 0.01 | 1.34 | 0.1945 | -0.1965 | |
| 0.20 | 4.15 | 0.6013 | -0.1771 |
Pemfailan 13D/G
Ini ialah senarai pemfailan 13D dan 13G yang dibuat pada tahun lepas (jika ada). Klik ikon pautan untuk melihat sejarah transaksi penuh. Baris hijau menunjukkan kedudukan baharu. Baris merah menunjukkan kedudukan tertutup.
| Tarikh Fail | Borang | Sekuriti | Saham Terdahulu |
Saham Semasa |
ΔSaham % | % Pemilikan |
% ΔPemilikan | |
|---|---|---|---|---|---|---|---|---|
| 2025-07-10 | JYNT / The Joint Corp. | 779,295 | 5.10 | |||||
| 2025-04-17 | CTSO / Cytosorbents Corporation | 2,781,622 | 3,002,702 | 7.95 | 4.80 | -5.88 |
13F dan Pemfailan Dana
Borang ini telah difailkan pada 2025-08-08 untuk tempoh pelaporan 2025-06-30. Klik ikon pautan untuk melihat sejarah transaksi penuh.
Tingkatkan untuk membuka data premium dan eksport ke Excel ![]() .
.
| Sekuriti | Jenis | Purata Harga Saham | Saham (MM) |
ΔSaham (%) |
ΔSaham (%) |
Nilai ($MM) |
Portfolio (%) |
ΔPortfolio (%) |
|
|---|---|---|---|---|---|---|---|---|---|
| UNP / Union Pacific Corporation | 0.23 | 1.08 | 52.24 | -1.56 | 7.5760 | -0.0845 | |||
| GOOGL / Alphabet Inc. | 0.21 | 14.98 | 37.66 | 31.03 | 5.4623 | 1.3126 | |||
| DBD / Diebold Nixdorf, Incorporated | 0.53 | -3.14 | 29.54 | 22.73 | 4.2847 | 0.8096 | |||
| GM / General Motors Company | 0.54 | -2.70 | 26.44 | 1.81 | 3.8343 | 0.0855 | |||
| AAPL / Apple Inc. | 0.13 | -3.39 | 25.67 | -10.77 | 3.7233 | -0.4302 | |||
| CCI / Crown Castle Inc. | 0.24 | -2.55 | 24.40 | -3.95 | 3.5389 | -0.1287 | |||
| OSK / Oshkosh Corporation | 0.17 | 3.85 | 18.77 | 25.33 | 2.7227 | 0.5602 | |||
| CNR / Core Natural Resources, Inc. | 0.24 | -1.88 | 16.56 | -11.25 | 2.4010 | -0.2918 | |||
| NSC / Norfolk Southern Corporation | 0.06 | -6.28 | 14.70 | 1.28 | 2.1321 | 0.0367 | |||
| FMC / FMC Corporation | 0.35 | 4.95 | 14.51 | 3.86 | 2.1043 | 0.0874 | |||
| V / Visa Inc. | 0.04 | -1.25 | 14.27 | 0.04 | 2.0697 | 0.0103 | |||
| OC / Owens Corning | 0.10 | 8.84 | 13.54 | 4.81 | 1.9640 | 0.0986 | |||
| COHR / Coherent Corp. | 0.14 | 2.37 | 12.93 | 40.62 | 1.8753 | 0.5478 | |||
| C / Citigroup Inc. | 0.14 | -0.92 | 11.91 | 18.81 | 1.7270 | 0.2800 | |||
| SBAC / SBA Communications Corporation | 0.05 | -14.90 | 11.51 | -9.17 | 1.6686 | -0.1600 | |||
| WAB / Westinghouse Air Brake Technologies Corporation | 0.05 | -3.27 | 11.47 | 11.67 | 1.6638 | 0.1807 | |||
| GEHC / GE HealthCare Technologies Inc. | 0.15 | 26.13 | 11.41 | 15.76 | 1.6552 | 0.2318 | |||
| CSX / CSX Corporation | 0.30 | -6.21 | 9.86 | 3.99 | 1.4295 | 0.0611 | |||
| EXP / Eagle Materials Inc. | 0.05 | 0.63 | 9.65 | -8.36 | 1.3997 | -0.1206 | |||
| JYNT / The Joint Corp. | 0.78 | 3.58 | 8.99 | -4.29 | 1.3042 | -0.0523 | |||
| WMB / The Williams Companies, Inc. | 0.14 | -1.13 | 8.81 | 3.92 | 1.2778 | 0.0538 | |||
| JPM / JPMorgan Chase & Co. | 0.03 | -14.82 | 8.71 | 0.67 | 1.2636 | 0.0141 | |||
| GLD / SPDR Gold Trust | 0.03 | -0.79 | 8.60 | 4.95 | 1.2478 | 0.0644 | |||
| LOPE / Grand Canyon Education, Inc. | 0.04 | -0.42 | 8.11 | 8.78 | 1.1767 | 0.0999 | |||
| AMT / American Tower Corporation | 0.04 | -29.27 | 8.07 | -28.16 | 1.1698 | -0.4511 | |||
| BMY / Bristol-Myers Squibb Company | 0.17 | 16.79 | 7.70 | -11.36 | 1.1168 | -0.1374 | |||
| GOLD / Barrick Mining Corporation | 0.36 | -10.20 | 7.58 | -3.83 | 1.0986 | -0.0385 | |||
| NATR / Nature's Sunshine Products, Inc. | 0.49 | 12.64 | 7.19 | 32.74 | 1.0433 | 0.2610 | |||
| ENS / EnerSys | 0.08 | 19.17 | 7.06 | 11.61 | 1.0236 | 0.1106 | |||
| SSNC / SS&C Technologies Holdings, Inc. | 0.08 | 13.14 | 6.76 | 12.15 | 0.9798 | 0.1101 | |||
| KEX / Kirby Corporation | 0.06 | -5.19 | 6.62 | 6.44 | 0.9605 | 0.0623 | |||
| MTX / Minerals Technologies Inc. | 0.12 | -2.03 | 6.39 | -15.13 | 0.9269 | -0.1602 | |||
| ELAN / Elanco Animal Health Incorporated | 0.43 | -21.18 | 6.19 | 7.20 | 0.8981 | 0.0642 | |||
| ADEA / Adeia Inc. | 0.42 | 37.68 | 5.98 | 47.28 | 0.8679 | 0.2812 | |||
| JOUT / Johnson Outdoors Inc. | 0.19 | -3.29 | 5.74 | 17.83 | 0.8319 | 0.1292 | |||
| GNRC / Generac Holdings Inc. | 0.04 | 7.20 | 5.67 | 21.21 | 0.8221 | 0.1470 | |||
| RTX / RTX Corporation | 0.04 | -15.63 | 5.58 | -7.00 | 0.8096 | -0.0569 | |||
| WSC / WillScot Holdings Corporation | 0.20 | 27.17 | 5.53 | 25.37 | 0.8020 | 0.1651 | |||
| XOP / SPDR Series Trust - SPDR S&P Oil & Gas Exploration & Production ETF | 0.04 | -6.83 | 5.51 | -11.01 | 0.7994 | -0.0948 | |||
| TAP / Molson Coors Beverage Company | 0.11 | 192.92 | 5.30 | 131.40 | 0.7686 | 0.4380 | |||
| CCOI / Cogent Communications Holdings, Inc. | 0.10 | 27.37 | 5.00 | 0.14 | 0.7247 | 0.0045 | |||
| UPS / United Parcel Service, Inc. | 0.05 | -3.39 | 4.89 | -11.33 | 0.7092 | -0.0870 | |||
| TMUS / T-Mobile US, Inc. | 0.02 | 20.19 | 4.86 | 7.36 | 0.7044 | 0.0514 | |||
| META / Meta Platforms, Inc. | 0.01 | -23.54 | 4.79 | -2.10 | 0.6952 | -0.0116 | |||
| OXY / Occidental Petroleum Corporation | 0.11 | -6.31 | 4.64 | -20.28 | 0.6735 | -0.1673 | |||
| MP / MP Materials Corp. | 0.14 | -21.97 | 4.61 | 6.35 | 0.6683 | 0.0428 | |||
| ON / ON Semiconductor Corporation | 0.09 | 2.12 | 4.53 | 31.53 | 0.6576 | 0.1600 | |||
| MLM / Martin Marietta Materials, Inc. | 0.01 | -26.48 | 4.18 | -15.58 | 0.6066 | -0.1088 | |||
| GPK / Graphic Packaging Holding Company | 0.20 | -5.26 | 4.15 | -23.09 | 0.6013 | -0.1771 | |||
| SIMO / Silicon Motion Technology Corporation - Depositary Receipt (Common Stock) | 0.05 | -27.78 | 3.91 | 7.36 | 0.5669 | 0.0414 | |||
| LKQ / LKQ Corporation | 0.10 | 84.72 | 3.66 | 60.75 | 0.5304 | 0.2019 | |||
| PLAB / Photronics, Inc. | 0.19 | -0.55 | 3.55 | -9.80 | 0.5154 | -0.0534 | |||
| LECO / Lincoln Electric Holdings, Inc. | 0.02 | -11.42 | 3.54 | -2.94 | 0.5129 | -0.0130 | |||
| AEM / Agnico Eagle Mines Limited | 0.03 | -17.84 | 3.51 | -9.85 | 0.5097 | -0.0532 | |||
| LOVE / The Lovesac Company | 0.19 | 0.16 | 3.47 | 0.26 | 0.5033 | 0.0036 | |||
| DENN / Denny's Corporation | 0.83 | 11.26 | 3.40 | 24.31 | 0.4933 | 0.0982 | |||
| CTSO / Cytosorbents Corporation | 2.62 | -12.85 | 3.35 | 11.56 | 0.4857 | 0.0523 | |||
| AMZN / Amazon.com, Inc. | 0.01 | -7.04 | 3.19 | 7.20 | 0.4621 | 0.0330 | |||
| XLE / The Select Sector SPDR Trust - The Energy Select Sector SPDR Fund | 0.04 | -38.11 | 3.11 | -43.84 | 0.4514 | -0.3486 | |||
| MATW / Matthews International Corporation | 0.13 | 3.55 | 3.11 | 11.33 | 0.4504 | 0.0477 | |||
| SLB / Schlumberger Limited | 0.09 | 68.74 | 3.03 | 36.46 | 0.4392 | 0.1188 | |||
| BAC / Bank of America Corporation | 0.06 | -7.18 | 3.00 | 5.23 | 0.4346 | 0.0236 | |||
| NEM / Newmont Corporation | 0.05 | -14.44 | 2.93 | 3.24 | 0.4254 | 0.0152 | |||
| HLLY / Holley Inc. | 1.35 | 15.37 | 2.70 | -10.24 | 0.3918 | -0.0426 | |||
| ADM / Archer-Daniels-Midland Company | 0.05 | -46.88 | 2.55 | -41.61 | 0.3695 | -0.2603 | |||
| OSIS / OSI Systems, Inc. | 0.01 | -29.43 | 2.53 | -18.34 | 0.3669 | -0.0804 | |||
| UNH / UnitedHealth Group Incorporated | 0.01 | 2.41 | 0.3490 | 0.3490 | |||||
| QDEL / QuidelOrtho Corporation | 0.08 | -1.25 | 2.39 | -18.62 | 0.3461 | -0.0772 | |||
| HAL / Halliburton Company | 0.12 | -26.77 | 2.36 | -41.16 | 0.3428 | -0.2373 | |||
| VNT / Vontier Corporation | 0.06 | 5.67 | 2.34 | 18.67 | 0.3393 | 0.0547 | |||
| MTUS / Metallus Inc. | 0.15 | 2.25 | 0.3264 | 0.3264 | |||||
| HLMN / Hillman Solutions Corp. | 0.31 | 150.44 | 2.22 | 103.58 | 0.3216 | 0.1642 | |||
| IRDM / Iridium Communications Inc. | 0.07 | -0.41 | 2.21 | 9.99 | 0.3212 | 0.0305 | |||
| ZBH / Zimmer Biomet Holdings, Inc. | 0.02 | 179.53 | 2.18 | 125.26 | 0.3156 | 0.1762 | |||
| HAE / Haemonetics Corporation | 0.03 | -50.61 | 2.06 | -42.01 | 0.2981 | -0.2136 | |||
| FDX / FedEx Corporation | 0.01 | -8.06 | 1.88 | -14.31 | 0.2728 | -0.0439 | |||
| NPKI / NPK International Inc. | 0.22 | -19.52 | 1.86 | 17.88 | 0.2696 | 0.0420 | |||
| WCC / WESCO International, Inc. | 0.01 | -11.02 | 1.74 | 6.09 | 0.2527 | 0.0157 | |||
| HCC / Warrior Met Coal, Inc. | 0.04 | 38.18 | 1.74 | 32.70 | 0.2526 | 0.0631 | |||
| TKR / The Timken Company | 0.02 | 0.00 | 1.73 | 0.93 | 0.2515 | 0.0035 | |||
| ATRO / Astronics Corporation | 0.05 | -20.00 | 1.69 | 10.84 | 0.2447 | 0.0249 | |||
| GOOG / Alphabet Inc. | 0.01 | 0.00 | 1.69 | 13.54 | 0.2444 | 0.0301 | |||
| BOOT / Boot Barn Holdings, Inc. | 0.01 | -6.77 | 1.62 | 31.98 | 0.2353 | 0.0577 | |||
| UHALB / U-Haul Holding Company - Series N | 0.03 | 3.30 | 1.61 | -5.11 | 0.2341 | -0.0114 | |||
| ALGN / Align Technology, Inc. | 0.01 | -0.59 | 1.60 | 18.44 | 0.2320 | 0.0371 | |||
| BLMN / Bloomin' Brands, Inc. | 0.18 | 21.21 | 1.51 | 45.62 | 0.2195 | 0.0694 | |||
| ICLR / ICON Public Limited Company | 0.01 | 1.43 | 0.2078 | 0.2078 | |||||
| TDG / TransDigm Group Incorporated | 0.00 | 0.00 | 1.41 | 9.93 | 0.2040 | 0.0193 | |||
| THRY / Thryv Holdings, Inc. | 0.11 | 47.40 | 1.36 | 40.02 | 0.1974 | 0.0570 | |||
| TMO / Thermo Fisher Scientific Inc. | 0.00 | 1.36 | 0.1970 | 0.1970 | |||||
| HOG / Harley-Davidson, Inc. | 0.06 | 33.22 | 1.36 | 24.59 | 0.1970 | 0.0395 | |||
| KOP / Koppers Holdings Inc. | 0.04 | 15.66 | 1.35 | 32.78 | 0.1963 | 0.0492 | |||
| SCHW / The Charles Schwab Corporation | 0.01 | -57.51 | 1.34 | -50.48 | 0.1945 | -0.1965 | |||
| XPOF / Xponential Fitness, Inc. | 0.18 | 7.54 | 1.32 | -3.36 | 0.1922 | -0.0057 | |||
| BC / Brunswick Corporation | 0.02 | 1.16 | 1.21 | 3.79 | 0.1748 | 0.0071 | |||
| FCG / First Trust Exchange-Traded Fund - First Trust Natural Gas ETF | 0.05 | 8.81 | 1.20 | 1.18 | 0.1739 | 0.0028 | |||
| GBX / The Greenbrier Companies, Inc. | 0.03 | -16.65 | 1.20 | -25.08 | 0.1734 | -0.0569 | |||
| SPWH / Sportsman's Warehouse Holdings, Inc. | 0.33 | -14.32 | 1.14 | 197.90 | 0.1646 | 0.1095 | |||
| NEOG / Neogen Corporation | 0.23 | 1.12 | 0.1628 | 0.1628 | |||||
| CHDN / Churchill Downs Incorporated | 0.01 | 83.47 | 1.12 | 67.06 | 0.1626 | 0.0656 | |||
| GENK / GEN Restaurant Group, Inc. | 0.28 | 6.88 | 1.11 | -24.51 | 0.1609 | -0.0512 | |||
| EXAS / Exact Sciences Corporation | 0.02 | 7.46 | 1.11 | 32.02 | 0.1609 | 0.0395 | |||
| BBY / Best Buy Co., Inc. | 0.02 | 26.88 | 1.08 | 15.68 | 0.1563 | 0.0218 | |||
| SPGI / S&P Global Inc. | 0.00 | 0.00 | 1.02 | 3.76 | 0.1480 | 0.0060 | |||
| ZETA / Zeta Global Holdings Corp. | 0.06 | 0.99 | 0.1433 | 0.1433 | |||||
| CBOE / Cboe Global Markets, Inc. | 0.00 | 0.00 | 0.97 | 2.98 | 0.1404 | 0.0048 | |||
| BIO / Bio-Rad Laboratories, Inc. | 0.00 | 700.00 | 0.97 | 697.52 | 0.1400 | 0.1224 | |||
| MITK / Mitek Systems, Inc. | 0.09 | 0.93 | 0.1348 | 0.1348 | |||||
| DIS / The Walt Disney Company | 0.01 | -43.23 | 0.87 | -28.67 | 0.1263 | -0.0500 | |||
| ASUR / Asure Software, Inc. | 0.09 | -45.76 | 0.87 | -44.59 | 0.1257 | -0.1000 | |||
| DDI / DoubleDown Interactive Co., Ltd. - Depositary Receipt (Common Stock) | 0.09 | 0.85 | 0.1235 | 0.1235 | |||||
| AEYE / AudioEye, Inc. | 0.07 | -16.26 | 0.79 | -12.19 | 0.1140 | -0.0151 | |||
| XOM / Exxon Mobil Corporation | 0.01 | -22.52 | 0.75 | -29.84 | 0.1089 | -0.0455 | |||
| SLP / Simulations Plus, Inc. | 0.04 | 0.74 | 0.1078 | 0.1078 | |||||
| RJF / Raymond James Financial, Inc. | 0.00 | 0.00 | 0.73 | 10.42 | 0.1061 | 0.0105 | |||
| C.WSA / Citigroup, Inc. | 0.00 | -21.21 | 0.68 | -12.56 | 0.0989 | -0.0138 | |||
| MA / Mastercard Incorporated | 0.00 | -0.43 | 0.65 | 2.04 | 0.0945 | 0.0024 | |||
| VLO / Valero Energy Corporation | 0.00 | -66.67 | 0.44 | -66.11 | 0.0643 | -0.1244 | |||
| BRK.B / Berkshire Hathaway Inc. | 0.00 | -28.00 | 0.44 | -34.29 | 0.0634 | -0.0327 | |||
| MBLY / Mobileye Global Inc. | 0.02 | -16.81 | 0.44 | 4.06 | 0.0632 | 0.0026 | |||
| OSBC / Old Second Bancorp, Inc. | 0.02 | 0.43 | 0.0620 | 0.0620 | |||||
| QRHC / Quest Resource Holding Corporation | 0.21 | 0.00 | 0.42 | -22.26 | 0.0608 | -0.0171 | |||
| MHK / Mohawk Industries, Inc. | 0.00 | 0.41 | 0.0601 | 0.0601 | |||||
| QQQ / Invesco QQQ Trust, Series 1 | 0.00 | 0.00 | 0.41 | 17.66 | 0.0600 | 0.0092 | |||
| GATX / GATX Corporation | 0.00 | 0.00 | 0.38 | -1.03 | 0.0556 | -0.0004 | |||
| QXO / QXO, Inc. | 0.02 | 0.38 | 0.0547 | 0.0547 | |||||
| MSFT / Microsoft Corporation | 0.00 | 0.00 | 0.35 | 32.69 | 0.0501 | 0.0125 | |||
| TWIN / Twin Disc, Incorporated | 0.04 | 31.31 | 0.34 | 53.57 | 0.0499 | 0.0175 | |||
| ASPN / Aspen Aerogels, Inc. | 0.05 | 0.00 | 0.32 | -7.43 | 0.0470 | -0.0035 | |||
| CRWS / Crown Crafts, Inc. | 0.10 | -32.71 | 0.30 | -46.94 | 0.0428 | -0.0375 | |||
| CCJ / Cameco Corporation | 0.00 | -81.34 | 0.29 | -66.40 | 0.0420 | -0.0822 | |||
| GEV / GE Vernova Inc. | 0.00 | 0.00 | 0.26 | 73.68 | 0.0384 | 0.0163 | |||
| CCK / Crown Holdings, Inc. | 0.00 | 0.00 | 0.25 | 15.42 | 0.0358 | 0.0049 | |||
| LAKE / Lakeland Industries, Inc. | 0.02 | 0.23 | 0.0339 | 0.0339 | |||||
| BWXT / BWX Technologies, Inc. | 0.00 | -79.74 | 0.22 | -70.42 | 0.0324 | -0.0766 | |||
| GD / General Dynamics Corporation | 0.00 | 0.00 | 0.21 | 7.11 | 0.0307 | 0.0021 | |||
| TSLA / Tesla, Inc. | 0.00 | 0.21 | 0.0304 | 0.0304 | |||||
| MCD / McDonald's Corporation | 0.00 | 0.00 | 0.19 | -6.90 | 0.0275 | -0.0018 | |||
| ACCO / ACCO Brands Corporation | 0.04 | 17.56 | 0.15 | 0.69 | 0.0212 | 0.0002 | |||
| SHW / The Sherwin-Williams Company | 0.00 | 0.00 | 0.14 | -1.44 | 0.0199 | -0.0002 | |||
| UHAL / U-Haul Holding Company | 0.00 | 0.00 | 0.12 | -7.52 | 0.0180 | -0.0013 | |||
| SW / Smurfit Westrock Plc | 0.00 | 0.00 | 0.12 | -4.65 | 0.0179 | -0.0007 | |||
| NDSN / Nordson Corporation | 0.00 | 0.00 | 0.12 | 7.08 | 0.0176 | 0.0011 | |||
| GAUZ / Gauzy Ltd. | 0.01 | -62.81 | 0.12 | -60.86 | 0.0173 | -0.0266 | |||
| IWM / iShares Trust - iShares Russell 2000 ETF | 0.00 | 0.00 | 0.09 | 8.86 | 0.0125 | 0.0010 | |||
| SPY / SPDR S&P 500 ETF | 0.00 | 0.00 | 0.06 | 10.91 | 0.0090 | 0.0009 | |||
| OKLO / Oklo Inc. | 0.00 | 0.06 | 0.0081 | 0.0081 | |||||
| ULTA / Ulta Beauty, Inc. | 0.00 | -98.12 | 0.05 | -97.64 | 0.0068 | -0.2750 | |||
| TGT / Target Corporation | 0.00 | 0.00 | 0.04 | -4.88 | 0.0057 | -0.0003 | |||
| HD / The Home Depot, Inc. | 0.00 | 0.00 | 0.04 | 0.00 | 0.0053 | 0.0000 | |||
| CWST / Casella Waste Systems, Inc. | 0.00 | 0.00 | 0.03 | 3.33 | 0.0046 | 0.0002 | |||
| MSAI / MultiSensor AI Holdings, Inc. | 0.03 | -65.52 | 0.02 | -78.95 | 0.0025 | -0.0086 | |||
| GSCE / GS Connect S&P GSCI Enhanced Commodity Total Return ETN | 0.00 | -100.00 | 0.00 | 0.0000 | |||||
| ECG / Everus Construction Group, Inc. | 0.00 | -100.00 | 0.00 | 0.0000 | |||||
| BECN / Beacon Roofing Supply, Inc. | 0.00 | -100.00 | 0.00 | 0.0000 | |||||
| CMCO / Columbus McKinnon Corporation | 0.00 | -100.00 | 0.00 | 0.0000 | |||||
| MU / Micron Technology, Inc. | 0.00 | -100.00 | 0.00 | 0.0000 | |||||
| PCYO / Pure Cycle Corporation | 0.00 | -100.00 | 0.00 | 0.0000 | |||||
| CMP / Compass Minerals International, Inc. | 0.00 | -100.00 | 0.00 | 0.0000 | |||||
| GBCI / Glacier Bancorp, Inc. | 0.00 | -100.00 | 0.00 | 0.0000 | |||||
| CLFD / Clearfield, Inc. | 0.00 | -100.00 | 0.00 | 0.0000 | |||||
| TRGP / Targa Resources Corp. | 0.00 | -100.00 | 0.00 | 0.0000 | |||||
| BTMD / biote Corp. | 0.00 | -100.00 | 0.00 | 0.0000 | |||||
| TTI / TETRA Technologies, Inc. | 0.00 | -100.00 | 0.00 | 0.0000 | |||||
| PTEN / Patterson-UTI Energy, Inc. | 0.00 | -100.00 | 0.00 | 0.0000 | |||||
| EYE / National Vision Holdings, Inc. | 0.00 | -100.00 | 0.00 | 0.0000 | |||||
| MOD / Modine Manufacturing Company | 0.00 | -100.00 | 0.00 | 0.0000 | |||||
| HOOD / Robinhood Markets, Inc. | 0.00 | -100.00 | 0.00 | 0.0000 |