Statistik Asas
| Profil Orang Dalam | TCW GROUP INC |
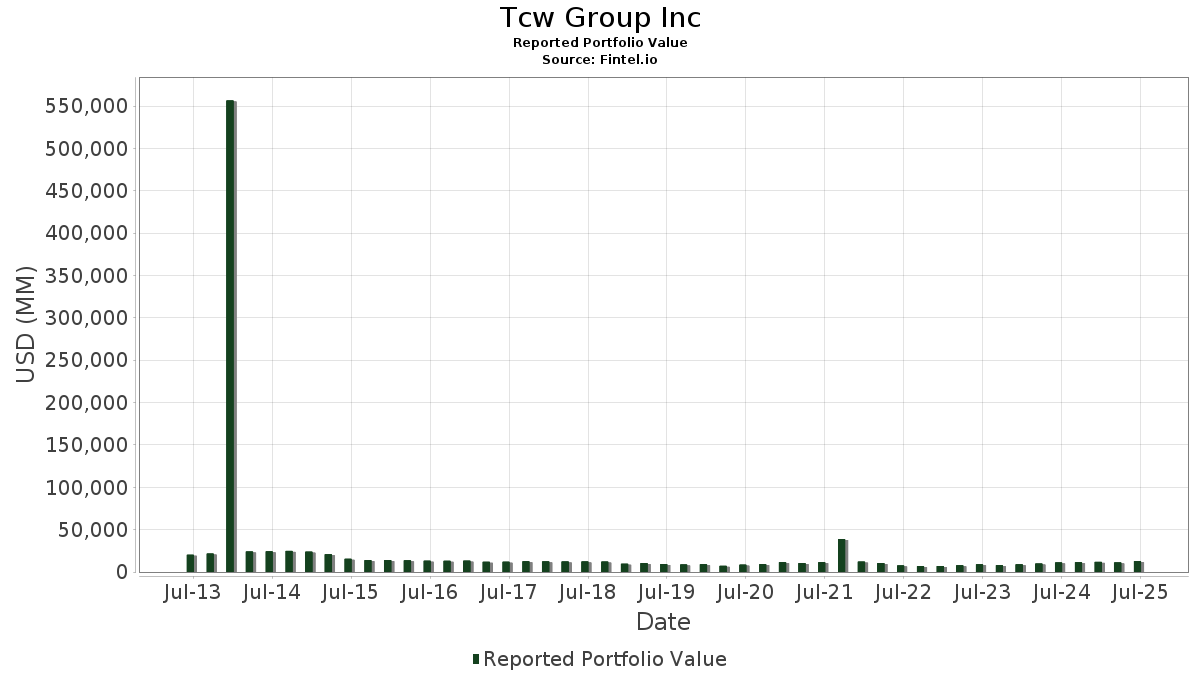
| Nilai Portfolio | $ 12,763,726,448 |
| Kedudukan Semasa | 354 |
Pegangan Terkini, Prestasi, AUM (dari 13F, 13D)
Tcw Group Inc telah mendedahkan 354 jumlah pegangan dalam pemfailan SEC terkini mereka. Nilai portfolio terkini dikira sebagai $ 12,763,726,448 USD. Aset Sebenar Di Bawah Pengurusan (AUM) ialah nilai ini ditambah dengan tunai (yang tidak didedahkan). Pegangan teratas Tcw Group Inc ialah NVIDIA Corporation (US:NVDA) , Microsoft Corporation (US:MSFT) , Amazon.com, Inc. (US:AMZN) , Broadcom Inc. (US:AVGO) , and Alphabet Inc. (US:GOOG) . Kedudukan baharu Tcw Group Inc termasuk Mirion Technologies, Inc. (US:MIR) , Cameco Corporation (US:CCJ) , Accuray Incorporated (US:ARAY) , Photronics, Inc. (US:PLAB) , and Robinhood Markets, Inc. (US:HOOD) . Industri teratas Tcw Group Inc ialah "Mining And Quarrying Of Nonmetallic Minerals, Except Fuels" (sic 14) , "Construction Special Trade Contractors" (sic 17) , and "Lumber And Wood Products, Except Furniture" (sic 24) .
Kenaikan Teratas Suku Tahun Ini
Kami menggunakan perubahan dalam peruntukan portfolio kerana ini adalah metrik yang paling bermakna. Perubahan boleh disebabkan oleh perdagangan atau perubahan dalam harga saham.
| Sekuriti | Saham (MM) |
Nilai (MM$) |
Portfolio % | ΔPortfolio % |
|---|---|---|---|---|
| 0.37 | 35.32 | 0.1395 | 0.1260 | |
| 0.73 | 15.75 | 0.1234 | 0.1234 | |
| 0.21 | 15.49 | 0.1214 | 0.1214 | |
| 0.77 | 67.68 | 0.5303 | 0.1047 | |
| 0.98 | 38.56 | 0.1523 | 0.0878 | |
| 11.91 | 10.73 | 0.0840 | 0.0840 | |
| 0.34 | 49.44 | 0.3874 | 0.0750 | |
| 0.05 | 40.61 | 0.1604 | 0.0492 | |
| 0.47 | 21.93 | 0.0866 | 0.0469 | |
| 0.01 | 8.64 | 0.0341 | 0.0341 |
Penurunan Teratas Suku Tahun Ini
Kami menggunakan perubahan dalam peruntukan portfolio kerana ini adalah metrik yang paling bermakna. Perubahan boleh disebabkan oleh perdagangan atau perubahan dalam harga saham.
| Sekuriti | Saham (MM) |
Nilai (MM$) |
Portfolio % | ΔPortfolio % |
|---|---|---|---|---|
| 6.75 | 1,065.74 | 4.2091 | -2.3735 | |
| 1.60 | 793.43 | 3.1337 | -2.2028 | |
| 2.36 | 517.97 | 2.0457 | -1.9883 | |
| 2.32 | 410.96 | 1.6231 | -1.4650 | |
| 0.55 | 408.73 | 1.6143 | -1.4404 | |
| 0.70 | 247.78 | 0.9786 | -1.2175 | |
| 0.38 | 394.31 | 1.5573 | -1.1891 | |
| 0.14 | 43.13 | 0.1704 | -1.1281 | |
| 0.95 | 244.08 | 0.9640 | -1.0230 | |
| 0.38 | 211.33 | 0.8347 | -0.9939 |
Pemfailan 13D/G
Ini ialah senarai pemfailan 13D dan 13G yang dibuat pada tahun lepas (jika ada). Klik ikon pautan untuk melihat sejarah transaksi penuh. Baris hijau menunjukkan kedudukan baharu. Baris merah menunjukkan kedudukan tertutup.
| Tarikh Fail | Borang | Sekuriti | Saham Terdahulu |
Saham Semasa |
ΔSaham % | % Pemilikan |
% ΔPemilikan | |
|---|---|---|---|---|---|---|---|---|
| 2025-06-17 | ARAY / Accuray Incorporated | 11,909,357 | 10.30 | |||||
| 2025-05-01 | SGMA / SigmaTron International, Inc. | 770,250 | 11.18 | |||||
| 2024-10-11 | RGS / Regis Corporation | 349,322 | 13.29 |
13F dan Pemfailan Dana
Borang ini telah difailkan pada 2025-08-14 untuk tempoh pelaporan 2025-06-30. Klik ikon pautan untuk melihat sejarah transaksi penuh.
Tingkatkan untuk membuka data premium dan eksport ke Excel ![]() .
.
| Sekuriti | Jenis | Purata Harga Saham | Saham (MM) |
ΔSaham (%) |
ΔSaham (%) |
Nilai ($MM) |
Portfolio (%) |
ΔPortfolio (%) |
|
|---|---|---|---|---|---|---|---|---|---|
| NVDA / NVIDIA Corporation | 6.75 | -0.61 | 1,065.74 | 44.88 | 4.2091 | -2.3735 | |||
| MSFT / Microsoft Corporation | 1.60 | 0.41 | 793.43 | 33.05 | 3.1337 | -2.2028 | |||
| AMZN / Amazon.com, Inc. | 2.36 | -0.36 | 517.97 | 14.90 | 2.0457 | -1.9883 | |||
| AVGO / Broadcom Inc. | 1.55 | 0.49 | 427.43 | 65.44 | 1.6881 | -0.6238 | |||
| GOOG / Alphabet Inc. | 2.32 | 4.88 | 410.96 | 19.09 | 1.6231 | -1.4650 | |||
| META / Meta Platforms, Inc. | 0.55 | -6.50 | 408.73 | 19.74 | 1.6143 | -1.4404 | |||
| NOW / ServiceNow, Inc. | 0.38 | -0.51 | 394.31 | 28.48 | 1.5573 | -1.1891 | |||
| ACLO / TCW ETF Trust - TCW AAA CLO ETF | 5.44 | 25.36 | 273.90 | 25.54 | 1.0818 | -0.8707 | |||
| V / Visa Inc. | 0.70 | -0.34 | 247.78 | 0.96 | 0.9786 | -1.2175 | |||
| GE / General Electric Company | 0.95 | -14.52 | 244.08 | 9.92 | 0.9640 | -1.0230 | |||
| MA / Mastercard Incorporated | 0.38 | 0.88 | 211.33 | 3.42 | 0.8347 | -0.9939 | |||
| PANW / Palo Alto Networks, Inc. | 1.00 | -0.12 | 204.28 | 19.78 | 0.8068 | -0.7193 | |||
| SLNZ / TCW ETF Trust - TCW Senior Loan ETF | 4.34 | 12.79 | 203.82 | 12.18 | 0.8050 | -0.8209 | |||
| CRWD / CrowdStrike Holdings, Inc. | 0.39 | -3.89 | 196.38 | 38.83 | 0.7756 | -0.4902 | |||
| COST / Costco Wholesale Corporation | 0.19 | 0.05 | 190.35 | 4.72 | 0.7518 | -0.8747 | |||
| IBM / International Business Machines Corporation | 0.59 | -6.01 | 174.16 | 11.42 | 0.6878 | -0.7109 | |||
| SPGI / S&P Global Inc. | 0.32 | -0.60 | 170.43 | 3.16 | 0.6731 | -0.8054 | |||
| ISRG / Intuitive Surgical, Inc. | 0.28 | -0.20 | 154.48 | 9.50 | 0.6101 | -0.6523 | |||
| BSX / Boston Scientific Corporation | 1.39 | 0.13 | 149.27 | 6.61 | 0.5895 | -0.6634 | |||
| CDNS / Cadence Design Systems, Inc. | 0.47 | -1.08 | 145.95 | 19.85 | 0.5764 | -0.5133 | |||
| ASML / ASML Holding N.V. - Depositary Receipt (Common Stock) | 0.18 | -0.08 | 145.82 | 20.85 | 0.5759 | -0.5038 | |||
| JPM / JPMorgan Chase & Co. | 0.49 | -2.04 | 143.02 | 15.77 | 0.5649 | -0.5406 | |||
| SHOP / Shopify Inc. | 1.23 | -0.19 | 142.02 | 20.71 | 0.5609 | -0.4919 | |||
| ORLY / O'Reilly Automotive, Inc. | 1.49 | 1,394.43 | 133.91 | -5.98 | 1.0492 | -0.2254 | |||
| WCN / Waste Connections, Inc. | 0.68 | 1.66 | 127.26 | -2.75 | 0.5026 | -0.6684 | |||
| ICE / Intercontinental Exchange, Inc. | 0.69 | 1.02 | 126.22 | 7.45 | 0.4985 | -0.5527 | |||
| TYL / Tyler Technologies, Inc. | 0.20 | 29.43 | 117.22 | 31.98 | 0.4630 | -0.3319 | |||
| AAPL / Apple Inc. | 0.56 | -4.08 | 114.23 | -11.40 | 0.4511 | -0.7025 | |||
| FI / Fiserv, Inc. | 0.66 | -3.07 | 112.94 | -24.32 | 0.4461 | -0.8894 | |||
| MCK / McKesson Corporation | 0.15 | -3.29 | 109.84 | 5.30 | 0.4338 | -0.4997 | |||
| TTD / The Trade Desk, Inc. | 1.43 | -0.75 | 102.81 | 30.58 | 0.4061 | -0.2985 | |||
| DIS / The Walt Disney Company | 0.78 | -5.50 | 96.62 | 18.73 | 0.3816 | -0.3466 | |||
| JCI / Johnson Controls International plc | 0.88 | 2.04 | 93.42 | 34.53 | 0.3690 | -0.2525 | |||
| BK / The Bank of New York Mellon Corporation | 1.02 | 1.12 | 93.10 | 9.84 | 0.3677 | -0.3908 | |||
| MS / Morgan Stanley | 0.64 | 0.20 | 90.42 | 20.98 | 0.3571 | -0.3117 | |||
| IT / Gartner, Inc. | 0.22 | 0.45 | 87.83 | -3.26 | 0.3469 | -0.4656 | |||
| DXCM / DexCom, Inc. | 1.00 | 6.64 | 87.27 | 36.31 | 0.3447 | -0.2282 | |||
| GEV / GE Vernova Inc. | 0.16 | -10.02 | 82.74 | 55.97 | 0.3268 | -0.1479 | |||
| ZTS / Zoetis Inc. | 0.52 | -2.61 | 81.82 | -7.76 | 0.3232 | -0.4706 | |||
| CRM / Salesforce, Inc. | 0.30 | -2.16 | 80.47 | -0.58 | 0.3178 | -0.4065 | |||
| VRT / Vertiv Holdings Co | 0.62 | 1.26 | 80.14 | 80.10 | 0.3165 | -0.0817 | |||
| SPY / SPDR S&P 500 ETF | 0.12 | 0.22 | 76.62 | 10.70 | 0.3026 | -0.3168 | |||
| ABBV / AbbVie Inc. | 0.40 | -4.19 | 74.47 | -15.12 | 0.2941 | -0.4910 | |||
| JLL / Jones Lang LaSalle Incorporated | 0.28 | 4.97 | 70.75 | 8.30 | 0.2794 | -0.3051 | |||
| XOM / Exxon Mobil Corporation | 0.64 | -14.02 | 68.97 | -22.07 | 0.2724 | -0.5196 | |||
| NI / NiSource Inc. | 1.68 | -4.09 | 67.86 | -3.50 | 0.2680 | -0.3612 | |||
| TPR / Tapestry, Inc. | 0.77 | 14.13 | 67.68 | 42.33 | 0.5303 | 0.1047 | |||
| TXN / Texas Instruments Incorporated | 0.32 | 36.41 | 66.81 | 57.60 | 0.2639 | -0.1155 | |||
| GM / General Motors Company | 1.35 | 0.38 | 66.25 | 5.03 | 0.2616 | -0.3028 | |||
| T / AT&T Inc. | 2.26 | -0.39 | 65.47 | 1.93 | 0.2586 | -0.3162 | |||
| ADBE / Adobe Inc. | 0.17 | -17.17 | 64.60 | -16.44 | 0.2551 | -0.4367 | |||
| SPG / Simon Property Group, Inc. | 0.40 | 1.32 | 64.45 | -1.93 | 0.2546 | -0.3335 | |||
| ANET / Arista Networks Inc | 0.63 | -7.43 | 64.15 | 22.23 | 0.2533 | -0.2163 | |||
| FLEX / Flex Ltd. | 1.27 | -25.37 | 63.35 | 12.62 | 0.2502 | -0.2532 | |||
| AMP / Ameriprise Financial, Inc. | 0.12 | -3.24 | 62.38 | 6.67 | 0.2464 | -0.2769 | |||
| MET / MetLife, Inc. | 0.77 | 3.81 | 61.79 | 3.98 | 0.2441 | -0.2877 | |||
| BKR / Baker Hughes Company | 1.54 | -8.43 | 59.15 | -20.12 | 0.2336 | -0.4290 | |||
| PEP / PepsiCo, Inc. | 0.44 | -9.98 | 57.73 | -20.73 | 0.2280 | -0.4237 | |||
| GOOGL / Alphabet Inc. | 0.32 | -22.36 | 56.30 | -11.52 | 0.2224 | -0.3471 | |||
| TSLA / Tesla, Inc. | 0.17 | -9.96 | 55.59 | 10.36 | 0.4355 | -0.0152 | |||
| GEHC / GE HealthCare Technologies Inc. | 0.74 | 10.12 | 55.01 | 1.06 | 0.2172 | -0.2698 | |||
| LEN / Lennar Corporation | 0.49 | -10.93 | 54.66 | -14.17 | 0.2159 | -0.3540 | |||
| APO / Apollo Global Management, Inc. | 0.38 | 1.28 | 54.40 | 4.92 | 0.2148 | -0.2491 | |||
| MRVL / Marvell Technology, Inc. | 0.70 | 20.31 | 54.37 | 51.24 | 0.2147 | -0.1070 | |||
| AMGN / Amgen Inc. | 0.19 | -13.04 | 53.84 | -22.07 | 0.2126 | -0.4056 | |||
| PG / The Procter & Gamble Company | 0.33 | 8.71 | 51.89 | 1.63 | 0.2049 | -0.2519 | |||
| STX / Seagate Technology Holdings plc | 0.34 | -16.62 | 49.44 | 41.66 | 0.3874 | 0.0750 | |||
| WFC / Wells Fargo & Company | 0.61 | 3.92 | 48.83 | 15.97 | 0.1928 | -0.1839 | |||
| XYL / Xylem Inc. | 0.37 | 6.63 | 47.89 | 15.46 | 0.1892 | -0.1820 | |||
| CMCSA / Comcast Corporation | 1.33 | -3.88 | 47.36 | -7.03 | 0.1871 | -0.2688 | |||
| HEI / HEICO Corporation | 0.14 | -0.27 | 46.02 | 22.43 | 0.1818 | -0.1546 | |||
| CYBR / CyberArk Software Ltd. | 0.11 | -0.34 | 45.73 | 19.97 | 0.1806 | -0.1605 | |||
| VST / Vistra Corp. | 0.23 | 43.43 | 45.13 | 136.69 | 0.1782 | 0.0076 | |||
| INTC / Intel Corporation | 1.97 | 57.14 | 44.04 | 54.99 | 0.1739 | -0.0803 | |||
| UNH / UnitedHealth Group Incorporated | 0.14 | -50.09 | 43.13 | -70.27 | 0.1704 | -1.1281 | |||
| RSG / Republic Services, Inc. | 0.17 | -7.56 | 40.85 | -5.86 | 0.1613 | -0.2270 | |||
| SPOT / Spotify Technology S.A. | 0.05 | 134.26 | 40.61 | 226.83 | 0.1604 | 0.0492 | |||
| MSI / Motorola Solutions, Inc. | 0.10 | 0.68 | 40.44 | -3.31 | 0.1597 | -0.2146 | |||
| FLXR / TCW ETF Trust - TCW Flexible Income ETF | 0.98 | 431.49 | 38.56 | 435.30 | 0.1523 | 0.0878 | |||
| EQH / Equitable Holdings, Inc. | 0.66 | 119.18 | 37.03 | 136.07 | 0.1462 | 0.0059 | |||
| DD / DuPont de Nemours, Inc. | 0.54 | -19.18 | 36.87 | -25.77 | 0.1456 | -0.2989 | |||
| TSM / Taiwan Semiconductor Manufacturing Company Limited - Depositary Receipt (Common Stock) | 0.16 | -1.91 | 36.06 | 33.84 | 0.1424 | -0.0987 | |||
| NTAP / NetApp, Inc. | 0.33 | -18.78 | 35.52 | -1.48 | 0.1403 | -0.1824 | |||
| LITE / Lumentum Holdings Inc. | 0.37 | 1,438.74 | 35.32 | 2,246.98 | 0.1395 | 0.1260 | |||
| TDG / TransDigm Group Incorporated | 0.02 | 5.81 | 35.32 | 16.32 | 0.1395 | -0.1322 | |||
| MDT / Medtronic plc | 0.40 | 115.21 | 34.44 | 108.76 | 0.1360 | -0.0116 | |||
| ORCL / Oracle Corporation | 0.14 | 41.90 | 29.88 | 121.90 | 0.1180 | -0.0025 | |||
| TXT / Textron Inc. | 0.37 | 3.52 | 29.75 | 15.04 | 0.1175 | -0.1139 | |||
| GRW / TCW ETF Trust - TCW Compounders ETF | 0.83 | 7.62 | 28.98 | 13.77 | 0.1144 | -0.1135 | |||
| ETN / Eaton Corporation plc | 0.08 | -1.48 | 28.89 | 29.39 | 0.1141 | -0.0857 | |||
| FCX / Freeport-McMoRan Inc. | 0.63 | -4.94 | 27.19 | 8.84 | 0.1074 | -0.1161 | |||
| TT / Trane Technologies plc | 0.06 | -12.78 | 26.61 | 13.23 | 0.1051 | -0.1052 | |||
| APH / Amphenol Corporation | 0.27 | 0.14 | 26.45 | 50.77 | 0.1044 | -0.0525 | |||
| LIN / Linde plc | 0.06 | 2.07 | 25.98 | 2.85 | 0.1026 | -0.1234 | |||
| GLDD / Great Lakes Dredge & Dock Corporation | 2.09 | -3.15 | 25.43 | 35.71 | 0.1004 | -0.0672 | |||
| DDOG / Datadog, Inc. | 0.19 | -0.41 | 25.19 | 34.84 | 0.0995 | -0.0677 | |||
| DKS / DICK'S Sporting Goods, Inc. | 0.12 | -50.16 | 24.61 | -51.09 | 0.0972 | -0.3531 | |||
| TLN / Talen Energy Corporation | 0.08 | 79.32 | 24.20 | 161.14 | 0.0956 | 0.0127 | |||
| SYM / Symbotic Inc. | 0.61 | 2.14 | 23.55 | 96.36 | 0.0930 | -0.0143 | |||
| BBY / Best Buy Co., Inc. | 0.35 | -17.35 | 23.40 | -24.63 | 0.0924 | -0.1854 | |||
| MU / Micron Technology, Inc. | 0.19 | -57.80 | 22.91 | -40.15 | 0.0905 | -0.2520 | |||
| UPS / United Parcel Service, Inc. | 0.22 | -27.20 | 22.56 | -33.19 | 0.0891 | -0.2130 | |||
| FTI / TechnipFMC plc | 0.64 | 35.99 | 22.18 | 47.79 | 0.0876 | -0.0467 | |||
| IGCB / TCW ETF Trust - TCW Corporate Bond ETF | 0.47 | 387.95 | 21.93 | 393.79 | 0.0866 | 0.0469 | |||
| TDS / Telephone and Data Systems, Inc. | 0.60 | 4.56 | 21.29 | -3.97 | 0.0841 | -0.1143 | |||
| CVEO / Civeo Corporation | 0.83 | 4.40 | 19.18 | 4.81 | 0.0758 | -0.0880 | |||
| CGNX / Cognex Corporation | 0.60 | -0.32 | 18.93 | 6.00 | 0.0748 | -0.0850 | |||
| MRK / Merck & Co., Inc. | 0.24 | 8.31 | 18.88 | -4.49 | 0.0746 | -0.1023 | |||
| LLY / Eli Lilly and Company | 0.02 | 60.52 | 17.77 | 51.51 | 0.0702 | -0.0348 | |||
| CP / Canadian Pacific Kansas City Limited | 0.22 | 14.44 | 17.44 | 29.21 | 0.0689 | -0.0519 | |||
| DE / Deere & Company | 0.03 | -0.08 | 17.34 | 8.25 | 0.0685 | -0.0749 | |||
| C / Citigroup Inc. | 0.20 | -20.33 | 17.07 | -4.47 | 0.0674 | -0.0925 | |||
| FYBR / Frontier Communications Parent, Inc. | 0.46 | 0.00 | 16.88 | 1.50 | 0.0667 | -0.0821 | |||
| AME / AMETEK, Inc. | 0.09 | -6.56 | 16.34 | -1.77 | 0.0645 | -0.0843 | |||
| MIR / Mirion Technologies, Inc. | 0.73 | 15.75 | 0.1234 | 0.1234 | |||||
| MUSE / TCW ETF Trust - TCW Multisector Credit Income ETF | 0.31 | 53.85 | 15.50 | 54.72 | 0.0612 | -0.0284 | |||
| CCJ / Cameco Corporation | 0.21 | 15.49 | 0.1214 | 0.1214 | |||||
| MBB / iShares Trust - iShares MBS ETF | 0.16 | 0.61 | 14.98 | 0.72 | 0.0592 | -0.0739 | |||
| UNP / Union Pacific Corporation | 0.06 | -13.62 | 14.59 | -15.88 | 0.0576 | -0.0976 | |||
| AMT / American Tower Corporation | 0.07 | 1.57 | 14.53 | 3.16 | 0.0574 | -0.0687 | |||
| KKR / KKR & Co. Inc. | 0.10 | -69.65 | 13.91 | -65.08 | 0.0549 | -0.3014 | |||
| BRK.B / Berkshire Hathaway Inc. | 0.03 | 4.33 | 13.54 | -4.84 | 0.0535 | -0.0738 | |||
| WELL / Welltower Inc. | 0.09 | -8.06 | 13.43 | -7.74 | 0.0530 | -0.0772 | |||
| GRAL / GRAIL, Inc. | 0.25 | -2.64 | 12.90 | 96.02 | 0.0509 | -0.0079 | |||
| CVX / Chevron Corporation | 0.09 | -45.02 | 12.59 | -52.94 | 0.0497 | -0.1898 | |||
| SRE / Sempra | 0.16 | -2.46 | 12.00 | 3.57 | 0.0474 | -0.0563 | |||
| GRMN / Garmin Ltd. | 0.05 | 13.39 | 11.21 | 9.01 | 0.0443 | -0.0478 | |||
| ARAY / Accuray Incorporated | 11.91 | 10.73 | 0.0840 | 0.0840 | |||||
| EBAY / eBay Inc. | 0.14 | 16.23 | 10.71 | 27.78 | 0.0423 | -0.0327 | |||
| CBRE / CBRE Group, Inc. | 0.07 | -2.43 | 10.48 | 4.54 | 0.0414 | -0.0483 | |||
| HLT / Hilton Worldwide Holdings Inc. | 0.04 | 7.81 | 10.00 | 26.19 | 0.0395 | -0.0314 | |||
| TDY / Teledyne Technologies Incorporated | 0.02 | 0.08 | 9.47 | 3.02 | 0.0374 | -0.0449 | |||
| DLR / Digital Realty Trust, Inc. | 0.05 | 0.31 | 9.47 | 22.03 | 0.0374 | -0.0320 | |||
| FSLR / First Solar, Inc. | 0.05 | 297.71 | 9.01 | 420.98 | 0.0356 | 0.0201 | |||
| LUV / Southwest Airlines Co. | 0.27 | -1.75 | 8.82 | -5.08 | 0.0348 | -0.0483 | |||
| TOL / Toll Brothers, Inc. | 0.08 | -1.03 | 8.70 | 6.99 | 0.0344 | -0.0384 | |||
| EQIX / Equinix, Inc. | 0.01 | 8.64 | 0.0341 | 0.0341 | |||||
| MSCI / MSCI Inc. | 0.01 | 15.90 | 8.63 | 18.21 | 0.0341 | -0.0313 | |||
| STNG / Scorpio Tankers Inc. | 0.21 | 10.26 | 8.32 | 14.82 | 0.0329 | -0.0320 | |||
| BPOP / Popular, Inc. | 0.07 | -1.29 | 8.10 | 17.77 | 0.0320 | -0.0296 | |||
| FAST / Fastenal Company | 0.19 | 100.38 | 7.96 | 8.52 | 0.0314 | -0.0342 | |||
| AGNC / AGNC Investment Corp. | 0.86 | 0.00 | 7.91 | -4.07 | 0.0313 | -0.0426 | |||
| ROP / Roper Technologies, Inc. | 0.01 | 13.95 | 7.91 | 9.56 | 0.0312 | -0.0334 | |||
| ADSK / Autodesk, Inc. | 0.03 | 0.13 | 7.80 | 18.41 | 0.0308 | -0.0282 | |||
| IWF / iShares Trust - iShares Russell 1000 Growth ETF | 0.02 | 7.77 | 0.0307 | 0.0307 | |||||
| ASTL / Algoma Steel Group Inc. | 1.12 | -20.52 | 7.71 | 1.04 | 0.0305 | -0.0378 | |||
| CHRD / Chord Energy Corporation | 0.08 | 26.07 | 7.70 | 8.31 | 0.0304 | -0.0332 | |||
| PLD / Prologis, Inc. | 0.07 | 0.16 | 7.42 | -5.81 | 0.0293 | -0.0412 | |||
| MBLY / Mobileye Global Inc. | 0.39 | -0.24 | 7.06 | 24.60 | 0.0279 | -0.0228 | |||
| IWD / iShares Trust - iShares Russell 1000 Value ETF | 0.04 | 6.93 | 0.0274 | 0.0274 | |||||
| CEG / Constellation Energy Corporation | 0.02 | 15.51 | 6.92 | 84.89 | 0.0273 | -0.0062 | |||
| AX / Axos Financial, Inc. | 0.09 | -2.50 | 6.82 | 14.91 | 0.0269 | -0.0262 | |||
| WMT / Walmart Inc. | 0.07 | -56.41 | 6.64 | -51.45 | 0.0262 | -0.0961 | |||
| TIPT / Tiptree Inc. | 0.28 | -2.38 | 6.49 | -4.45 | 0.0256 | -0.0351 | |||
| JNJ / Johnson & Johnson | 0.04 | -42.19 | 6.46 | -46.76 | 0.0255 | -0.0831 | |||
| DHR / Danaher Corporation | 0.03 | 7.21 | 6.44 | 3.31 | 0.0254 | -0.0303 | |||
| CCI / Crown Castle Inc. | 0.06 | 111.64 | 6.44 | 108.59 | 0.0254 | -0.0022 | |||
| CSL / Carlisle Companies Incorporated | 0.02 | -0.18 | 6.42 | 9.46 | 0.0254 | -0.0271 | |||
| CPAY / Corpay, Inc. | 0.02 | -4.23 | 6.25 | -8.87 | 0.0247 | -0.0367 | |||
| ACGL / Arch Capital Group Ltd. | 0.07 | -12.88 | 6.24 | -17.53 | 0.0247 | -0.0431 | |||
| WAB / Westinghouse Air Brake Technologies Corporation | 0.03 | -11.97 | 6.17 | 1.61 | 0.0244 | -0.0300 | |||
| CTVA / Corteva, Inc. | 0.08 | 65.07 | 6.13 | 95.53 | 0.0242 | -0.0038 | |||
| OZK / Bank OZK | 0.13 | -7.07 | 6.13 | 0.66 | 0.0242 | -0.0303 | |||
| RGS / Regis Corporation | 0.39 | 0.00 | 6.11 | 32.59 | 0.0241 | -0.0171 | |||
| NBIS / Nebius Group N.V. | 0.11 | 5.96 | 0.0235 | 0.0235 | |||||
| MUSA / Murphy USA Inc. | 0.01 | 7.45 | 5.87 | -6.95 | 0.0232 | -0.0332 | |||
| HD / The Home Depot, Inc. | 0.02 | 1.39 | 5.86 | 1.44 | 0.0231 | -0.0286 | |||
| FSBW / FS Bancorp, Inc. | 0.15 | -10.00 | 5.85 | -6.74 | 0.0231 | -0.0330 | |||
| USM / United States Cellular Corporation | 0.09 | -45.85 | 5.84 | -49.90 | 0.0230 | -0.0812 | |||
| ELV / Elevance Health, Inc. | 0.01 | -5.32 | 5.61 | -15.33 | 0.0221 | -0.0371 | |||
| SFM / Sprouts Farmers Market, Inc. | 0.03 | 23.65 | 5.33 | 33.39 | 0.0210 | -0.0147 | |||
| HUBB / Hubbell Incorporated | 0.01 | 17.09 | 5.28 | 44.54 | 0.0208 | -0.0118 | |||
| VBNK / VersaBank | 0.46 | 43.11 | 5.25 | 57.47 | 0.0207 | -0.0091 | |||
| SXC / SunCoke Energy, Inc. | 0.60 | -7.15 | 5.17 | -13.31 | 0.0204 | -0.0330 | |||
| CRH / CRH plc | 0.06 | 5.91 | 5.16 | 10.53 | 0.0204 | -0.0214 | |||
| ARES / Ares Management Corporation | 0.03 | -7.30 | 5.10 | 9.49 | 0.0201 | -0.0215 | |||
| PSA / Public Storage | 0.02 | 26.12 | 5.07 | 23.64 | 0.0200 | -0.0167 | |||
| SMCI / Super Micro Computer, Inc. | 0.10 | -51.94 | 5.06 | -31.21 | 0.0200 | -0.0458 | |||
| MAA / Mid-America Apartment Communities, Inc. | 0.03 | -7.81 | 5.02 | -18.58 | 0.0198 | -0.0353 | |||
| VZ / Verizon Communications Inc. | 0.12 | -54.05 | 4.98 | -56.16 | 0.0197 | -0.0820 | |||
| BAC / Bank of America Corporation | 0.10 | 2.13 | 4.90 | 15.82 | 0.0194 | -0.0185 | |||
| OPY / Oppenheimer Holdings Inc. | 0.07 | -2.65 | 4.82 | 7.37 | 0.0190 | -0.0211 | |||
| FPH / Five Point Holdings, LLC | 0.86 | -12.57 | 4.71 | -9.95 | 0.0186 | -0.0282 | |||
| STHO / Star Holdings | 0.60 | 17.15 | 4.70 | 7.52 | 0.0186 | -0.0206 | |||
| TNL / Travel + Leisure Co. | 0.09 | -45.23 | 4.69 | -38.94 | 0.0185 | -0.0502 | |||
| ACA / Arcosa, Inc. | 0.05 | 2.95 | 4.52 | 15.75 | 0.0179 | -0.0171 | |||
| MBI / MBIA Inc. | 1.03 | 29.05 | 4.46 | 12.48 | 0.0176 | -0.0179 | |||
| NODK / NI Holdings, Inc. | 0.35 | 5.31 | 4.45 | -5.92 | 0.0176 | -0.0248 | |||
| PLTR / Palantir Technologies Inc. | 0.03 | 0.76 | 4.40 | 62.75 | 0.0345 | 0.0103 | |||
| ZS / Zscaler, Inc. | 0.01 | 30.59 | 4.32 | 106.65 | 0.0171 | -0.0016 | |||
| KO / The Coca-Cola Company | 0.06 | -58.44 | 4.32 | -58.94 | 0.0170 | -0.0770 | |||
| PM / Philip Morris International Inc. | 0.02 | 2.30 | 4.29 | 17.39 | 0.0169 | -0.0157 | |||
| DHT / DHT Holdings, Inc. | 0.39 | -4.82 | 4.23 | -2.02 | 0.0167 | -0.0219 | |||
| SCHW / The Charles Schwab Corporation | 0.05 | 5.04 | 4.22 | 22.43 | 0.0167 | -0.0142 | |||
| EQR / Equity Residential | 0.06 | -25.51 | 4.19 | -29.77 | 0.0166 | -0.0369 | |||
| CSCO / Cisco Systems, Inc. | 0.06 | 2.43 | 4.19 | 15.18 | 0.0165 | -0.0160 | |||
| PKST / Peakstone Realty Trust | 0.32 | 131.95 | 4.17 | 143.24 | 0.0165 | 0.0011 | |||
| VICI / VICI Properties Inc. | 0.12 | -27.02 | 4.00 | -27.06 | 0.0158 | -0.0333 | |||
| IBKR / Interactive Brokers Group, Inc. | 0.07 | 277.01 | 3.98 | 26.15 | 0.0157 | -0.0125 | |||
| MCD / McDonald's Corporation | 0.01 | 3.20 | 3.93 | -3.48 | 0.0155 | -0.0209 | |||
| BA / The Boeing Company | 0.02 | 1.24 | 3.88 | 24.39 | 0.0153 | -0.0126 | |||
| TDOC / Teladoc Health, Inc. | 0.44 | 5.21 | 3.84 | 15.13 | 0.0152 | -0.0147 | |||
| ADI / Analog Devices, Inc. | 0.02 | 5.28 | 3.81 | 24.25 | 0.0150 | -0.0124 | |||
| SGMA / SigmaTron International, Inc. | 1.22 | 117.66 | 3.63 | 174.19 | 0.0143 | 0.0025 | |||
| WAL / Western Alliance Bancorporation | 0.05 | -4.67 | 3.63 | -3.25 | 0.0143 | -0.0192 | |||
| ABT / Abbott Laboratories | 0.03 | 1.79 | 3.63 | 4.37 | 0.0143 | -0.0168 | |||
| TMUS / T-Mobile US, Inc. | 0.02 | 0.30 | 3.61 | -10.41 | 0.0143 | -0.0218 | |||
| AMD / Advanced Micro Devices, Inc. | 0.03 | 1.56 | 3.59 | 40.24 | 0.0142 | -0.0087 | |||
| DGX / Quest Diagnostics Incorporated | 0.02 | 29.07 | 3.57 | 37.05 | 0.0141 | -0.0092 | |||
| VTR / Ventas, Inc. | 0.06 | -0.32 | 3.56 | -8.45 | 0.0140 | -0.0207 | |||
| MPC / Marathon Petroleum Corporation | 0.02 | -0.59 | 3.41 | 13.32 | 0.0135 | -0.0135 | |||
| OMCC / Old Market Capital Corporation | 0.62 | 0.00 | 3.38 | -8.97 | 0.0134 | -0.0199 | |||
| OMF / OneMain Holdings, Inc. | 0.06 | -0.84 | 3.38 | 15.66 | 0.0133 | -0.0128 | |||
| A / Agilent Technologies, Inc. | 0.03 | 0.32 | 3.30 | 1.23 | 0.0130 | -0.0161 | |||
| AVT / Avnet, Inc. | 0.06 | 1.69 | 3.28 | 12.23 | 0.0129 | -0.0132 | |||
| ACN / Accenture plc | 0.01 | 1.84 | 3.27 | -2.44 | 0.0129 | -0.0171 | |||
| PGR / The Progressive Corporation | 0.01 | 1.55 | 3.26 | -4.23 | 0.0129 | -0.0176 | |||
| KEX / Kirby Corporation | 0.03 | 3.30 | 3.26 | 15.98 | 0.0129 | -0.0123 | |||
| KDP / Keurig Dr Pepper Inc. | 0.10 | -74.47 | 3.24 | -75.34 | 0.0128 | -0.1049 | |||
| TCI / Transcontinental Realty Investors, Inc. | 0.07 | 0.00 | 3.07 | 52.44 | 0.0121 | -0.0059 | |||
| COP / ConocoPhillips | 0.03 | -55.34 | 3.00 | -61.85 | 0.0119 | -0.0586 | |||
| FDX / FedEx Corporation | 0.01 | -55.53 | 2.99 | -58.54 | 0.0118 | -0.0527 | |||
| CHRW / C.H. Robinson Worldwide, Inc. | 0.03 | 4.06 | 2.97 | -2.49 | 0.0117 | -0.0155 | |||
| UBER / Uber Technologies, Inc. | 0.03 | 2.13 | 2.97 | 30.78 | 0.0117 | -0.0086 | |||
| RTX / RTX Corporation | 0.02 | 2.13 | 2.95 | 12.57 | 0.0116 | -0.0118 | |||
| SOBO / South Bow Corporation | 0.11 | 58.59 | 2.92 | 61.07 | 0.0115 | -0.0047 | |||
| ARCC / Ares Capital Corporation | 0.13 | -81.50 | 2.90 | -81.67 | 0.0115 | -0.1303 | |||
| CURB / Curbline Properties Corp. | 0.13 | -1.11 | 2.87 | -6.66 | 0.0225 | -0.0050 | |||
| GILD / Gilead Sciences, Inc. | 0.03 | 1.55 | 2.86 | 0.46 | 0.0113 | -0.0142 | |||
| LC / LendingClub Corporation | 0.24 | 19.59 | 2.86 | 39.43 | 0.0113 | -0.0071 | |||
| ROKU / Roku, Inc. | 0.03 | -0.76 | 2.76 | 23.81 | 0.0109 | -0.0091 | |||
| PLAB / Photronics, Inc. | 0.15 | 2.74 | 0.0215 | 0.0215 | |||||
| J / Jacobs Solutions Inc. | 0.02 | 5.23 | 2.68 | 14.46 | 0.0106 | -0.0104 | |||
| HSIC / Henry Schein, Inc. | 0.04 | -0.55 | 2.68 | 6.10 | 0.0106 | -0.0120 | |||
| QCOM / QUALCOMM Incorporated | 0.02 | 2.13 | 2.67 | 5.87 | 0.0105 | -0.0120 | |||
| NEE / NextEra Energy, Inc. | 0.04 | -67.39 | 2.65 | -68.08 | 0.0105 | -0.0638 | |||
| PYPL / PayPal Holdings, Inc. | 0.04 | -0.91 | 2.62 | 12.88 | 0.0104 | -0.0104 | |||
| FLGT / Fulgent Genetics, Inc. | 0.13 | 4.05 | 2.55 | 22.40 | 0.0101 | -0.0086 | |||
| MMC / Marsh & McLennan Companies, Inc. | 0.01 | 1.36 | 2.53 | -9.21 | 0.0100 | -0.0150 | |||
| FWONK / Formula One Group | 0.02 | -8.04 | 2.53 | 6.74 | 0.0100 | -0.0112 | |||
| SBUX / Starbucks Corporation | 0.03 | -32.78 | 2.52 | -37.22 | 0.0100 | -0.0260 | |||
| CNC / Centene Corporation | 0.05 | 9.71 | 2.47 | -1.90 | 0.0098 | -0.0128 | |||
| DLTR / Dollar Tree, Inc. | 0.02 | 1.02 | 2.46 | 33.26 | 0.0097 | -0.0068 | |||
| NXDT / NexPoint Diversified Real Estate Trust | 0.58 | 15.44 | 2.42 | 26.27 | 0.0096 | -0.0076 | |||
| CPRT / Copart, Inc. | 0.05 | 8.35 | 2.42 | -6.03 | 0.0095 | -0.0135 | |||
| EA / Electronic Arts Inc. | 0.01 | 14.21 | 2.34 | 26.22 | 0.0092 | -0.0073 | |||
| F / Ford Motor Company | 0.21 | 0.58 | 2.32 | 8.79 | 0.0091 | -0.0099 | |||
| AMAT / Applied Materials, Inc. | 0.01 | -71.25 | 2.26 | -63.73 | 0.0089 | -0.0468 | |||
| RRC / Range Resources Corporation | 0.06 | -8.58 | 2.26 | -6.89 | 0.0089 | -0.0128 | |||
| MO / Altria Group, Inc. | 0.04 | 1.42 | 2.25 | -0.93 | 0.0089 | -0.0114 | |||
| ABNB / Airbnb, Inc. | 0.02 | 0.80 | 2.19 | 11.69 | 0.0086 | -0.0089 | |||
| EW / Edwards Lifesciences Corporation | 0.03 | 0.67 | 2.16 | 8.65 | 0.0085 | -0.0093 | |||
| AGO / Assured Guaranty Ltd. | 0.02 | 29.45 | 2.16 | 27.95 | 0.0085 | -0.0066 | |||
| EXE / Expand Energy Corporation | 0.02 | 8.56 | 2.15 | 14.03 | 0.0085 | -0.0084 | |||
| TEVA / Teva Pharmaceutical Industries Limited - Depositary Receipt (Common Stock) | 0.13 | -6.10 | 2.13 | 2.36 | 0.0084 | -0.0102 | |||
| TJX / The TJX Companies, Inc. | 0.02 | 2.14 | 2.11 | 3.54 | 0.0083 | -0.0099 | |||
| PFE / Pfizer Inc. | 0.09 | 2.13 | 2.08 | -2.30 | 0.0082 | -0.0108 | |||
| LRCX / Lam Research Corporation | 0.02 | -89.26 | 2.08 | -85.62 | 0.0082 | -0.1212 | |||
| BMO / Bank of Montreal | 0.02 | 30.86 | 2.03 | 51.61 | 0.0080 | -0.0040 | |||
| TGT / Target Corporation | 0.02 | -20.18 | 2.00 | -24.56 | 0.0079 | -0.0158 | |||
| ET / Energy Transfer LP - Limited Partnership | 0.10 | 0.00 | 1.87 | -2.50 | 0.0074 | -0.0098 | |||
| OMC / Omnicom Group Inc. | 0.03 | -1.02 | 1.81 | -14.11 | 0.0072 | -0.0117 | |||
| CL / Colgate-Palmolive Company | 0.02 | 1.32 | 1.77 | -1.72 | 0.0070 | -0.0091 | |||
| GAP / The Gap, Inc. | 0.08 | 4.28 | 1.75 | 10.32 | 0.0069 | -0.0073 | |||
| CMTL / Comtech Telecommunications Corp. | 0.73 | 0.00 | 1.74 | 53.31 | 0.0069 | -0.0033 | |||
| HAS / Hasbro, Inc. | 0.02 | 0.00 | 1.73 | 20.07 | 0.0068 | -0.0061 | |||
| WMB / The Williams Companies, Inc. | 0.03 | 1.44 | 1.70 | 6.64 | 0.0067 | -0.0076 | |||
| TER / Teradyne, Inc. | 0.02 | 30.56 | 1.66 | 42.17 | 0.0066 | -0.0039 | |||
| BX / Blackstone Inc. | 0.01 | 2.12 | 1.66 | 9.23 | 0.0065 | -0.0070 | |||
| CUZ / Cousins Properties Incorporated | 0.05 | -1.05 | 1.65 | 0.73 | 0.0065 | -0.0081 | |||
| SHOO / Steven Madden, Ltd. | 0.07 | 1.63 | 0.0064 | 0.0064 | |||||
| PPG / PPG Industries, Inc. | 0.01 | -0.42 | 1.59 | 3.59 | 0.0063 | -0.0074 | |||
| SUPP / TCW ETF Trust - TCW Transform Supply Chain ETF | 0.02 | -0.00 | 1.52 | 16.83 | 0.0060 | -0.0056 | |||
| SO / The Southern Company | 0.02 | 2.13 | 1.52 | 2.02 | 0.0060 | -0.0073 | |||
| BAX / Baxter International Inc. | 0.05 | 0.98 | 1.48 | -10.70 | 0.0058 | -0.0090 | |||
| BMY / Bristol-Myers Squibb Company | 0.03 | 2.13 | 1.43 | -22.50 | 0.0056 | -0.0108 | |||
| IPG / The Interpublic Group of Companies, Inc. | 0.06 | -2.18 | 1.41 | -11.80 | 0.0056 | -0.0088 | |||
| SWKS / Skyworks Solutions, Inc. | 0.02 | 9.30 | 1.41 | 26.08 | 0.0056 | -0.0044 | |||
| AAP / Advance Auto Parts, Inc. | 0.03 | 52.35 | 1.38 | 80.63 | 0.0055 | -0.0014 | |||
| DUK / Duke Energy Corporation | 0.01 | 2.14 | 1.38 | -1.22 | 0.0054 | -0.0070 | |||
| CMA / Comerica Incorporated | 0.02 | 0.00 | 1.37 | 0.96 | 0.0054 | -0.0067 | |||
| ON / ON Semiconductor Corporation | 0.03 | -91.22 | 1.36 | -88.69 | 0.0054 | -0.1023 | |||
| ED / Consolidated Edison, Inc. | 0.01 | 4.11 | 1.34 | -5.56 | 0.0053 | -0.0074 | |||
| MDLZ / Mondelez International, Inc. | 0.02 | -80.06 | 1.32 | -80.19 | 0.0052 | -0.0545 | |||
| UAL / United Airlines Holdings, Inc. | 0.02 | -54.10 | 1.32 | -47.08 | 0.0052 | -0.0171 | |||
| CVS / CVS Health Corporation | 0.02 | 2.13 | 1.31 | 3.97 | 0.0052 | -0.0061 | |||
| GIS / General Mills, Inc. | 0.03 | 0.07 | 1.30 | -13.31 | 0.0051 | -0.0083 | |||
| NOK / Nokia Oyj - Depositary Receipt (Common Stock) | 0.25 | 208.67 | 1.29 | 204.01 | 0.0051 | 0.0013 | |||
| K / Kellanova | 0.02 | 1.40 | 1.28 | -2.28 | 0.0051 | -0.0067 | |||
| AIFD / TCW ETF Trust - TCW Artificial Intelligence ETF | 0.04 | -0.50 | 1.28 | 27.92 | 0.0051 | -0.0039 | |||
| BXP / Boston Properties, Inc. | 0.02 | -47.07 | 1.26 | -46.85 | 0.0050 | -0.0163 | |||
| NKE / NIKE, Inc. | 0.02 | 2.13 | 1.25 | 14.32 | 0.0050 | -0.0049 | |||
| APTV / Aptiv PLC | 0.02 | -0.78 | 1.21 | 13.79 | 0.0048 | -0.0048 | |||
| VKTX / Viking Therapeutics, Inc. | 0.05 | -39.61 | 1.20 | -33.72 | 0.0047 | -0.0115 | |||
| CMG / Chipotle Mexican Grill, Inc. | 0.02 | 0.99 | 1.14 | 13.01 | 0.0045 | -0.0045 | |||
| NXRT / NexPoint Residential Trust, Inc. | 0.03 | -53.17 | 1.10 | -60.53 | 0.0044 | -0.0206 | |||
| GLPI / Gaming and Leisure Properties, Inc. | 0.02 | -1.07 | 1.10 | -9.32 | 0.0043 | -0.0065 | |||
| FBTC / Fidelity Wise Origin Bitcoin Fund | 0.01 | 0.00 | 1.07 | 30.54 | 0.0042 | -0.0031 | |||
| USB / U.S. Bancorp | 0.02 | 2.13 | 1.07 | 9.46 | 0.0042 | -0.0045 | |||
| PCH / PotlatchDeltic Corporation | 0.03 | -1.04 | 1.06 | -15.81 | 0.0042 | -0.0071 | |||
| HOOD / Robinhood Markets, Inc. | 0.01 | 1.04 | 0.0081 | 0.0081 | |||||
| STAG / STAG Industrial, Inc. | 0.03 | -0.29 | 1.02 | 0.20 | 0.0040 | -0.0051 | |||
| NEM / Newmont Corporation | 0.02 | -0.15 | 0.98 | 20.52 | 0.0039 | -0.0034 | |||
| CHD / Church & Dwight Co., Inc. | 0.01 | 0.96 | 0.0038 | 0.0038 | |||||
| COLD / Americold Realty Trust, Inc. | 0.06 | -1.02 | 0.93 | -23.27 | 0.0037 | -0.0072 | |||
| CSX / CSX Corporation | 0.03 | -0.51 | 0.93 | 10.34 | 0.0037 | -0.0039 | |||
| WIT / Wipro Limited - Depositary Receipt (Common Stock) | 0.30 | -18.55 | 0.92 | -19.56 | 0.0036 | -0.0066 | |||
| PWRD / TCW ETF Trust - TCW Transform Systems ETF | 0.01 | -0.69 | 0.90 | 28.45 | 0.0036 | -0.0027 | |||
| CARR / Carrier Global Corporation | 0.01 | 2.13 | 0.90 | 17.98 | 0.0036 | -0.0033 | |||
| EPRT / Essential Properties Realty Trust, Inc. | 0.03 | -0.98 | 0.88 | -3.19 | 0.0035 | -0.0047 | |||
| MTW / The Manitowoc Company, Inc. | 0.07 | 24.07 | 0.88 | 73.72 | 0.0035 | -0.0011 | |||
| KMI / Kinder Morgan, Inc. | 0.03 | -88.24 | 0.88 | -87.88 | 0.0035 | -0.0612 | |||
| TFC / Truist Financial Corporation | 0.02 | 2.12 | 0.85 | 6.66 | 0.0034 | -0.0038 | |||
| KHC / The Kraft Heinz Company | 0.03 | 0.33 | 0.84 | -14.79 | 0.0033 | -0.0055 | |||
| WH / Wyndham Hotels & Resorts, Inc. | 0.01 | -1.11 | 0.83 | -11.28 | 0.0033 | -0.0051 | |||
| PECO / Phillips Edison & Company, Inc. | 0.02 | -0.98 | 0.80 | -5.01 | 0.0032 | -0.0044 | |||
| NLY / Annaly Capital Management, Inc. | 0.04 | 0.00 | 0.78 | -7.37 | 0.0031 | -0.0045 | |||
| O / Realty Income Corporation | 0.01 | 4.59 | 0.78 | 3.87 | 0.0031 | -0.0036 | |||
| BTI / British American Tobacco p.l.c. - Depositary Receipt (Common Stock) | 0.02 | 0.00 | 0.74 | 14.48 | 0.0029 | -0.0029 | |||
| D / Dominion Energy, Inc. | 0.01 | 4.01 | 0.73 | 4.89 | 0.0029 | -0.0033 | |||
| SLB / Schlumberger Limited | 0.02 | -2.29 | 0.69 | -20.94 | 0.0027 | -0.0051 | |||
| PCG / PG&E Corporation | 0.05 | 1.43 | 0.69 | -17.75 | 0.0027 | -0.0048 | |||
| EPD / Enterprise Products Partners L.P. - Limited Partnership | 0.02 | 0.00 | 0.68 | -9.15 | 0.0027 | -0.0040 | |||
| EXC / Exelon Corporation | 0.02 | 3.58 | 0.66 | -2.35 | 0.0026 | -0.0035 | |||
| MNST / Monster Beverage Corporation | 0.01 | 2.14 | 0.65 | 9.26 | 0.0051 | -0.0002 | |||
| GFL / GFL Environmental Inc. | 0.01 | -40.22 | 0.65 | -37.61 | 0.0026 | -0.0067 | |||
| WMG / Warner Music Group Corp. | 0.02 | -2.04 | 0.65 | -14.91 | 0.0026 | -0.0042 | |||
| RITM / Rithm Capital Corp. | 0.06 | 0.00 | 0.62 | -1.42 | 0.0025 | -0.0032 | |||
| UMC / United Microelectronics Corporation - Depositary Receipt (Common Stock) | 0.08 | -18.55 | 0.62 | -12.90 | 0.0025 | -0.0039 | |||
| GLW / Corning Incorporated | 0.01 | -0.45 | 0.62 | 14.31 | 0.0024 | -0.0024 | |||
| JNPR / Juniper Networks, Inc. | 0.01 | 0.00 | 0.60 | 10.37 | 0.0024 | -0.0025 | |||
| CPNG / Coupang, Inc. | 0.02 | 4.13 | 0.59 | 42.21 | 0.0023 | -0.0014 | |||
| INFY / Infosys Limited - Depositary Receipt (Common Stock) | 0.03 | -18.54 | 0.59 | -17.23 | 0.0023 | -0.0040 | |||
| KVUE / Kenvue Inc. | 0.03 | 2.13 | 0.55 | -10.88 | 0.0022 | -0.0033 | |||
| SPHR / Sphere Entertainment Co. | 0.01 | 14.86 | 0.52 | 46.91 | 0.0021 | -0.0011 | |||
| BEPC / Brookfield Renewable Corporation | 0.02 | -5.45 | 0.52 | 11.11 | 0.0021 | -0.0021 | |||
| CWENA / Clearway Energy Inc - Class A | 0.02 | -5.45 | 0.46 | 0.65 | 0.0018 | -0.0023 | |||
| CCL / Carnival Corporation & plc | 0.02 | 7.17 | 0.46 | 54.36 | 0.0018 | -0.0009 | |||
| WOW / WideOpenWest, Inc. | 0.10 | 0.00 | 0.42 | -17.93 | 0.0017 | -0.0029 | |||
| PPL / PPL Corporation | 0.01 | 0.99 | 0.42 | -5.24 | 0.0016 | -0.0023 | |||
| FITB / Fifth Third Bancorp | 0.01 | 0.06 | 0.41 | 5.08 | 0.0016 | -0.0019 | |||
| HPE / Hewlett Packard Enterprise Company | 0.02 | 3.22 | 0.41 | 36.70 | 0.0016 | -0.0011 | |||
| WBD / Warner Bros. Discovery, Inc. | 0.03 | 3.61 | 0.39 | 10.70 | 0.0016 | -0.0016 | |||
| HBAN / Huntington Bancshares Incorporated | 0.02 | 2.13 | 0.37 | 14.02 | 0.0014 | -0.0014 | |||
| RWT / Redwood Trust, Inc. | 0.06 | 0.00 | 0.37 | -2.66 | 0.0014 | -0.0019 | |||
| HPQ / HP Inc. | 0.01 | 2.14 | 0.35 | -9.84 | 0.0014 | -0.0021 | |||
| HASI / HA Sustainable Infrastructure Capital, Inc. | 0.01 | -5.45 | 0.33 | -13.26 | 0.0013 | -0.0021 | |||
| 1AMCR / Amcor plc | 0.03 | 61.35 | 0.32 | 53.14 | 0.0025 | 0.0006 | |||
| RF / Regions Financial Corporation | 0.01 | -4.48 | 0.31 | 3.39 | 0.0012 | -0.0014 | |||
| CTRA / Coterra Energy Inc. | 0.01 | 3.75 | 0.29 | -8.78 | 0.0011 | -0.0017 | |||
| DOW / Dow Inc. | 0.01 | 2.13 | 0.28 | -22.38 | 0.0011 | -0.0021 | |||
| WY / Weyerhaeuser Company | 0.01 | -2.79 | 0.27 | -14.60 | 0.0011 | -0.0018 | |||
| HAL / Halliburton Company | 0.01 | -0.82 | 0.27 | -20.18 | 0.0010 | -0.0019 | |||
| KEY / KeyCorp | 0.01 | -2.89 | 0.25 | 5.98 | 0.0010 | -0.0011 | |||
| INDA / iShares Trust - iShares MSCI India ETF | 0.00 | -100.00 | 0.00 | 0.0000 | |||||
| FL / Foot Locker, Inc. | 0.00 | -100.00 | 0.00 | 0.0000 | |||||
| GBDC / Golub Capital BDC, Inc. | 0.00 | -100.00 | 0.00 | 0.0000 | |||||
| GES / Guess?, Inc. | 0.00 | -100.00 | 0.00 | 0.0000 | |||||
| SBAC / SBA Communications Corporation | 0.00 | -100.00 | 0.00 | 0.0000 | |||||
| DOLE / Dole plc | 0.00 | -100.00 | 0.00 | 0.0000 | |||||
| ENB / Enbridge Inc. | 0.00 | -100.00 | 0.00 | 0.0000 | |||||
| ENPH / Enphase Energy, Inc. | 0.00 | -100.00 | 0.00 | 0.0000 | |||||
| XYZ / Block, Inc. | 0.00 | -100.00 | 0.00 | 0.0000 | |||||
| KR / The Kroger Co. | 0.00 | -100.00 | 0.00 | 0.0000 | |||||
| LYB / LyondellBasell Industries N.V. | 0.00 | -100.00 | 0.00 | 0.0000 | |||||
| WSC / WillScot Holdings Corporation | 0.00 | -100.00 | 0.00 | 0.0000 | |||||
| COTY / Coty Inc. | 0.00 | -100.00 | 0.00 | 0.0000 | |||||
| LGFB / Lions Gate Entertainment Corp. - Class B | 0.00 | -100.00 | 0.00 | 0.0000 | |||||
| AMH / American Homes 4 Rent | 0.00 | -100.00 | 0.00 | 0.0000 | |||||
| FANG / Diamondback Energy, Inc. | 0.00 | -100.00 | 0.00 | 0.0000 |