Statistik Asas
| Nilai Portfolio | $ 149,167,941 |
| Kedudukan Semasa | 128 |
Pegangan Terkini, Prestasi, AUM (dari 13F, 13D)
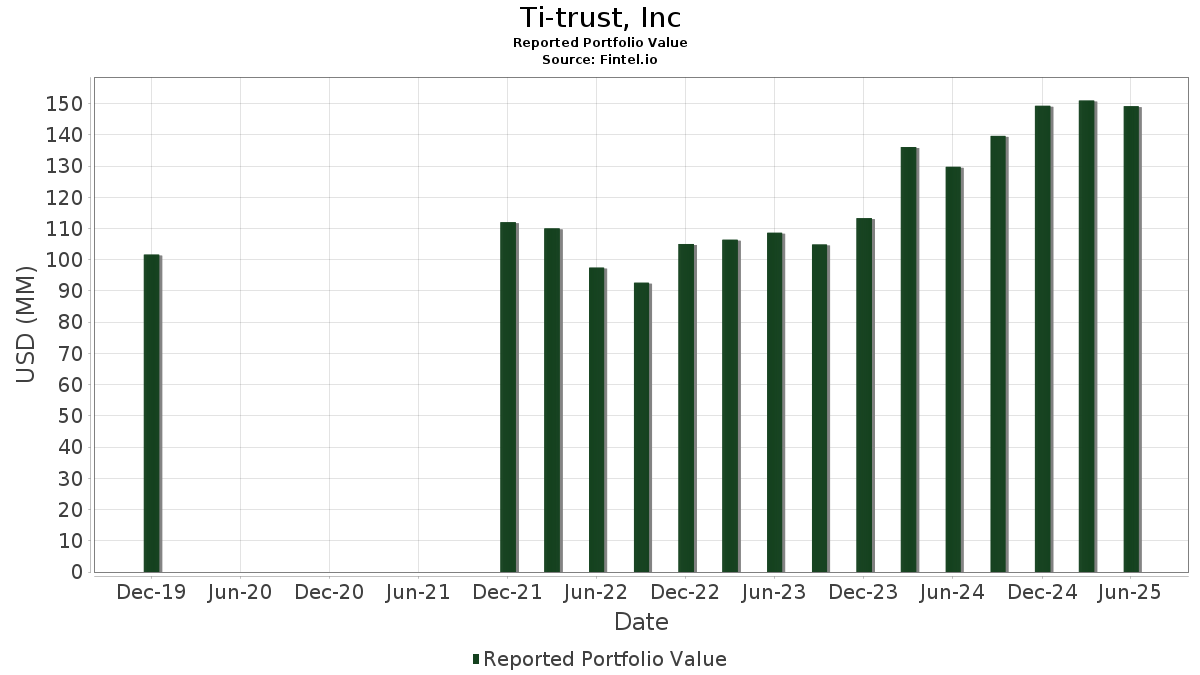
Ti-trust, Inc telah mendedahkan 128 jumlah pegangan dalam pemfailan SEC terkini mereka. Nilai portfolio terkini dikira sebagai $ 149,167,941 USD. Aset Sebenar Di Bawah Pengurusan (AUM) ialah nilai ini ditambah dengan tunai (yang tidak didedahkan). Pegangan teratas Ti-trust, Inc ialah Vanguard Index Funds - Vanguard Total Stock Market ETF (US:VTI) , Vanguard International Equity Index Funds - Vanguard FTSE All-World ex-US ETF (US:VEU) , Microsoft Corporation (US:MSFT) , SPDR S&P MidCap 400 ETF Trust (US:MDY) , and Vanguard Index Funds - Vanguard Small-Cap ETF (US:VB) . Kedudukan baharu Ti-trust, Inc termasuk Booking Holdings Inc. (US:BKNG) , . Industri teratas Ti-trust, Inc ialah "Printing, Publishing, And Allied Industries" (sic 27) , "Wholesale Trade-non-durable Goods" (sic 51) , and "Non-depository Credit Institutions" (sic 61) .
Kenaikan Teratas Suku Tahun Ini
Kami menggunakan perubahan dalam peruntukan portfolio kerana ini adalah metrik yang paling bermakna. Perubahan boleh disebabkan oleh perdagangan atau perubahan dalam harga saham.
| Sekuriti | Saham (MM) |
Nilai (MM$) |
Portfolio % | ΔPortfolio % |
|---|---|---|---|---|
| 0.01 | 5.39 | 3.6167 | 0.9275 | |
| 0.01 | 3.13 | 2.0955 | 0.8379 | |
| 0.04 | 11.62 | 7.7867 | 0.7894 | |
| 0.03 | 1.83 | 1.2265 | 0.7107 | |
| 0.00 | 1.19 | 0.7969 | 0.6985 | |
| 0.12 | 7.95 | 5.3306 | 0.6071 | |
| 0.02 | 1.58 | 1.0601 | 0.3488 | |
| 0.16 | 3.27 | 2.1953 | 0.3443 | |
| 0.01 | 5.31 | 3.5614 | 0.3369 | |
| 0.07 | 1.95 | 1.3065 | 0.3088 |
Penurunan Teratas Suku Tahun Ini
Kami menggunakan perubahan dalam peruntukan portfolio kerana ini adalah metrik yang paling bermakna. Perubahan boleh disebabkan oleh perdagangan atau perubahan dalam harga saham.
| Sekuriti | Saham (MM) |
Nilai (MM$) |
Portfolio % | ΔPortfolio % |
|---|---|---|---|---|
| 0.02 | 1.05 | 0.7025 | -0.2120 | |
| 0.02 | 2.56 | 1.7164 | -0.1564 | |
| 0.02 | 1.52 | 1.0164 | -0.1205 | |
| 0.01 | 2.12 | 1.4214 | -0.1156 | |
| 0.01 | 1.47 | 0.9827 | -0.0874 | |
| 0.01 | 1.35 | 0.9050 | -0.0568 | |
| 0.01 | 0.22 | 0.1503 | -0.0455 | |
| 0.01 | 0.23 | 0.1569 | -0.0450 | |
| 0.00 | 1.68 | 1.1256 | -0.0396 | |
| 0.01 | 0.42 | 0.2828 | -0.0380 |
Pemfailan 13D/G
Ini ialah senarai pemfailan 13D dan 13G yang dibuat pada tahun lepas (jika ada). Klik ikon pautan untuk melihat sejarah transaksi penuh. Baris hijau menunjukkan kedudukan baharu. Baris merah menunjukkan kedudukan tertutup.
| Tarikh Fail | Borang | Sekuriti | Saham Terdahulu |
Saham Semasa |
ΔSaham % | % Pemilikan |
% ΔPemilikan | |
|---|---|---|---|---|---|---|---|---|
| 2025-04-04 | RMBI / Richmond Mutual Bancorporation, Inc. | 1,064,889 | 10.20 |
13F dan Pemfailan Dana
Borang ini telah difailkan pada 2025-07-23 untuk tempoh pelaporan 2025-06-30. Klik ikon pautan untuk melihat sejarah transaksi penuh.
Tingkatkan untuk membuka data premium dan eksport ke Excel ![]() .
.
| Sekuriti | Jenis | Purata Harga Saham | Saham (MM) |
ΔSaham (%) |
ΔSaham (%) |
Nilai ($MM) |
Portfolio (%) |
ΔPortfolio (%) |
|
|---|---|---|---|---|---|---|---|---|---|
| VTI / Vanguard Index Funds - Vanguard Total Stock Market ETF | 0.04 | -0.57 | 11.62 | 9.96 | 7.7867 | 0.7894 | |||
| VEU / Vanguard International Equity Index Funds - Vanguard FTSE All-World ex-US ETF | 0.12 | 0.62 | 7.95 | 11.50 | 5.3306 | 0.6071 | |||
| MSFT / Microsoft Corporation | 0.01 | 0.29 | 5.39 | 32.89 | 3.6167 | 0.9275 | |||
| MDY / SPDR S&P MidCap 400 ETF Trust | 0.01 | 2.77 | 5.31 | 9.12 | 3.5614 | 0.3369 | |||
| VB / Vanguard Index Funds - Vanguard Small-Cap ETF | 0.02 | 0.49 | 4.66 | 7.39 | 3.1257 | 0.2497 | |||
| AGG / iShares Trust - iShares Core U.S. Aggregate Bond ETF | 0.04 | 0.42 | 4.26 | 0.71 | 2.8533 | 0.0536 | |||
| BSV / Vanguard Bond Index Funds - Vanguard Short-Term Bond ETF | 0.05 | 3.29 | 4.23 | 3.86 | 2.8340 | 0.1375 | |||
| BKLN / Invesco Exchange-Traded Fund Trust II - Invesco Senior Loan ETF | 0.16 | 15.95 | 3.27 | 17.18 | 2.1953 | 0.3443 | |||
| AVGO / Broadcom Inc. | 0.01 | 0.00 | 3.13 | 64.65 | 2.0955 | 0.8379 | |||
| VWO / Vanguard International Equity Index Funds - Vanguard FTSE Emerging Markets ETF | 0.06 | 1.65 | 2.95 | 11.09 | 1.9747 | 0.2182 | |||
| ITW / Illinois Tool Works Inc. | 0.01 | -2.28 | 2.65 | -2.57 | 1.7790 | -0.0253 | |||
| XOM / Exxon Mobil Corporation | 0.02 | -0.10 | 2.56 | -9.44 | 1.7164 | -0.1564 | |||
| DUK / Duke Energy Corporation | 0.02 | 0.19 | 2.46 | -3.07 | 1.6497 | -0.0319 | |||
| TIP / iShares Trust - iShares TIPS Bond ETF | 0.02 | -0.89 | 2.44 | -1.85 | 1.6342 | -0.0106 | |||
| JNK / SPDR Series Trust - SPDR Bloomberg High Yield Bond ETF | 0.02 | 3.08 | 2.33 | 5.23 | 1.5647 | 0.0952 | |||
| JPM / JPMorgan Chase & Co. | 0.01 | 0.00 | 2.28 | 18.22 | 1.5313 | 0.2511 | |||
| CVX / Chevron Corporation | 0.01 | 6.76 | 2.12 | -8.62 | 1.4214 | -0.1156 | |||
| CAT / Caterpillar Inc. | 0.01 | -1.83 | 2.08 | 15.56 | 1.3939 | 0.2020 | |||
| BAB / Invesco Exchange-Traded Fund Trust II - Invesco Taxable Municipal Bond ETF | 0.07 | 30.12 | 1.95 | 29.35 | 1.3065 | 0.3088 | |||
| MO / Altria Group, Inc. | 0.03 | 140.50 | 1.83 | 135.09 | 1.2265 | 0.7107 | |||
| EMR / Emerson Electric Co. | 0.01 | 2.97 | 1.81 | 25.21 | 1.2160 | 0.2565 | |||
| LLY / Eli Lilly and Company | 0.00 | 1.13 | 1.68 | -4.55 | 1.1256 | -0.0396 | |||
| HON / Honeywell International Inc. | 0.01 | 0.00 | 1.67 | 10.03 | 1.1177 | 0.1135 | |||
| CSCO / Cisco Systems, Inc. | 0.02 | 0.00 | 1.64 | 12.45 | 1.1023 | 0.1336 | |||
| AEE / Ameren Corporation | 0.02 | 53.95 | 1.58 | 47.34 | 1.0601 | 0.3488 | |||
| MRK / Merck & Co., Inc. | 0.02 | 0.16 | 1.52 | -11.66 | 1.0164 | -0.1205 | |||
| VNQ / Vanguard Specialized Funds - Vanguard Real Estate ETF | 0.02 | -0.36 | 1.51 | -2.01 | 1.0113 | -0.0083 | |||
| NEE / NextEra Energy, Inc. | 0.02 | 0.00 | 1.50 | -2.08 | 1.0078 | -0.0091 | |||
| ED / Consolidated Edison, Inc. | 0.01 | 0.00 | 1.47 | -9.29 | 0.9827 | -0.0874 | |||
| VYM / Vanguard Whitehall Funds - Vanguard High Dividend Yield ETF | 0.01 | -2.44 | 1.41 | 0.86 | 0.9476 | 0.0192 | |||
| OGE / OGE Energy Corp. | 0.03 | 0.00 | 1.36 | -3.48 | 0.9116 | -0.0212 | |||
| GWW / W.W. Grainger, Inc. | 0.00 | 0.00 | 1.35 | 5.30 | 0.9066 | 0.0559 | |||
| AAPL / Apple Inc. | 0.01 | 0.66 | 1.35 | -7.02 | 0.9050 | -0.0568 | |||
| DE / Deere & Company | 0.00 | 0.00 | 1.32 | 8.36 | 0.8863 | 0.0780 | |||
| IBM / International Business Machines Corporation | 0.00 | 0.00 | 1.31 | 18.61 | 0.8804 | 0.1466 | |||
| SO / The Southern Company | 0.01 | 0.00 | 1.30 | -0.15 | 0.8717 | 0.0093 | |||
| VMC / Vulcan Materials Company | 0.00 | 0.00 | 1.25 | 11.80 | 0.8393 | 0.0975 | |||
| SPY / SPDR S&P 500 ETF | 0.00 | -2.09 | 1.24 | 8.17 | 0.8342 | 0.0720 | |||
| BRK.B / Berkshire Hathaway Inc. | 0.00 | 453.62 | 1.19 | 1,088.00 | 0.7969 | 0.6985 | |||
| IWB / iShares Trust - iShares Russell 1000 ETF | 0.00 | 0.00 | 1.16 | 10.69 | 0.7783 | 0.0836 | |||
| IJR / iShares Trust - iShares Core S&P Small-Cap ETF | 0.01 | 0.76 | 1.15 | 5.30 | 0.7728 | 0.0477 | |||
| BA / The Boeing Company | 0.01 | 0.00 | 1.11 | 22.76 | 0.7455 | 0.1459 | |||
| BMY / Bristol-Myers Squibb Company | 0.02 | 0.00 | 1.05 | -24.13 | 0.7025 | -0.2120 | |||
| PM / Philip Morris International Inc. | 0.01 | 7.77 | 0.99 | 23.66 | 0.6658 | 0.1338 | |||
| NUE / Nucor Corporation | 0.01 | 0.00 | 0.96 | 7.61 | 0.6452 | 0.0530 | |||
| SRE / Sempra | 0.01 | 0.00 | 0.91 | 6.17 | 0.6116 | 0.0425 | |||
| CNP / CenterPoint Energy, Inc. | 0.02 | 0.00 | 0.91 | 1.45 | 0.6081 | 0.0156 | |||
| EBGEF / Enbridge Inc. - Preferred Stock | 0.02 | 0.00 | 0.90 | 2.27 | 0.6039 | 0.0205 | |||
| T / AT&T Inc. | 0.03 | -0.32 | 0.87 | 2.00 | 0.5801 | 0.0182 | |||
| MCD / McDonald's Corporation | 0.00 | 4.85 | 0.85 | -1.96 | 0.5713 | -0.0043 | |||
| RY / Royal Bank of Canada | 0.01 | 0.00 | 0.79 | 16.72 | 0.5291 | 0.0811 | |||
| NVDA / NVIDIA Corporation | 0.00 | 17.88 | 0.78 | 72.03 | 0.5236 | 0.2226 | |||
| MMM / 3M Company | 0.01 | 0.00 | 0.77 | 3.78 | 0.5149 | 0.0241 | |||
| NI / NiSource Inc. | 0.02 | 0.00 | 0.76 | 0.66 | 0.5125 | 0.0092 | |||
| GOOG / Alphabet Inc. | 0.00 | 1.08 | 0.76 | 14.78 | 0.5103 | 0.0710 | |||
| VO / Vanguard Index Funds - Vanguard Mid-Cap ETF | 0.00 | -0.55 | 0.76 | 7.66 | 0.5091 | 0.0416 | |||
| GDXD / MicroSectors Gold Miners -3X Inverse Leveraged ETNs due June 29, 2040 | 0.01 | 0.00 | 0.74 | 15.81 | 0.4963 | 0.0729 | |||
| TD / The Toronto-Dominion Bank | 0.01 | 0.00 | 0.74 | 22.55 | 0.4958 | 0.0960 | |||
| HUBB / Hubbell Incorporated | 0.00 | 0.00 | 0.71 | 23.44 | 0.4767 | 0.0951 | |||
| GJR / Strats Trust For Procter & Gambel Security - Preferred Security | 0.00 | 7.13 | 0.71 | 0.14 | 0.4764 | 0.0064 | |||
| GATX / GATX Corporation | 0.00 | 0.00 | 0.71 | -1.12 | 0.4735 | 0.0004 | |||
| AEP / American Electric Power Company, Inc. | 0.01 | 0.00 | 0.70 | -5.05 | 0.4670 | -0.0189 | |||
| LMT / Lockheed Martin Corporation | 0.00 | 0.48 | 0.67 | 4.17 | 0.4524 | 0.0233 | |||
| D / Dominion Energy, Inc. | 0.01 | 0.00 | 0.67 | 0.90 | 0.4520 | 0.0089 | |||
| EEM / iShares, Inc. - iShares MSCI Emerging Markets ETF | 0.01 | -0.82 | 0.67 | 9.46 | 0.4503 | 0.0439 | |||
| WEC / WEC Energy Group, Inc. | 0.01 | 0.00 | 0.67 | -4.29 | 0.4492 | -0.0150 | |||
| IWM / iShares Trust - iShares Russell 2000 ETF | 0.00 | -0.81 | 0.66 | 7.31 | 0.4437 | 0.0351 | |||
| DFAC / Dimensional ETF Trust - Dimensional U.S. Core Equity 2 ETF | 0.02 | 0.00 | 0.66 | 8.75 | 0.4420 | 0.0400 | |||
| ETR / Entergy Corporation | 0.01 | 0.00 | 0.65 | -2.70 | 0.4346 | -0.0071 | |||
| EFA / iShares Trust - iShares MSCI EAFE ETF | 0.01 | -0.83 | 0.64 | 8.45 | 0.4309 | 0.0384 | |||
| CTVA / Corteva, Inc. | 0.01 | 0.00 | 0.62 | 18.36 | 0.4154 | 0.0688 | |||
| VUG / Vanguard Index Funds - Vanguard Growth ETF | 0.00 | -6.82 | 0.62 | 10.20 | 0.4135 | 0.0426 | |||
| KO / The Coca-Cola Company | 0.01 | 0.00 | 0.62 | -1.28 | 0.4134 | -0.0001 | |||
| JNJ / Johnson & Johnson | 0.00 | 0.00 | 0.61 | -7.98 | 0.4100 | -0.0298 | |||
| WM / Waste Management, Inc. | 0.00 | 0.00 | 0.60 | -1.16 | 0.3993 | 0.0001 | |||
| DD / DuPont de Nemours, Inc. | 0.01 | 0.00 | 0.57 | -8.06 | 0.3823 | -0.0290 | |||
| MDLZ / Mondelez International, Inc. | 0.01 | 0.00 | 0.55 | -0.55 | 0.3667 | 0.0022 | |||
| VZ / Verizon Communications Inc. | 0.01 | 0.00 | 0.53 | -4.68 | 0.3552 | -0.0127 | |||
| GD / General Dynamics Corporation | 0.00 | 0.00 | 0.52 | 6.94 | 0.3519 | 0.0269 | |||
| INTC / Intel Corporation | 0.02 | -1.67 | 0.51 | -3.06 | 0.3403 | -0.0064 | |||
| NSC / Norfolk Southern Corporation | 0.00 | 0.00 | 0.49 | 8.15 | 0.3295 | 0.0282 | |||
| EVRG / Evergy, Inc. | 0.01 | 0.00 | 0.49 | 0.00 | 0.3256 | 0.0038 | |||
| FPE / First Trust Exchange-Traded Fund III - First Trust Preferred Securities and Income ETF | 0.03 | 19.54 | 0.47 | 21.13 | 0.3153 | 0.0578 | |||
| MDT / Medtronic plc | 0.01 | 0.00 | 0.47 | -2.92 | 0.3118 | -0.0058 | |||
| PAYX / Paychex, Inc. | 0.00 | 0.00 | 0.46 | -5.73 | 0.3091 | -0.0148 | |||
| USB / U.S. Bancorp | 0.01 | 0.00 | 0.43 | 7.05 | 0.2855 | 0.0223 | |||
| IJH / iShares Trust - iShares Core S&P Mid-Cap ETF | 0.01 | 0.00 | 0.43 | 6.25 | 0.2852 | 0.0201 | |||
| SNY / Sanofi - Depositary Receipt (Common Stock) | 0.01 | 0.00 | 0.42 | -13.02 | 0.2828 | -0.0380 | |||
| INFY / Infosys Limited - Depositary Receipt (Common Stock) | 0.02 | 0.00 | 0.42 | 1.45 | 0.2826 | 0.0076 | |||
| BAC / Bank of America Corporation | 0.01 | 0.00 | 0.41 | 13.61 | 0.2743 | 0.0353 | |||
| UL / Unilever PLC - Depositary Receipt (Common Stock) | 0.01 | 0.00 | 0.41 | 2.79 | 0.2717 | 0.0103 | |||
| FE / FirstEnergy Corp. | 0.01 | 0.00 | 0.40 | -0.25 | 0.2663 | 0.0021 | |||
| AMZN / Amazon.com, Inc. | 0.00 | 2.87 | 0.39 | 18.43 | 0.2633 | 0.0440 | |||
| PFE / Pfizer Inc. | 0.02 | 0.68 | 0.39 | -3.75 | 0.2585 | -0.0067 | |||
| IP / International Paper Company | 0.01 | 0.00 | 0.38 | -12.15 | 0.2524 | -0.0317 | |||
| TFC / Truist Financial Corporation | 0.01 | 0.00 | 0.36 | 4.68 | 0.2401 | 0.0130 | |||
| BTI / British American Tobacco p.l.c. - Depositary Receipt (Common Stock) | 0.01 | 0.00 | 0.36 | 14.47 | 0.2387 | 0.0325 | |||
| WDC / Western Digital Corporation | 0.01 | 0.00 | 0.35 | 58.18 | 0.2338 | 0.0878 | |||
| SHEL / Shell plc - Depositary Receipt (Common Stock) | 0.00 | 0.00 | 0.35 | -3.89 | 0.2322 | -0.0066 | |||
| SWX / Southwest Gas Holdings, Inc. | 0.00 | 0.00 | 0.34 | 3.63 | 0.2301 | 0.0107 | |||
| KMB / Kimberly-Clark Corporation | 0.00 | 6.76 | 0.34 | -3.13 | 0.2280 | -0.0048 | |||
| VEA / Vanguard Tax-Managed Funds - Vanguard FTSE Developed Markets ETF | 0.01 | 7.18 | 0.33 | 20.14 | 0.2243 | 0.0399 | |||
| V / Visa Inc. | 0.00 | 0.00 | 0.33 | 1.22 | 0.2225 | 0.0055 | |||
| RTX / RTX Corporation | 0.00 | 0.00 | 0.32 | 10.58 | 0.2172 | 0.0225 | |||
| SYY / Sysco Corporation | 0.00 | 0.00 | 0.30 | 1.00 | 0.2041 | 0.0043 | |||
| EIX / Edison International | 0.01 | 0.00 | 0.30 | -12.46 | 0.2027 | -0.0260 | |||
| KHC / The Kraft Heinz Company | 0.01 | 0.00 | 0.29 | -15.25 | 0.1940 | -0.0319 | |||
| ABBV / AbbVie Inc. | 0.00 | 0.00 | 0.28 | -11.43 | 0.1873 | -0.0216 | |||
| KFFB / Kentucky First Federal Bancorp | 0.09 | -4.46 | 0.27 | -6.64 | 0.1791 | -0.0106 | |||
| THO / THOR Industries, Inc. | 0.00 | 0.00 | 0.27 | 17.26 | 0.1778 | 0.0278 | |||
| BLV / Vanguard Bond Index Funds - Vanguard Long-Term Bond ETF | 0.00 | 0.00 | 0.26 | -1.13 | 0.1767 | -0.0001 | |||
| TRV / The Travelers Companies, Inc. | 0.00 | 0.00 | 0.26 | 1.17 | 0.1740 | 0.0041 | |||
| VCIT / Vanguard Scottsdale Funds - Vanguard Intermediate-Term Corporate Bond ETF | 0.00 | 0.00 | 0.26 | 1.59 | 0.1718 | 0.0044 | |||
| UPS / United Parcel Service, Inc. | 0.00 | 0.00 | 0.25 | -8.33 | 0.1702 | -0.0130 | |||
| CI / The Cigna Group | 0.00 | 0.00 | 0.25 | 0.40 | 0.1695 | 0.0028 | |||
| VBK / Vanguard Index Funds - Vanguard Small-Cap Growth ETF | 0.00 | -5.77 | 0.25 | 3.33 | 0.1669 | 0.0078 | |||
| WMT / Walmart Inc. | 0.00 | 0.00 | 0.24 | 11.52 | 0.1622 | 0.0183 | |||
| IEMG / iShares, Inc. - iShares Core MSCI Emerging Markets ETF | 0.00 | 7.03 | 0.24 | 19.00 | 0.1599 | 0.0272 | |||
| CPB / The Campbell's Company | 0.01 | 0.00 | 0.23 | -23.03 | 0.1569 | -0.0450 | |||
| BKNG / Booking Holdings Inc. | 0.00 | 0.23 | 0.1552 | 0.1552 | |||||
| PPG / PPG Industries, Inc. | 0.00 | 0.00 | 0.23 | 4.13 | 0.1525 | 0.0076 | |||
| MA / Mastercard Incorporated | 0.00 | 0.00 | 0.22 | 2.28 | 0.1507 | 0.0055 | |||
| DOW / Dow Inc. | 0.01 | 0.00 | 0.22 | -24.07 | 0.1503 | -0.0455 | |||
| ETN / Eaton Corporation plc | 0.00 | 0.22 | 0.1467 | 0.1467 | |||||
| BSJP / Invesco BulletShares 2025 High Yield Corporate Bond ETF | 0.01 | 0.00 | 0.21 | 0.48 | 0.1401 | 0.0018 | |||
| XLK / The Select Sector SPDR Trust - The Technology Select Sector SPDR Fund | 0.00 | 59.20 | 0.20 | 336.96 | 0.1351 | 0.0899 | |||
| MCO / Moody's Corporation | 0.00 | 0.00 | 0.20 | 110.53 | 0.1345 | 0.0410 | |||
| PDBC / Invesco Optimum Yield Diversified Commodity Strategy No K-1 ETF | 0.01 | 0.00 | 0.16 | -4.68 | 0.1099 | -0.0036 | |||
| HURN / Huron Consulting Group Inc. | 0.00 | -100.00 | 0.00 | 0.0000 | |||||
| SNA / Snap-on Incorporated | 0.00 | -100.00 | 0.00 | 0.0000 | |||||
| ENR / Energizer Holdings, Inc. | 0.00 | -100.00 | 0.00 | 0.0000 |