BridgeBio Pharma, Inc.
Pengenalan
Halaman ini menyediakan analisis menyeluruh tentang sejarah dagangan orang dalam yang diketahui Henry R Kravis. Orang dalam ialah pegawai, pengarah atau pelabur penting dalam syarikat. Adalah haram bagi orang dalam untuk membuat perdagangan dalam syarikat mereka berdasarkan maklumat khusus bukan awam. Ini tidak bermakna haram bagi mereka untuk membuat sebarang perdagangan dalam syarikat mereka sendiri. Tetapi mereka mesti melaporkan semua perdagangan kepada SEC melalui Borang 4. Walaupun terdapat sekatan ini, penyelidikan akademik menunjukkan bahawa orang dalam - secara amnya - cenderung untuk mengatasi prestasi pasaran dalam syarikat mereka sendiri.
Purata Keuntungan Perdagangan
Purata keuntungan perdagangan ialah purata pulangan semua pembelian pasaran terbuka yang dibuat oleh orang dalam dalam tempoh tiga tahun terakhir. Untuk mengira ini, kami memeriksa setiap pembelian pasaran terbuka yang tidak dirancang oleh orang dalam, tidak termasuk semua dagangan yang ditandakan sebagai sebahagian daripada pelan dagangan 10b5-1. Kami kemudian mengira prestasi purata dagangan tersebut sepanjang 3, 6 dan 12 bulan, dengan purata setiap tempoh tersebut untuk menjana metrik prestasi akhir bagi setiap dagangan. Akhir sekali, kami puratakan semua metrik prestasi untuk mengira metrik prestasi untuk orang dalam. Senarai ini hanya termasuk orang dalam yang telah membuat sekurang-kurangnya tiga dagangan dalam dua tahun lepas.
Jika keuntungan berdagang orang dalam ini ialah "N/A", maka orang dalam sama ada tidak membuat sebarang pembelian pasaran terbuka dalam tempoh tiga tahun terakhir, atau dagangan yang mereka buat adalah terlalu baru untuk mengira metrik prestasi yang boleh dipercayai.
Kekerapan Kemas Kini: Harian
Syarikat dengan Kedudukan Orang Dalam yang Dilaporkan
Pemfailan SEC menunjukkan Henry R Kravis telah melaporkan pegangan atau perdagangan dalam syarikat berikut:
Bagaimana Mentafsir Carta
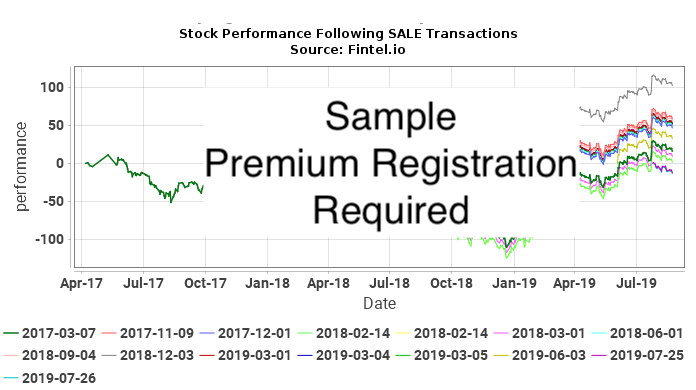
Carta berikut menunjukkan prestasi saham sekuriti selepas setiap dagangan pasaran terbuka dan tidak dirancang yang dibuat oleh Henry R Kravis. Perdagangan tidak dirancang ialah dagangan yang tidak dibuat sebagai sebahagian daripada pelan dagangan 10b5-1. Prestasi saham dicatatkan sebagai perubahan peratus kumulatif dalam harga saham. Sebagai contoh, jika perdagangan orang dalam dibuat pada 1 Januari 2019, carta akan menunjukkan perubahan peratusan harian sekuriti kepada hari ini. Jika harga saham naik dari $10 kepada $15 pada masa ini, perubahan peratus terkumpul dalam harga saham ialah 50%. Perubahan dalam harga daripada $10 kepada $20 ialah 100% dan perubahan dalam harga $10 hingga $5 ialah -50%.
Secara dasarnya, kami cuba untuk menentukan sejauh mana dagangan orang dalam berkait rapat dengan pulangan berlebihan (positif atau negatif) dalam harga saham untuk melihat sama ada orang dalam menetapkan masa dagangan mereka untuk mendapat keuntungan daripada maklumat orang dalam. Pertimbangkan situasi di mana orang dalam melakukan perkara ini. Dalam keadaan ini, kami menjangkakan sama ada (a) pulangan positif selepas pembelian, atau (b) pulangan negatif selepas jualan. Dalam kes (a), carta PEMBELIAN akan menunjukkan satu siri keluk condong ke atas, menunjukkan pulangan positif selepas setiap transaksi pembelian. Dalam kes (b), carta JUALAN akan menunjukkan satu siri keluk condong ke bawah, menunjukkan pulangan negatif selepas setiap transaksi jualan.
Walau bagaimanapun, ini sahaja tidak cukup untuk membuat kesimpulan. Jika, sebagai contoh, harga saham syarikat berada dalam pendakian bukan disebabkan kitaran selama bertahun-tahun, maka kami menjangkakan semua plot selepas pembelian akan condong ke atas. Begitu juga, kemerosotan bukan disebabkan kitaran selama bertahun-tahun akan mengakibatkan plot pasca perdagangan condong ke bawah. Kedua-dua carta ini tidak akan mencadangkan aktiviti perdagangan orang dalam.
Penunjuk terkuat ialah keadaan di mana harga saham adalah sangat kitaran, dan terdapat kedua-dua isyarat positif dalam carta PEMBELIAN dan plot negatif pada carta JUALAN. Situasi ini akan sangat menunjukkan orang dalam yang menentukan masa perdagangan untuk kelebihan kewangan mereka.
Pembelian Orang Dalam BBIO / BridgeBio Pharma, Inc. - Analisis Keuntungan Jangka Pendek
Dalam bahagian ini, kami menganalisis keuntungan setiap pembelian orang dalam pasaran terbuka yang tidak dirancang yang dibuat dalam BBIO / BridgeBio Pharma, Inc.. Analisis ini membantu untuk memahami sama ada orang dalam secara konsisten menjana pulangan tidak normal dan patut diikuti. Analisis ini adalah untuk satu tahun selepas setiap perdagangan, dan hasilnya adalah bersifat teori .
Jadual berikut menunjukkan pembelian pasaran terbuka terkini yang bukan sebahagian daripada pelan dagangan automatik.
| Tarikh Dagangan | Simbol Saham | Orang dalam | Saham Dilaporkan |
Harga Dilaporkan |
Saham Dilaraskan |
Harga Dilaraskan |
Asas Kos | Hari ke Maks |
Harga pada Maks |
Maks Keuntungan ($) |
Pulangan Maks (%) |
|---|---|---|---|---|---|---|---|---|---|---|---|
| 2019-07-01 | BBIO | KKR Genetic Disorder L.P. | 2,647,100 | 17.0000 | 2,647,100 | 17.0000 | 45,000,700 | 175 | 46.63 | 78,433,573 | 174.29 |
Harga Larasan ialah harga larasan berpecah. Saham Larasan ialah saham terlaras berpecah.
Jualan Orang Dalam BBIO / BridgeBio Pharma, Inc. - Analisis Kerugian Jangka Pendek
Dalam bahagian ini, kami menganalisis pengelakan kerugian jangka pendek bagi setiap jualan dalaman pasaran terbuka yang tidak dirancang yang dibuat dalam BBIO / BridgeBio Pharma, Inc.. Corak pengelakan kerugian yang konsisten mungkin mencadangkan bahawa urus niaga jualan masa hadapan mungkin meramalkan penurunan harga. Analisis ini adalah untuk satu tahun selepas setiap perdagangan, dan hasilnya adalah teori .
Jadual berikut menunjukkan jualan pasaran terbuka terkini yang bukan sebahagian daripada pelan dagangan automatik.
Harga Larasan ialah harga larasan berpecah. Saham Larasan ialah saham terlaras berpecah.
Pembelian Orang Dalam BTSGU / BrightSpring Health Services, Inc. - Analisis Keuntungan Jangka Pendek
Dalam bahagian ini, kami menganalisis keuntungan setiap pembelian orang dalam pasaran terbuka yang tidak dirancang yang dibuat dalam BBIO / BridgeBio Pharma, Inc.. Analisis ini membantu untuk memahami sama ada orang dalam secara konsisten menjana pulangan tidak normal dan patut diikuti. Analisis ini adalah untuk satu tahun selepas setiap perdagangan, dan hasilnya adalah bersifat teori .
Jadual berikut menunjukkan pembelian pasaran terbuka terkini yang bukan sebahagian daripada pelan dagangan automatik.
| Tarikh Dagangan | Simbol Saham | Orang dalam | Saham Dilaporkan |
Harga Dilaporkan |
Saham Dilaraskan |
Harga Dilaraskan |
Asas Kos | Hari ke Maks |
Harga pada Maks |
Maks Keuntungan ($) |
Pulangan Maks (%) |
|---|---|---|---|---|---|---|---|---|---|---|---|
| 2024-09-11 | BTSG | KKR Fund Holdings L.P. | 11,619,998 | 11.1300 | 11,619,998 | 11.1300 | 129,330,578 | 345 | 24.8700 | 159,658,773 | 123.45 |
Harga Larasan ialah harga larasan berpecah. Saham Larasan ialah saham terlaras berpecah.
Jualan Orang Dalam BTSGU / BrightSpring Health Services, Inc. - Analisis Kerugian Jangka Pendek
Dalam bahagian ini, kami menganalisis pengelakan kerugian jangka pendek bagi setiap jualan dalaman pasaran terbuka yang tidak dirancang yang dibuat dalam BBIO / BridgeBio Pharma, Inc.. Corak pengelakan kerugian yang konsisten mungkin mencadangkan bahawa urus niaga jualan masa hadapan mungkin meramalkan penurunan harga. Analisis ini adalah untuk satu tahun selepas setiap perdagangan, dan hasilnya adalah teori .
Jadual berikut menunjukkan jualan pasaran terbuka terkini yang bukan sebahagian daripada pelan dagangan automatik.
| Tarikh Dagangan | Simbol Saham | Orang dalam | Saham Dilaporkan |
Harga Dilaporkan |
Saham Dilaraskan |
Harga Dilaraskan |
Asas Kos | Hari ke Min |
Harga pada Min |
Kerugian Maks Dielakkan ($) |
Kerugian Maks Dielakkan (%) |
|---|---|---|---|---|---|---|---|---|---|---|---|
| 2025-06-12 | BTSG | KKR Fund Holdings L.P. | 13,288,101 | 21.1519 | 13,288,101 | 21.1519 | 281,068,584 | 53 | 19.3600 | -23,810,948 | -8.47 |
Harga Larasan ialah harga larasan berpecah. Saham Larasan ialah saham terlaras berpecah.
Pembelian Orang Dalam BV / BrightView Holdings, Inc. - Analisis Keuntungan Jangka Pendek
Dalam bahagian ini, kami menganalisis keuntungan setiap pembelian orang dalam pasaran terbuka yang tidak dirancang yang dibuat dalam BBIO / BridgeBio Pharma, Inc.. Analisis ini membantu untuk memahami sama ada orang dalam secara konsisten menjana pulangan tidak normal dan patut diikuti. Analisis ini adalah untuk satu tahun selepas setiap perdagangan, dan hasilnya adalah bersifat teori .
Jadual berikut menunjukkan pembelian pasaran terbuka terkini yang bukan sebahagian daripada pelan dagangan automatik.
| Tarikh Dagangan | Simbol Saham | Orang dalam | Saham Dilaporkan |
Harga Dilaporkan |
Saham Dilaraskan |
Harga Dilaraskan |
Asas Kos | Hari ke Maks |
Harga pada Maks |
Maks Keuntungan ($) |
Pulangan Maks (%) |
|---|---|---|---|---|---|---|---|
| Tiada dagangan pasaran terbuka tidak dirancang yang tidak diketahui untuk gabungan orang dalam dan sekuriti ini |
Harga Larasan ialah harga larasan berpecah. Saham Larasan ialah saham terlaras berpecah.
Jualan Orang Dalam BV / BrightView Holdings, Inc. - Analisis Kerugian Jangka Pendek
Dalam bahagian ini, kami menganalisis pengelakan kerugian jangka pendek bagi setiap jualan dalaman pasaran terbuka yang tidak dirancang yang dibuat dalam BBIO / BridgeBio Pharma, Inc.. Corak pengelakan kerugian yang konsisten mungkin mencadangkan bahawa urus niaga jualan masa hadapan mungkin meramalkan penurunan harga. Analisis ini adalah untuk satu tahun selepas setiap perdagangan, dan hasilnya adalah teori .
Jadual berikut menunjukkan jualan pasaran terbuka terkini yang bukan sebahagian daripada pelan dagangan automatik.
Harga Larasan ialah harga larasan berpecah. Saham Larasan ialah saham terlaras berpecah.
Pembelian Orang Dalam CHRS / Coherus Oncology, Inc. - Analisis Keuntungan Jangka Pendek
Dalam bahagian ini, kami menganalisis keuntungan setiap pembelian orang dalam pasaran terbuka yang tidak dirancang yang dibuat dalam BBIO / BridgeBio Pharma, Inc.. Analisis ini membantu untuk memahami sama ada orang dalam secara konsisten menjana pulangan tidak normal dan patut diikuti. Analisis ini adalah untuk satu tahun selepas setiap perdagangan, dan hasilnya adalah bersifat teori .
Jadual berikut menunjukkan pembelian pasaran terbuka terkini yang bukan sebahagian daripada pelan dagangan automatik.
| Tarikh Dagangan | Simbol Saham | Orang dalam | Saham Dilaporkan |
Harga Dilaporkan |
Saham Dilaraskan |
Harga Dilaraskan |
Asas Kos | Hari ke Maks |
Harga pada Maks |
Maks Keuntungan ($) |
Pulangan Maks (%) |
|---|---|---|---|---|---|---|---|
| Tiada dagangan pasaran terbuka tidak dirancang yang tidak diketahui untuk gabungan orang dalam dan sekuriti ini |
Harga Larasan ialah harga larasan berpecah. Saham Larasan ialah saham terlaras berpecah.
Jualan Orang Dalam CHRS / Coherus Oncology, Inc. - Analisis Kerugian Jangka Pendek
Dalam bahagian ini, kami menganalisis pengelakan kerugian jangka pendek bagi setiap jualan dalaman pasaran terbuka yang tidak dirancang yang dibuat dalam BBIO / BridgeBio Pharma, Inc.. Corak pengelakan kerugian yang konsisten mungkin mencadangkan bahawa urus niaga jualan masa hadapan mungkin meramalkan penurunan harga. Analisis ini adalah untuk satu tahun selepas setiap perdagangan, dan hasilnya adalah teori .
Jadual berikut menunjukkan jualan pasaran terbuka terkini yang bukan sebahagian daripada pelan dagangan automatik.
| Tarikh Dagangan | Simbol Saham | Orang dalam | Saham Dilaporkan |
Harga Dilaporkan |
Saham Dilaraskan |
Harga Dilaraskan |
Asas Kos | Hari ke Min |
Harga pada Min |
Kerugian Maks Dielakkan ($) |
Kerugian Maks Dielakkan (%) |
|---|---|---|---|---|---|---|---|
| Tiada dagangan pasaran terbuka tidak dirancang yang tidak diketahui untuk gabungan orang dalam dan sekuriti ini |
Harga Larasan ialah harga larasan berpecah. Saham Larasan ialah saham terlaras berpecah.
Pembelian Orang Dalam COOP / Mr. Cooper Group Inc. - Analisis Keuntungan Jangka Pendek
Dalam bahagian ini, kami menganalisis keuntungan setiap pembelian orang dalam pasaran terbuka yang tidak dirancang yang dibuat dalam BBIO / BridgeBio Pharma, Inc.. Analisis ini membantu untuk memahami sama ada orang dalam secara konsisten menjana pulangan tidak normal dan patut diikuti. Analisis ini adalah untuk satu tahun selepas setiap perdagangan, dan hasilnya adalah bersifat teori .
Jadual berikut menunjukkan pembelian pasaran terbuka terkini yang bukan sebahagian daripada pelan dagangan automatik.
| Tarikh Dagangan | Simbol Saham | Orang dalam | Saham Dilaporkan |
Harga Dilaporkan |
Saham Dilaraskan |
Harga Dilaraskan |
Asas Kos | Hari ke Maks |
Harga pada Maks |
Maks Keuntungan ($) |
Pulangan Maks (%) |
|---|---|---|---|---|---|---|---|---|---|---|---|
| 2018-07-31 | WMIH | KKR Fund Holdings L.P. | 21,197,619 | 21,197,619 | 20 |
Harga Larasan ialah harga larasan berpecah. Saham Larasan ialah saham terlaras berpecah.
Jualan Orang Dalam COOP / Mr. Cooper Group Inc. - Analisis Kerugian Jangka Pendek
Dalam bahagian ini, kami menganalisis pengelakan kerugian jangka pendek bagi setiap jualan dalaman pasaran terbuka yang tidak dirancang yang dibuat dalam BBIO / BridgeBio Pharma, Inc.. Corak pengelakan kerugian yang konsisten mungkin mencadangkan bahawa urus niaga jualan masa hadapan mungkin meramalkan penurunan harga. Analisis ini adalah untuk satu tahun selepas setiap perdagangan, dan hasilnya adalah teori .
Jadual berikut menunjukkan jualan pasaran terbuka terkini yang bukan sebahagian daripada pelan dagangan automatik.
Harga Larasan ialah harga larasan berpecah. Saham Larasan ialah saham terlaras berpecah.
Pembelian Orang Dalam CRGY / Crescent Energy Company - Analisis Keuntungan Jangka Pendek
Dalam bahagian ini, kami menganalisis keuntungan setiap pembelian orang dalam pasaran terbuka yang tidak dirancang yang dibuat dalam BBIO / BridgeBio Pharma, Inc.. Analisis ini membantu untuk memahami sama ada orang dalam secara konsisten menjana pulangan tidak normal dan patut diikuti. Analisis ini adalah untuk satu tahun selepas setiap perdagangan, dan hasilnya adalah bersifat teori .
Jadual berikut menunjukkan pembelian pasaran terbuka terkini yang bukan sebahagian daripada pelan dagangan automatik.
| Tarikh Dagangan | Simbol Saham | Orang dalam | Saham Dilaporkan |
Harga Dilaporkan |
Saham Dilaraskan |
Harga Dilaraskan |
Asas Kos | Hari ke Maks |
Harga pada Maks |
Maks Keuntungan ($) |
Pulangan Maks (%) |
|---|---|---|---|---|---|---|---|
| Tiada dagangan pasaran terbuka tidak dirancang yang tidak diketahui untuk gabungan orang dalam dan sekuriti ini |
Harga Larasan ialah harga larasan berpecah. Saham Larasan ialah saham terlaras berpecah.
Jualan Orang Dalam CRGY / Crescent Energy Company - Analisis Kerugian Jangka Pendek
Dalam bahagian ini, kami menganalisis pengelakan kerugian jangka pendek bagi setiap jualan dalaman pasaran terbuka yang tidak dirancang yang dibuat dalam BBIO / BridgeBio Pharma, Inc.. Corak pengelakan kerugian yang konsisten mungkin mencadangkan bahawa urus niaga jualan masa hadapan mungkin meramalkan penurunan harga. Analisis ini adalah untuk satu tahun selepas setiap perdagangan, dan hasilnya adalah teori .
Jadual berikut menunjukkan jualan pasaran terbuka terkini yang bukan sebahagian daripada pelan dagangan automatik.
Harga Larasan ialah harga larasan berpecah. Saham Larasan ialah saham terlaras berpecah.
Pembelian Orang Dalam DZSIQ / DZS Inc. - Analisis Keuntungan Jangka Pendek
Dalam bahagian ini, kami menganalisis keuntungan setiap pembelian orang dalam pasaran terbuka yang tidak dirancang yang dibuat dalam BBIO / BridgeBio Pharma, Inc.. Analisis ini membantu untuk memahami sama ada orang dalam secara konsisten menjana pulangan tidak normal dan patut diikuti. Analisis ini adalah untuk satu tahun selepas setiap perdagangan, dan hasilnya adalah bersifat teori .
Jadual berikut menunjukkan pembelian pasaran terbuka terkini yang bukan sebahagian daripada pelan dagangan automatik.
| Tarikh Dagangan | Simbol Saham | Orang dalam | Saham Dilaporkan |
Harga Dilaporkan |
Saham Dilaraskan |
Harga Dilaraskan |
Asas Kos | Hari ke Maks |
Harga pada Maks |
Maks Keuntungan ($) |
Pulangan Maks (%) |
|---|---|---|---|---|---|---|---|
| Tiada dagangan pasaran terbuka tidak dirancang yang tidak diketahui untuk gabungan orang dalam dan sekuriti ini |
Harga Larasan ialah harga larasan berpecah. Saham Larasan ialah saham terlaras berpecah.
Jualan Orang Dalam DZSIQ / DZS Inc. - Analisis Kerugian Jangka Pendek
Dalam bahagian ini, kami menganalisis pengelakan kerugian jangka pendek bagi setiap jualan dalaman pasaran terbuka yang tidak dirancang yang dibuat dalam BBIO / BridgeBio Pharma, Inc.. Corak pengelakan kerugian yang konsisten mungkin mencadangkan bahawa urus niaga jualan masa hadapan mungkin meramalkan penurunan harga. Analisis ini adalah untuk satu tahun selepas setiap perdagangan, dan hasilnya adalah teori .
Jadual berikut menunjukkan jualan pasaran terbuka terkini yang bukan sebahagian daripada pelan dagangan automatik.
| Tarikh Dagangan | Simbol Saham | Orang dalam | Saham Dilaporkan |
Harga Dilaporkan |
Saham Dilaraskan |
Harga Dilaraskan |
Asas Kos | Hari ke Min |
Harga pada Min |
Kerugian Maks Dielakkan ($) |
Kerugian Maks Dielakkan (%) |
|---|---|---|---|---|---|---|---|
| Tiada dagangan pasaran terbuka tidak dirancang yang tidak diketahui untuk gabungan orang dalam dan sekuriti ini |
Harga Larasan ialah harga larasan berpecah. Saham Larasan ialah saham terlaras berpecah.
Pembelian Orang Dalam EYE / National Vision Holdings, Inc. - Analisis Keuntungan Jangka Pendek
Dalam bahagian ini, kami menganalisis keuntungan setiap pembelian orang dalam pasaran terbuka yang tidak dirancang yang dibuat dalam BBIO / BridgeBio Pharma, Inc.. Analisis ini membantu untuk memahami sama ada orang dalam secara konsisten menjana pulangan tidak normal dan patut diikuti. Analisis ini adalah untuk satu tahun selepas setiap perdagangan, dan hasilnya adalah bersifat teori .
Jadual berikut menunjukkan pembelian pasaran terbuka terkini yang bukan sebahagian daripada pelan dagangan automatik.
| Tarikh Dagangan | Simbol Saham | Orang dalam | Saham Dilaporkan |
Harga Dilaporkan |
Saham Dilaraskan |
Harga Dilaraskan |
Asas Kos | Hari ke Maks |
Harga pada Maks |
Maks Keuntungan ($) |
Pulangan Maks (%) |
|---|---|---|---|---|---|---|---|
| Tiada dagangan pasaran terbuka tidak dirancang yang tidak diketahui untuk gabungan orang dalam dan sekuriti ini |
Harga Larasan ialah harga larasan berpecah. Saham Larasan ialah saham terlaras berpecah.
Jualan Orang Dalam EYE / National Vision Holdings, Inc. - Analisis Kerugian Jangka Pendek
Dalam bahagian ini, kami menganalisis pengelakan kerugian jangka pendek bagi setiap jualan dalaman pasaran terbuka yang tidak dirancang yang dibuat dalam BBIO / BridgeBio Pharma, Inc.. Corak pengelakan kerugian yang konsisten mungkin mencadangkan bahawa urus niaga jualan masa hadapan mungkin meramalkan penurunan harga. Analisis ini adalah untuk satu tahun selepas setiap perdagangan, dan hasilnya adalah teori .
Jadual berikut menunjukkan jualan pasaran terbuka terkini yang bukan sebahagian daripada pelan dagangan automatik.
Harga Larasan ialah harga larasan berpecah. Saham Larasan ialah saham terlaras berpecah.
Pembelian Orang Dalam KRP / Kimbell Royalty Partners, LP - Limited Partnership - Analisis Keuntungan Jangka Pendek
Dalam bahagian ini, kami menganalisis keuntungan setiap pembelian orang dalam pasaran terbuka yang tidak dirancang yang dibuat dalam BBIO / BridgeBio Pharma, Inc.. Analisis ini membantu untuk memahami sama ada orang dalam secara konsisten menjana pulangan tidak normal dan patut diikuti. Analisis ini adalah untuk satu tahun selepas setiap perdagangan, dan hasilnya adalah bersifat teori .
Jadual berikut menunjukkan pembelian pasaran terbuka terkini yang bukan sebahagian daripada pelan dagangan automatik.
| Tarikh Dagangan | Simbol Saham | Orang dalam | Saham Dilaporkan |
Harga Dilaporkan |
Saham Dilaraskan |
Harga Dilaraskan |
Asas Kos | Hari ke Maks |
Harga pada Maks |
Maks Keuntungan ($) |
Pulangan Maks (%) |
|---|---|---|---|---|---|---|---|
| Tiada dagangan pasaran terbuka tidak dirancang yang tidak diketahui untuk gabungan orang dalam dan sekuriti ini |
Harga Larasan ialah harga larasan berpecah. Saham Larasan ialah saham terlaras berpecah.
Jualan Orang Dalam KRP / Kimbell Royalty Partners, LP - Limited Partnership - Analisis Kerugian Jangka Pendek
Dalam bahagian ini, kami menganalisis pengelakan kerugian jangka pendek bagi setiap jualan dalaman pasaran terbuka yang tidak dirancang yang dibuat dalam BBIO / BridgeBio Pharma, Inc.. Corak pengelakan kerugian yang konsisten mungkin mencadangkan bahawa urus niaga jualan masa hadapan mungkin meramalkan penurunan harga. Analisis ini adalah untuk satu tahun selepas setiap perdagangan, dan hasilnya adalah teori .
Jadual berikut menunjukkan jualan pasaran terbuka terkini yang bukan sebahagian daripada pelan dagangan automatik.
Harga Larasan ialah harga larasan berpecah. Saham Larasan ialah saham terlaras berpecah.
Pembelian Orang Dalam LAUR / Laureate Education, Inc. - Analisis Keuntungan Jangka Pendek
Dalam bahagian ini, kami menganalisis keuntungan setiap pembelian orang dalam pasaran terbuka yang tidak dirancang yang dibuat dalam BBIO / BridgeBio Pharma, Inc.. Analisis ini membantu untuk memahami sama ada orang dalam secara konsisten menjana pulangan tidak normal dan patut diikuti. Analisis ini adalah untuk satu tahun selepas setiap perdagangan, dan hasilnya adalah bersifat teori .
Jadual berikut menunjukkan pembelian pasaran terbuka terkini yang bukan sebahagian daripada pelan dagangan automatik.
Harga Larasan ialah harga larasan berpecah. Saham Larasan ialah saham terlaras berpecah.
Jualan Orang Dalam LAUR / Laureate Education, Inc. - Analisis Kerugian Jangka Pendek
Dalam bahagian ini, kami menganalisis pengelakan kerugian jangka pendek bagi setiap jualan dalaman pasaran terbuka yang tidak dirancang yang dibuat dalam BBIO / BridgeBio Pharma, Inc.. Corak pengelakan kerugian yang konsisten mungkin mencadangkan bahawa urus niaga jualan masa hadapan mungkin meramalkan penurunan harga. Analisis ini adalah untuk satu tahun selepas setiap perdagangan, dan hasilnya adalah teori .
Jadual berikut menunjukkan jualan pasaran terbuka terkini yang bukan sebahagian daripada pelan dagangan automatik.
Harga Larasan ialah harga larasan berpecah. Saham Larasan ialah saham terlaras berpecah.
Pembelian Orang Dalam OI / O-I Glass, Inc. - Analisis Keuntungan Jangka Pendek
Dalam bahagian ini, kami menganalisis keuntungan setiap pembelian orang dalam pasaran terbuka yang tidak dirancang yang dibuat dalam BBIO / BridgeBio Pharma, Inc.. Analisis ini membantu untuk memahami sama ada orang dalam secara konsisten menjana pulangan tidak normal dan patut diikuti. Analisis ini adalah untuk satu tahun selepas setiap perdagangan, dan hasilnya adalah bersifat teori .
Jadual berikut menunjukkan pembelian pasaran terbuka terkini yang bukan sebahagian daripada pelan dagangan automatik.
| Tarikh Dagangan | Simbol Saham | Orang dalam | Saham Dilaporkan |
Harga Dilaporkan |
Saham Dilaraskan |
Harga Dilaraskan |
Asas Kos | Hari ke Maks |
Harga pada Maks |
Maks Keuntungan ($) |
Pulangan Maks (%) |
|---|---|---|---|---|---|---|---|
| Tiada dagangan pasaran terbuka tidak dirancang yang tidak diketahui untuk gabungan orang dalam dan sekuriti ini |
Harga Larasan ialah harga larasan berpecah. Saham Larasan ialah saham terlaras berpecah.
Jualan Orang Dalam OI / O-I Glass, Inc. - Analisis Kerugian Jangka Pendek
Dalam bahagian ini, kami menganalisis pengelakan kerugian jangka pendek bagi setiap jualan dalaman pasaran terbuka yang tidak dirancang yang dibuat dalam BBIO / BridgeBio Pharma, Inc.. Corak pengelakan kerugian yang konsisten mungkin mencadangkan bahawa urus niaga jualan masa hadapan mungkin meramalkan penurunan harga. Analisis ini adalah untuk satu tahun selepas setiap perdagangan, dan hasilnya adalah teori .
Jadual berikut menunjukkan jualan pasaran terbuka terkini yang bukan sebahagian daripada pelan dagangan automatik.
Harga Larasan ialah harga larasan berpecah. Saham Larasan ialah saham terlaras berpecah.
Pembelian Orang Dalam SONO / Sonos, Inc. - Analisis Keuntungan Jangka Pendek
Dalam bahagian ini, kami menganalisis keuntungan setiap pembelian orang dalam pasaran terbuka yang tidak dirancang yang dibuat dalam BBIO / BridgeBio Pharma, Inc.. Analisis ini membantu untuk memahami sama ada orang dalam secara konsisten menjana pulangan tidak normal dan patut diikuti. Analisis ini adalah untuk satu tahun selepas setiap perdagangan, dan hasilnya adalah bersifat teori .
Jadual berikut menunjukkan pembelian pasaran terbuka terkini yang bukan sebahagian daripada pelan dagangan automatik.
| Tarikh Dagangan | Simbol Saham | Orang dalam | Saham Dilaporkan |
Harga Dilaporkan |
Saham Dilaraskan |
Harga Dilaraskan |
Asas Kos | Hari ke Maks |
Harga pada Maks |
Maks Keuntungan ($) |
Pulangan Maks (%) |
|---|---|---|---|---|---|---|---|
| Tiada dagangan pasaran terbuka tidak dirancang yang tidak diketahui untuk gabungan orang dalam dan sekuriti ini |
Harga Larasan ialah harga larasan berpecah. Saham Larasan ialah saham terlaras berpecah.
Jualan Orang Dalam SONO / Sonos, Inc. - Analisis Kerugian Jangka Pendek
Dalam bahagian ini, kami menganalisis pengelakan kerugian jangka pendek bagi setiap jualan dalaman pasaran terbuka yang tidak dirancang yang dibuat dalam BBIO / BridgeBio Pharma, Inc.. Corak pengelakan kerugian yang konsisten mungkin mencadangkan bahawa urus niaga jualan masa hadapan mungkin meramalkan penurunan harga. Analisis ini adalah untuk satu tahun selepas setiap perdagangan, dan hasilnya adalah teori .
Jadual berikut menunjukkan jualan pasaran terbuka terkini yang bukan sebahagian daripada pelan dagangan automatik.
Harga Larasan ialah harga larasan berpecah. Saham Larasan ialah saham terlaras berpecah.
Pembelian Orang Dalam USFD / US Foods Holding Corp. - Analisis Keuntungan Jangka Pendek
Dalam bahagian ini, kami menganalisis keuntungan setiap pembelian orang dalam pasaran terbuka yang tidak dirancang yang dibuat dalam BBIO / BridgeBio Pharma, Inc.. Analisis ini membantu untuk memahami sama ada orang dalam secara konsisten menjana pulangan tidak normal dan patut diikuti. Analisis ini adalah untuk satu tahun selepas setiap perdagangan, dan hasilnya adalah bersifat teori .
Jadual berikut menunjukkan pembelian pasaran terbuka terkini yang bukan sebahagian daripada pelan dagangan automatik.
| Tarikh Dagangan | Simbol Saham | Orang dalam | Saham Dilaporkan |
Harga Dilaporkan |
Saham Dilaraskan |
Harga Dilaraskan |
Asas Kos | Hari ke Maks |
Harga pada Maks |
Maks Keuntungan ($) |
Pulangan Maks (%) |
|---|---|---|---|---|---|---|---|
| Tiada dagangan pasaran terbuka tidak dirancang yang tidak diketahui untuk gabungan orang dalam dan sekuriti ini |
Harga Larasan ialah harga larasan berpecah. Saham Larasan ialah saham terlaras berpecah.
Jualan Orang Dalam USFD / US Foods Holding Corp. - Analisis Kerugian Jangka Pendek
Dalam bahagian ini, kami menganalisis pengelakan kerugian jangka pendek bagi setiap jualan dalaman pasaran terbuka yang tidak dirancang yang dibuat dalam BBIO / BridgeBio Pharma, Inc.. Corak pengelakan kerugian yang konsisten mungkin mencadangkan bahawa urus niaga jualan masa hadapan mungkin meramalkan penurunan harga. Analisis ini adalah untuk satu tahun selepas setiap perdagangan, dan hasilnya adalah teori .
Jadual berikut menunjukkan jualan pasaran terbuka terkini yang bukan sebahagian daripada pelan dagangan automatik.
Harga Larasan ialah harga larasan berpecah. Saham Larasan ialah saham terlaras berpecah.
Sejarah Dagangan Orang Dalam
Jadual ini menunjukkan senarai lengkap dagangan orang dalam yang dibuat oleh Henry R Kravis seperti yang didedahkan kepada Suruhanjaya Bursa Sekuriti (SEC).
| Tarikh Fail | Tarikh Tran | Borang | Simbol Saham | Sekuriti | Kod | Saham | Baki Saham | Peratus Ubah |
Saham harga |
Tran Nilai |
Baki Nilai |
|
|---|---|---|---|---|---|---|---|---|---|---|---|---|
| 2025-09-03 |
|
4 | NONE |
KKR Real Estate Select Trust Inc.
Class I Common Stock, par value $0.001 per share |
J - Other | 57,813 | 10,772,216 | 0.54 | 23.71 | 1,370,744 | 255,409,240 | |
| 2025-08-04 |
|
4 | NONE |
KKR Real Estate Select Trust Inc.
Class I Common Stock, par value $0.001 per share |
J - Other | 56,795 | 10,714,403 | 0.53 | 23.84 | 1,353,988 | 255,431,369 | |
| 2025-07-23 | 3 | NIQ |
NIQ Global Intelligence plc
Ordinary Shares |
30,022,789 | ||||||||
| 2025-07-02 |
|
4 | NONE |
KKR Real Estate Select Trust Inc.
Class I Common Stock, par value $0.001 per share |
J - Other | 121,083 | 10,657,608 | 1.15 | 23.96 | 2,901,156 | 255,356,293 | |
| 2025-06-26 |
|
4 | BTSG |
BrightSpring Health Services, Inc.
Common Stock |
S - Sale | -2,100,000 | 77,096,337 | -2.65 | 21.15 | -44,418,990 | 1,630,734,011 | |
| 2025-06-16 |
|
4 | BTSG |
BrightSpring Health Services, Inc.
Common Stock |
G - Gift | -51,364 | 0 | -100.00 | ||||
| 2025-06-16 |
|
4 | BTSG |
BrightSpring Health Services, Inc.
Common Stock |
G - Gift | -60,002 | 0 | -100.00 | ||||
| 2025-06-16 |
|
4 | BTSG |
BrightSpring Health Services, Inc.
Common Stock |
J - Other | -475,546 | 79,196,337 | -0.60 | ||||
| 2025-06-16 |
|
4 | BTSG |
BrightSpring Health Services, Inc.
Common Stock |
S - Sale | -13,288,101 | 79,671,883 | -14.29 | 21.15 | -281,068,584 | 1,685,211,702 | |
| 2025-06-10 |
|
4 | BV |
BrightView Holdings, Inc.
Common Stock |
S - Sale | -11,600,000 | 21,533,123 | -35.01 | 14.40 | -167,040,000 | 310,076,971 | |
| 2025-06-03 |
|
4 | NONE |
KKR Real Estate Select Trust Inc.
Class I Common Stock, par value $0.001 per share |
J - Other | 55,537 | 10,536,525 | 0.53 | 23.92 | 1,328,447 | 252,033,676 | |
| 2025-06-02 |
|
4 | KKR |
KKR & Co. Inc.
Common Stock |
S - Sale | -130,925 | 0 | -100.00 | 121.67 | -15,929,645 | ||
| 2025-06-02 |
|
4 | KKR |
KKR & Co. Inc.
Common Stock |
S - Sale | -1,150,469 | 73,006,022 | -1.55 | 119.80 | -137,826,186 | 8,746,121,436 | |
| 2025-05-16 | 3 | HSIC |
HENRY SCHEIN INC
Common Stock |
15,263,662 | ||||||||
| 2025-05-16 | 3 | HSIC |
HENRY SCHEIN INC
Common Stock |
388,370 | ||||||||
| 2025-05-16 |
|
4 | KKR |
KKR & Co. Inc.
Common Stock |
J - Other | -250,377 | 1,549,369 | -13.91 | ||||
| 2025-05-14 |
|
4 | BBIO |
BridgeBio Pharma, Inc.
Common Stock |
S - Sale | -6,000,000 | 13,260,971 | -31.15 | 34.20 | -205,200,000 | 453,525,208 | |
| 2025-05-02 |
|
4 | NONE |
KKR Real Estate Select Trust Inc.
Class I Common Stock, par value $0.001 per share |
J - Other | 52,614 | 10,480,988 | 0.50 | 24.26 | 1,276,412 | 254,268,765 | |
| 2025-04-30 | 3 | NONE |
Capital Group KKR Multi-Sector (plus)
Class F-3 Shares of Beneficial Interest |
7,500,000 | ||||||||
| 2025-04-30 | 3 | NONE |
Capital Group KKR Core Plus (plus)
Class F-3 Shares of Beneficial Interest |
7,500,000 | ||||||||
| 2025-04-08 |
|
4 | CRGY |
Crescent Energy Co
Class A Common Stock |
C - Conversion | 26,185,773 | 26,185,773 | |||||
| 2025-04-08 |
|
4 | CRGY |
Crescent Energy Co
Class B Common Stock |
J - Other | -26,185,773 | 0 | -100.00 | ||||
| 2025-04-02 |
|
4 | NONE |
KKR Real Estate Select Trust Inc.
Class I Common Stock, par value $0.001 per share |
J - Other | 117,903 | 10,428,374 | 1.14 | 24.47 | 2,885,086 | 255,182,312 | |
| 2025-03-14 |
|
4 | KKR |
KKR & Co. Inc.
Common Stock |
G - Gift | -208,676 | 0 | -100.00 | ||||
| 2025-03-11 |
|
4 | CRGY |
Crescent Energy Co
Class A Common Stock |
S - Sale | -2,948,723 | 0 | -100.00 | 9.91 | -29,221,845 | ||
| 2025-03-11 |
|
4 | CRGY |
Crescent Energy Co
Class A Common Stock |
C - Conversion | 2,948,723 | 2,948,723 | |||||
| 2025-03-11 |
|
4 | CRGY |
Crescent Energy Co
Class B Common Stock |
J - Other | -2,948,723 | 26,185,773 | -10.12 | ||||
| 2025-03-07 |
|
4 | BBIO |
BridgeBio Pharma, Inc.
Common Stock |
S - Sale | -6,000,000 | 19,260,971 | -23.75 | 32.96 | -197,760,000 | 634,841,604 | |
| 2025-03-04 |
|
4 | NONE |
KKR Real Estate Select Trust Inc.
Class I Common Stock, par value $0.001 per share |
J - Other | 47,996 | 10,310,471 | 0.47 | 24.70 | 1,185,496 | 254,668,634 | |
| 2025-02-04 |
|
4 | NONE |
KKR Real Estate Select Trust Inc.
Class I Common Stock, par value $0.001 per share |
J - Other | 52,975 | 10,262,475 | 0.52 | 24.73 | 1,310,078 | 253,791,011 | |
| 2025-01-03 |
|
4 | NONE |
KKR Real Estate Select Trust Inc.
Class I Common Stock, par value $0.001 per share |
J - Other | 102,613 | 10,209,500 | 1.02 | 24.86 | 2,550,963 | 253,808,169 | |
| 2024-12-03 |
|
4 | NONE |
KKR Real Estate Select Trust Inc.
Class I Common Stock, par value $0.001 per share |
J - Other | 50,100 | 10,106,887 | 0.50 | 25.18 | 1,261,520 | 254,491,409 | |
| 2024-11-29 |
|
4 | OS |
OneStream, Inc.
Class A Common Stock |
S - Sale | -22,308 | 0 | -100.00 | 29.99 | -669,073 | ||
| 2024-11-29 |
|
4 | OS |
OneStream, Inc.
Class A Common Stock |
S - Sale | -20,963 | 0 | -100.00 | 29.99 | -628,733 | ||
| 2024-11-29 |
|
4 | OS |
OneStream, Inc.
Class A Common Stock |
S - Sale | -139,876 | 0 | -100.00 | 29.99 | -4,195,231 | ||
| 2024-11-29 |
|
4 | OS |
OneStream, Inc.
Class A Common Stock |
S - Sale | -104,100 | 0 | -100.00 | 29.99 | -3,122,219 | ||
| 2024-11-29 |
|
4 | OS |
OneStream, Inc.
Class A Common Stock |
S - Sale | -14,871 | 0 | -100.00 | 29.99 | -446,018 | ||
| 2024-11-29 |
|
4 | OS |
OneStream, Inc.
Class A Common Stock |
S - Sale | -30,640 | 0 | -100.00 | 29.99 | -918,970 | ||
| 2024-11-29 |
|
4 | OS |
OneStream, Inc.
Class A Common Stock |
S - Sale | -43,129 | 0 | -100.00 | 29.99 | -1,293,547 | ||
| 2024-11-29 |
|
4 | OS |
OneStream, Inc.
Class A Common Stock |
S - Sale | -1,704 | 0 | -100.00 | 29.99 | -51,107 | ||
| 2024-11-29 |
|
4 | OS |
OneStream, Inc.
Class A Common Stock |
S - Sale | -64,021 | 0 | -100.00 | 29.99 | -1,920,150 | ||
| 2024-11-29 |
|
4 | OS |
OneStream, Inc.
Class A Common Stock |
S - Sale | -514,850 | 0 | -100.00 | 29.99 | -15,441,639 | ||
| 2024-11-29 |
|
4 | OS |
OneStream, Inc.
Class A Common Stock |
C - Conversion | 22,308 | 22,308 | |||||
| 2024-11-29 |
|
4 | OS |
OneStream, Inc.
Class A Common Stock |
C - Conversion | 20,963 | 20,963 | |||||
| 2024-11-29 |
|
4 | OS |
OneStream, Inc.
Class A Common Stock |
C - Conversion | 139,876 | 139,876 | |||||
| 2024-11-29 |
|
4 | OS |
OneStream, Inc.
Class A Common Stock |
C - Conversion | 104,100 | 104,100 | |||||
| 2024-11-29 |
|
4 | OS |
OneStream, Inc.
Class A Common Stock |
C - Conversion | 14,871 | 14,871 | |||||
| 2024-11-29 |
|
4 | OS |
OneStream, Inc.
Class A Common Stock |
C - Conversion | 30,640 | 30,640 | |||||
| 2024-11-29 |
|
4 | OS |
OneStream, Inc.
Class A Common Stock |
C - Conversion | 43,129 | 43,129 | |||||
| 2024-11-29 |
|
4 | OS |
OneStream, Inc.
Class A Common Stock |
C - Conversion | 1,704 | 1,704 | |||||
| 2024-11-29 |
|
4 | OS |
OneStream, Inc.
Class A Common Stock |
C - Conversion | 64,021 | 64,021 | |||||
| 2024-11-29 |
|
4 | OS |
OneStream, Inc.
Class A Common Stock |
C - Conversion | 514,850 | 514,850 | |||||
| 2024-11-25 |
|
4 | APP |
AppLovin Corp
Class A Common Stock |
G - Gift | -11,377 | 0 | -100.00 | ||||
| 2024-11-25 |
|
4 | APP |
AppLovin Corp
Class A Common Stock |
G - Gift | -5,685 | 0 | -100.00 | ||||
| 2024-11-25 |
|
4 | APP |
AppLovin Corp
Class A Common Stock |
J - Other | -68,037 | 0 | -100.00 | ||||
| 2024-11-25 |
|
4 | APP |
AppLovin Corp
Class A Common Stock |
S - Sale | -200 | 68,037 | -0.29 | 329.06 | -65,812 | 22,388,255 | |
| 2024-11-25 |
|
4 | APP |
AppLovin Corp
Class A Common Stock |
S - Sale | -5,841 | 68,237 | -7.88 | 327.88 | -1,915,161 | 22,373,711 | |
| 2024-11-25 |
|
4 | APP |
AppLovin Corp
Class A Common Stock |
S - Sale | -34,757 | 74,078 | -31.94 | 326.92 | -11,362,891 | 24,217,861 | |
| 2024-11-25 |
|
4 | APP |
AppLovin Corp
Class A Common Stock |
S - Sale | -98,528 | 108,835 | -47.51 | 325.84 | -32,104,413 | 35,462,851 | |
| 2024-11-25 |
|
4 | APP |
AppLovin Corp
Class A Common Stock |
S - Sale | -178,893 | 207,363 | -46.31 | 324.94 | -58,129,241 | 67,380,243 | |
| 2024-11-25 |
|
4 | APP |
AppLovin Corp
Class A Common Stock |
S - Sale | -217,168 | 386,256 | -35.99 | 323.90 | -70,340,802 | 125,108,473 | |
| 2024-11-25 |
|
4 | APP |
AppLovin Corp
Class A Common Stock |
S - Sale | -104,577 | 603,424 | -14.77 | 322.98 | -33,776,332 | 194,894,185 | |
| 2024-11-25 |
|
4 | APP |
AppLovin Corp
Class A Common Stock |
S - Sale | -53,121 | 708,001 | -6.98 | 321.91 | -17,100,117 | 227,911,752 | |
| 2024-11-25 |
|
4 | APP |
AppLovin Corp
Class A Common Stock |
S - Sale | -75,952 | 761,122 | -9.07 | 321.02 | -24,382,050 | 244,334,776 | |
| 2024-11-25 |
|
4 | APP |
AppLovin Corp
Class A Common Stock |
S - Sale | -164,923 | 837,074 | -16.46 | 319.81 | -52,743,843 | 267,703,715 | |
| 2024-11-25 |
|
4 | APP |
AppLovin Corp
Class A Common Stock |
S - Sale | -212,136 | 1,001,997 | -17.47 | 318.80 | -67,628,363 | 319,433,838 | |
| 2024-11-25 |
|
4 | APP |
AppLovin Corp
Class A Common Stock |
S - Sale | -120,493 | 1,214,133 | -9.03 | 317.84 | -38,297,833 | 385,903,432 | |
| 2024-11-25 |
|
4 | APP |
AppLovin Corp
Class A Common Stock |
S - Sale | -113,953 | 1,334,626 | -7.87 | 316.89 | -36,110,840 | 422,932,836 | |
| 2024-11-25 |
|
4 | APP |
AppLovin Corp
Class A Common Stock |
S - Sale | -71,838 | 1,448,579 | -4.72 | 315.69 | -22,678,459 | 457,300,311 | |
| 2024-11-25 |
|
4 | APP |
AppLovin Corp
Class A Common Stock |
S - Sale | -23,291 | 1,520,417 | -1.51 | 315.04 | -7,337,699 | 478,998,862 | |
| 2024-11-25 |
|
4 | APP |
AppLovin Corp
Class A Common Stock |
S - Sale | -6,900 | 1,543,708 | -0.44 | 313.82 | -2,165,366 | 484,448,297 | |
| 2024-11-25 |
|
4 | APP |
AppLovin Corp
Class A Common Stock |
S - Sale | -5,122 | 1,550,608 | -0.33 | 312.83 | -1,602,306 | 485,073,754 | |
| 2024-11-25 |
|
4 | APP |
AppLovin Corp
Class A Common Stock |
S - Sale | -4,897 | 1,555,730 | -0.31 | 311.84 | -1,527,078 | 485,138,065 | |
| 2024-11-25 |
|
4 | APP |
AppLovin Corp
Class A Common Stock |
S - Sale | -5,410 | 1,560,627 | -0.35 | 310.16 | -1,677,952 | 484,040,169 | |
| 2024-11-25 |
|
4 | APP |
AppLovin Corp
Class A Common Stock |
S - Sale | -2,000 | 1,566,037 | -0.13 | 309.00 | -618,002 | 483,906,999 | |
| 2024-11-25 |
|
4 | APP |
AppLovin Corp
Class A Common Stock |
S - Sale | -3,774,246 | 1,568,037 | -70.65 | 305.57 | -1,153,296,350 | 479,145,066 | |
| 2024-11-25 |
|
4 | APP |
AppLovin Corp
Class A Common Stock |
C - Conversion | 5,205,489 | 5,342,283 | 3,805.35 | ||||
| 2024-11-18 |
|
4 | OS |
OneStream, Inc.
Class A Common Stock |
S - Sale | -148,719 | 0 | -100.00 | 29.99 | -4,460,455 | ||
| 2024-11-18 |
|
4 | OS |
OneStream, Inc.
Class A Common Stock |
S - Sale | -139,753 | 0 | -100.00 | 29.99 | -4,191,542 | ||
| 2024-11-18 |
|
4 | OS |
OneStream, Inc.
Class A Common Stock |
S - Sale | -932,505 | 0 | -100.00 | 29.99 | -27,968,156 | ||
| 2024-11-18 |
|
4 | OS |
OneStream, Inc.
Class A Common Stock |
S - Sale | -693,998 | 0 | -100.00 | 29.99 | -20,814,735 | ||
| 2024-11-18 |
|
4 | OS |
OneStream, Inc.
Class A Common Stock |
S - Sale | -99,143 | 0 | -100.00 | 29.99 | -2,973,546 | ||
| 2024-11-18 |
|
4 | OS |
OneStream, Inc.
Class A Common Stock |
S - Sale | -204,269 | 0 | -100.00 | 29.99 | -6,126,538 | ||
| 2024-11-18 |
|
4 | OS |
OneStream, Inc.
Class A Common Stock |
S - Sale | -287,524 | 0 | -100.00 | 29.99 | -8,623,564 | ||
| 2024-11-18 |
|
4 | OS |
OneStream, Inc.
Class A Common Stock |
S - Sale | -11,359 | 0 | -100.00 | 29.99 | -340,685 | ||
| 2024-11-18 |
|
4 | OS |
OneStream, Inc.
Class A Common Stock |
S - Sale | -426,807 | 0 | -100.00 | 29.99 | -12,801,009 | ||
| 2024-11-18 |
|
4 | OS |
OneStream, Inc.
Class A Common Stock |
S - Sale | -3,432,334 | 0 | -100.00 | 29.99 | -102,944,277 | ||
| 2024-11-18 |
|
4 | OS |
OneStream, Inc.
Class A Common Stock |
C - Conversion | 148,719 | 148,719 | |||||
| 2024-11-18 |
|
4 | OS |
OneStream, Inc.
Class A Common Stock |
C - Conversion | 139,753 | 139,753 | |||||
| 2024-11-18 |
|
4 | OS |
OneStream, Inc.
Class A Common Stock |
C - Conversion | 932,505 | 932,505 | |||||
| 2024-11-18 |
|
4 | OS |
OneStream, Inc.
Class A Common Stock |
C - Conversion | 693,998 | 693,998 | |||||
| 2024-11-18 |
|
4 | OS |
OneStream, Inc.
Class A Common Stock |
C - Conversion | 99,143 | 99,143 | |||||
| 2024-11-18 |
|
4 | OS |
OneStream, Inc.
Class A Common Stock |
C - Conversion | 204,269 | 204,269 | |||||
| 2024-11-18 |
|
4 | OS |
OneStream, Inc.
Class A Common Stock |
C - Conversion | 287,524 | 287,524 | |||||
| 2024-11-18 |
|
4 | OS |
OneStream, Inc.
Class A Common Stock |
C - Conversion | 11,359 | 11,359 | |||||
| 2024-11-18 |
|
4 | OS |
OneStream, Inc.
Class A Common Stock |
C - Conversion | 426,807 | 426,807 | |||||
| 2024-11-18 |
|
4 | OS |
OneStream, Inc.
Class A Common Stock |
C - Conversion | 3,432,334 | 3,432,334 | |||||
| 2024-11-04 |
|
4 | NONE |
KKR Real Estate Select Trust Inc.
Class I Common Stock, par value $0.001 per share |
J - Other | 51,469 | 10,056,787 | 0.51 | 25.21 | 1,297,526 | 253,531,593 | |
| 2024-10-02 |
|
4 | NONE |
KKR Real Estate Select Trust Inc.
Class I Common Stock, par value $0.001 per share |
J - Other | 104,407 | 10,005,318 | 1.05 | 25.32 | 2,643,574 | 253,334,652 | |
| 2024-09-17 |
|
4 | BBIO |
BridgeBio Pharma, Inc.
Common Stock |
S - Sale | -5,800,000 | 25,260,971 | -18.67 | 25.75 | -149,350,000 | 650,470,003 | |
| 2024-09-13 |
|
4 | BTSG |
BrightSpring Health Services, Inc.
Common Stock |
P - Purchase | 11,619,998 | 92,959,984 | 14.29 | 11.13 | 129,330,578 | 1,034,644,622 | |
| 2024-09-04 |
|
4 | NONE |
KKR Real Estate Select Trust Inc.
Class I Common Stock, par value $0.001 per share |
J - Other | 51,129 | 9,900,911 | 0.52 | 25.39 | 1,298,174 | 251,384,142 | |
| 2024-08-02 |
|
4 | NONE |
KKR Real Estate Select Trust Inc.
Class I Common Stock, par value $0.001 per share |
J - Other | 51,305 | 9,849,782 | 0.52 | 25.52 | 1,309,301 | 251,366,440 | |
| 2024-07-29 |
|
4 | OS |
OneStream, Inc.
Class A Common Stock |
S - Sale | -59,582 | 0 | -100.00 | 18.85 | -1,123,121 | ||
| 2024-07-29 |
|
4 | OS |
OneStream, Inc.
Class A Common Stock |
C - Conversion | 59,582 | 59,582 | |||||
| 2024-07-29 |
|
4 | OS |
OneStream, Inc.
Class A Common Stock |
S - Sale | -55,990 | 0 | -100.00 | 18.85 | -1,055,412 | ||
| 2024-07-29 |
|
4 | OS |
OneStream, Inc.
Class A Common Stock |
C - Conversion | 55,990 | 55,990 | |||||
| 2024-07-29 |
|
4 | OS |
OneStream, Inc.
Class A Common Stock |
S - Sale | -373,599 | 0 | -100.00 | 18.85 | -7,042,341 | ||
| 2024-07-29 |
|
4 | OS |
OneStream, Inc.
Class A Common Stock |
C - Conversion | 373,599 | 373,599 | |||||
| 2024-07-29 |
|
4 | OS |
OneStream, Inc.
Class A Common Stock |
S - Sale | -278,043 | 0 | -100.00 | 18.85 | -5,241,111 | ||
| 2024-07-29 |
|
4 | OS |
OneStream, Inc.
Class A Common Stock |
C - Conversion | 278,043 | 278,043 | |||||
| 2024-07-29 |
|
4 | OS |
OneStream, Inc.
Class A Common Stock |
S - Sale | -39,720 | 0 | -100.00 | 18.85 | -748,722 | ||
| 2024-07-29 |
|
4 | OS |
OneStream, Inc.
Class A Common Stock |
C - Conversion | 39,720 | 39,720 | |||||
| 2024-07-29 |
|
4 | OS |
OneStream, Inc.
Class A Common Stock |
S - Sale | -81,838 | 0 | -100.00 | 18.85 | -1,542,646 | ||
| 2024-07-29 |
|
4 | OS |
OneStream, Inc.
Class A Common Stock |
C - Conversion | 81,838 | 81,838 | |||||
| 2024-07-29 |
|
4 | OS |
OneStream, Inc.
Class A Common Stock |
S - Sale | -115,193 | 0 | -100.00 | 18.85 | -2,171,388 | ||
| 2024-07-29 |
|
4 | OS |
OneStream, Inc.
Class A Common Stock |
C - Conversion | 115,193 | 115,193 | |||||
| 2024-07-29 |
|
4 | OS |
OneStream, Inc.
Class A Common Stock |
S - Sale | -4,551 | 0 | -100.00 | 18.85 | -85,786 | ||
| 2024-07-29 |
|
4 | OS |
OneStream, Inc.
Class A Common Stock |
C - Conversion | 4,551 | 4,551 | |||||
| 2024-07-29 |
|
4 | OS |
OneStream, Inc.
Class A Common Stock |
S - Sale | -170,996 | 0 | -100.00 | 18.85 | -3,223,275 | ||
| 2024-07-29 |
|
4 | OS |
OneStream, Inc.
Class A Common Stock |
C - Conversion | 170,996 | 170,996 | |||||
| 2024-07-29 |
|
4 | OS |
OneStream, Inc.
Class A Common Stock |
S - Sale | -1,375,132 | 0 | -100.00 | 18.85 | -25,921,238 | ||
| 2024-07-29 |
|
4 | OS |
OneStream, Inc.
Class A Common Stock |
C - Conversion | 1,375,132 | 1,375,132 | |||||
| 2024-07-02 |
|
4 | NONE |
KKR Real Estate Select Trust Inc.
Class I Common Stock, par value $0.001 per share |
J - Other | 109,860 | 9,798,477 | 1.13 | 25.62 | 2,814,606 | 251,036,987 | |
| 2024-06-20 |
|
4 | TGAN |
Transphorm, Inc.
Common Stock |
S - Sale | -24,411,968 | 0 | -100.00 | 5.10 | -124,501,037 | ||
| 2024-06-06 |
|
4 | NONE |
KKR Real Estate Select Trust Inc.
Class I Common Stock, par value $0.001 per share |
P - Purchase | 1,956,182 | 9,688,618 | 25.30 | 25.56 | 50,000,000 | 247,641,064 | |
| 2024-06-04 |
|
4 | NONE |
KKR Real Estate Select Trust Inc.
Class I Common Stock, par value $0.001 per share |
J - Other | 49,899 | 7,732,436 | 0.65 | 25.56 | 1,275,422 | 197,641,064 | |
| 2024-05-28 |
|
4 | BV |
BrightView Holdings, Inc.
Common Stock |
S - Sale | -17,500,000 | 33,133,123 | -34.56 | 12.48 | -218,400,000 | 413,501,375 | |
| 2024-05-15 |
|
4 | APP |
AppLovin Corp
Class A Common Stock |
G - Gift | -38,308 | 0 | -100.00 | ||||
| 2024-05-15 |
|
4 | APP |
AppLovin Corp
Class A Common Stock |
G - Gift | -19,789 | 0 | -100.00 | ||||
| 2024-05-15 |
|
4 | APP |
AppLovin Corp
Class A Common Stock |
J - Other | -229,773 | 136,794 | -62.68 | ||||
| 2024-05-15 |
|
4 | APP |
AppLovin Corp
Class A Common Stock |
S - Sale | -17,500,000 | 366,567 | -97.95 | 83.36 | -1,458,800,000 | 30,557,025 | |
| 2024-05-15 |
|
4 | APP |
AppLovin Corp
Class A Common Stock |
C - Conversion | 17,700,000 | 17,866,567 | 10,626.35 | ||||
| 2024-05-02 |
|
4 | NONE |
KKR Real Estate Select Trust Inc.
Class I Common Stock, par value $0.001 per share |
J - Other | 48,296 | 7,682,537 | 0.63 | 25.94 | 1,252,792 | 199,285,006 | |
| 2024-04-03 |
|
4 | CRGY |
Crescent Energy Co
Class A Common Stock |
S - Sale | -6,000,000 | 0 | -100.00 | 10.74 | -64,440,000 | ||
| 2024-04-03 |
|
4 | CRGY |
Crescent Energy Co
Class A Common Stock |
C - Conversion | 6,000,000 | 6,000,000 | |||||
| 2024-04-03 |
|
4 | CRGY |
Crescent Energy Co
Class B Common Stock |
J - Other | -6,000,000 | 29,134,496 | -17.08 | ||||
| 2024-04-01 |
|
4 | NONE |
KKR Real Estate Select Trust Inc.
Class I Common Stock, par value $0.001 per share |
J - Other | 105,080 | 7,634,241 | 1.40 | 26.07 | 2,739,447 | 199,024,665 | |
| 2024-03-28 |
|
4 | NONE |
KKR FS Income Trust Select
Common Shares of Ben. Interest, par value $0.01 per share |
P - Purchase | 571,429 | 1,000,687 | 133.12 | 25.00 | 14,285,714 | 25,017,184 | |
| 2024-03-15 |
|
4 | NONE |
KKR FS Income Trust Select
Common Shares of Ben. Interest, par value $0.01 per share |
P - Purchase | 286,402 | 429,259 | 200.48 | 24.94 | 7,142,857 | 10,705,714 | |
| 2024-03-11 |
|
4 | CRGY |
Crescent Energy Co
Class A Common Stock |
S - Sale | -13,800,000 | 0 | -100.00 | 9.87 | -136,206,000 | ||
| 2024-03-11 |
|
4 | CRGY |
Crescent Energy Co
Class A Common Stock |
C - Conversion | 13,800,000 | 13,800,000 | |||||
| 2024-03-11 |
|
4 | CRGY |
Crescent Energy Co
Class B Common Stock |
J - Other | -13,800,000 | 35,134,496 | -28.20 | ||||
| 2024-03-11 |
|
4 | CRGY |
Crescent Energy Co
Class B Common Stock |
J - Other | -2,300,000 | 48,934,496 | -4.49 | ||||
| 2024-03-08 |
|
4 | APP |
AppLovin Corp
Class A Common Stock |
G - Gift | -46,812 | 0 | -100.00 | ||||
| 2024-03-08 |
|
4 | APP |
AppLovin Corp
Class A Common Stock |
G - Gift | -26,790 | 0 | -100.00 | ||||
| 2024-03-08 |
|
4 | APP |
AppLovin Corp
Class A Common Stock |
J - Other | -416,926 | 166,567 | -71.45 | ||||
| 2024-03-08 |
|
4 | APP |
AppLovin Corp
Class A Common Stock |
S - Sale | -19,866,397 | 583,493 | -97.15 | 54.46 | -1,081,923,981 | 31,777,029 | |
| 2024-03-08 |
|
4 | APP |
AppLovin Corp
Class A Common Stock |
C - Conversion | 16,000,000 | 20,449,890 | 359.56 | ||||
| 2024-03-08 |
|
4 | KKR |
KKR & Co. Inc.
Common Stock |
G - Gift | -500,000 | 5,810,000 | -7.92 | ||||
| 2024-03-05 | 3 | NONE |
KKR FS Income Trust Select
Common Shares of Ben. Interest, par value $0.01 per share |
142,857 | ||||||||
| 2024-03-04 |
|
4 | NONE |
KKR Real Estate Select Trust Inc.
Class I Common Stock, par value $0.001 per share |
J - Other | 47,431 | 7,529,161 | 0.63 | 26.52 | 1,257,878 | 199,673,341 | |
| 2024-02-02 |
|
4 | NONE |
KKR Real Estate Select Trust Inc.
Class I Common Stock, par value $0.001 per share |
J - Other | 51,232 | 7,481,729 | 0.69 | 26.82 | 1,374,041 | 200,659,982 | |
| 2024-01-26 | 3 | BTSG |
BrightSpring Health Services, Inc.
Common Stock |
81,339,986 | ||||||||
| 2024-01-03 |
|
4 | NONE |
KKR Real Estate Select Trust Inc.
Class I Common Stock, par value $0.001 per share |
J - Other | 105,913 | 7,430,497 | 1.45 | 27.00 | 2,859,642 | 200,623,431 | |
| 2023-12-04 |
|
4 | NONE |
KKR Real Estate Select Trust Inc.
Class I Common Stock, par value $0.001 per share |
J - Other | 50,810 | 7,324,585 | 0.70 | 27.65 | 1,404,890 | 202,524,769 | |
| 2023-11-17 |
|
4 | CRGY |
Crescent Energy Co
Class A Common Stock |
S - Sale | -3,000,000 | 0 | -100.00 | 10.90 | -32,700,000 | ||
| 2023-11-17 |
|
4 | CRGY |
Crescent Energy Co
Class A Common Stock |
C - Conversion | 3,000,000 | 3,000,000 | |||||
| 2023-11-17 |
|
4 | CRGY |
Crescent Energy Co
Class B Common Stock |
J - Other | -3,000,000 | 51,234,496 | -5.53 | ||||
| 2023-11-02 |
|
4 | NONE |
KKR Real Estate Select Trust Inc.
Class I Common Stock, par value $0.001 per share |
J - Other | 52,439 | 7,273,775 | 0.73 | 28.21 | 1,479,306 | 205,193,192 | |
| 2023-10-03 |
|
4 | NONE |
KKR Real Estate Select Trust Inc.
Class I Common Stock, par value $0.001 per share |
J - Other | 101,672 | 7,221,336 | 1.43 | 28.52 | 2,899,684 | 205,952,501 | |
| 2023-09-05 |
|
4 | NONE |
KKR Real Estate Select Trust Inc.
Class I Common Stock, par value $0.001 per share |
J - Other | 53,174 | 7,119,664 | 0.75 | 28.55 | 1,518,121 | 203,266,407 | |
| 2023-08-23 |
|
4 | APP |
AppLovin Corp
Class A Common Stock |
G - Gift | -6,546 | 0 | -100.00 | ||||
| 2023-08-23 |
|
4 | APP |
AppLovin Corp
Class A Common Stock |
J - Other | -120,437 | 4,449,890 | -2.64 | ||||
| 2023-08-23 |
|
4 | APP |
AppLovin Corp
Class A Common Stock |
S - Sale | -15,000,000 | 4,570,327 | -76.65 | 36.85 | -552,750,000 | 168,416,550 | |
| 2023-08-16 |
|
4 | APP |
AppLovin Corp
Class A Common Stock |
G - Gift | -4,052 | 0 | -100.00 | ||||
| 2023-08-16 |
|
4 | APP |
AppLovin Corp
Class A Common Stock |
J - Other | -74,569 | 19,570,327 | -0.38 | ||||
| 2023-08-16 |
|
4 | APP |
AppLovin Corp
Class A Common Stock |
S - Sale | -10,000,000 | 19,644,896 | -33.73 | 37.00 | -370,000,000 | 726,861,152 | |
| 2023-08-02 |
|
4 | NONE |
KKR Real Estate Select Trust Inc.
Class I Common Stock, par value $0.001 per share |
J - Other | 53,480 | 7,066,490 | 0.76 | 28.71 | 1,535,421 | 202,878,925 | |
| 2023-07-25 |
|
4 | TGAN |
Transphorm, Inc.
Common Stock |
P - Purchase | 1,735,988 | 24,411,968 | 7.66 | 3.30 | 5,728,760 | 80,559,494 | |
| 2023-07-05 |
|
4 | NONE |
KKR Real Estate Select Trust Inc.
Class I Common Stock, par value $0.001 per share |
J - Other | 114,048 | 7,013,010 | 1.65 | 28.85 | 3,290,274 | 202,325,325 | |
| 2023-07-05 |
|
4 | NONE |
KKR FS Income Trust
Common Shares of Beneficial Interest |
P - Purchase | 459,348 | 943,806 | 94.82 | 27.99 | 12,857,143 | 26,417,117 | |
| 2023-07-05 |
|
4 | CRGY |
Crescent Energy Co
Class A Common Stock |
J - Other | -27,597,199 | 0 | -100.00 | ||||
| 2023-07-05 |
|
4 | CRGY |
Crescent Energy Co
Class A Common Stock |
C - Conversion | 27,597,199 | 27,597,199 | |||||
| 2023-07-05 |
|
4 | CRGY |
Crescent Energy Co
Class B Common Stock |
J - Other | -27,597,199 | 54,234,496 | -33.72 | ||||
| 2023-06-05 |
|
4 | APP |
AppLovin Corp
Class A Common Stock |
G - Gift | -6,079 | 0 | -100.00 | ||||
| 2023-06-05 |
|
4 | APP |
AppLovin Corp
Class A Common Stock |
J - Other | -137,723 | 29,644,896 | -0.46 | ||||
| 2023-06-05 |
|
4 | APP |
AppLovin Corp
Class A Common Stock |
S - Sale | -15,000,000 | 29,782,619 | -33.50 | 23.00 | -345,000,000 | 685,000,237 | |
| 2023-06-02 |
|
4 | NONE |
KKR Real Estate Select Trust Inc.
Class I Common Stock, par value $0.001 per share |
J - Other | 55,244 | 6,898,962 | 0.81 | 29.26 | 1,616,451 | 201,863,626 | |
| 2023-06-01 |
|
4 | NONE |
KKR FS Income Trust
Common Shares of Beneficial Interest |
P - Purchase | 27,315 | 484,458 | 5.98 | 26.15 | 714,286 | 12,668,571 | |
| 2023-05-30 | 3 | NONE |
KKR FS Income Trust
Common Shares of Beneficial Interest |
457,143 | ||||||||
| 2023-05-19 |
|
4 | APP |
AppLovin Corp
Class A Common Stock |
S - Sale | -15,952,381 | 44,782,619 | -26.27 | 21.00 | -335,000,001 | 940,434,999 | |
| 2023-05-02 |
|
4 | NONE |
KKR Real Estate Select Trust Inc.
Class I Common Stock, par value $0.001 per share |
J - Other | 53,597 | 6,843,718 | 0.79 | 30.11 | 1,613,818 | 206,064,335 | |
| 2023-04-04 |
|
4 | NONE |
KKR Real Estate Select Trust Inc.
Class I Common Stock, par value $0.001 per share |
J - Other | 116,154 | 6,790,120 | 1.74 | 30.56 | 3,549,665 | 207,506,071 | |
| 2023-03-09 |
|
4 | USFD |
US Foods Holding Corp.
Common Stock |
S - Sale | -7,600,000 | 37 | -100.00 | 38.83 | -295,108,000 | 1,437 | |
| 2023-03-09 |
|
4 | USFD |
US Foods Holding Corp.
Common Stock |
C - Conversion | 7,600,037 | 7,600,037 | 21.50 | 163,400,796 | 163,400,796 | ||
| 2023-03-02 |
|
4 | NONE |
KKR Real Estate Select Trust Inc.
Class I Common Stock, par value $0.001 per share |
J - Other | 49,666 | 6,673,966 | 0.75 | 30.01 | 1,490,483 | 200,285,724 | |
| 2023-02-10 |
|
5 | FORG |
ForgeRock, Inc.
Class A Common Stock |
C - Conversion | 793,103 | 793,103 | |||||
| 2023-02-03 |
|
4 | KNBE |
KnowBe4, Inc.
Class A Common Stock |
D - Sale to Issuer | -12,048,193 | 0 | -100.00 | 24.90 | -300,000,006 | ||
| 2023-02-02 |
|
4 | NONE |
KKR Real Estate Select Trust Inc.
Class I Common Stock, par value $0.001 per share |
J - Other | 54,873 | 6,624,300 | 0.84 | 30.42 | 1,669,242 | 201,511,205 | |
| 2023-01-04 |
|
4 | NONE |
KKR Real Estate Select Trust Inc.
Class I Common Stock, par value $0.001 per share |
J - Other | 116,329 | 6,569,427 | 1.80 | 30.39 | 3,535,238 | 199,644,880 | |
| 2022-12-05 |
|
4 | KNBE |
KnowBe4, Inc.
Class A Common Stock |
C - Conversion | 12,048,193 | 12,048,193 | |||||
| 2022-12-02 |
|
4 | NONE |
KKR Real Estate Select Trust Inc.
Class I Common Stock, par value $0.001 per share |
J - Other | 52,818 | 6,453,098 | 0.83 | 30.84 | 1,628,892 | 199,013,536 | |
| 2022-11-22 |
|
4 | LAUR |
LAUREATE EDUCATION, INC.
Common Stock |
S - Sale | -1,050,119 | 0 | -100.00 | 9.41 | -9,880,570 | ||
| 2022-11-22 |
|
4 | LAUR |
LAUREATE EDUCATION, INC.
Common Stock |
S - Sale | -31,792,064 | 0 | -100.00 | 9.41 | -299,131,530 | ||
| 2022-11-02 |
|
4 | NONE |
KKR Real Estate Select Trust Inc.
Class I Common Stock, par value $0.001 per share |
J - Other | 52,184 | 6,400,280 | 0.82 | 31.33 | 1,634,935 | 200,520,781 | |
| 2022-10-04 |
|
4 | NONE |
KKR Real Estate Select Trust Inc.
Class I Common Stock, par value $0.001 per share |
J - Other | 93,314 | 6,348,096 | 1.49 | 31.37 | 2,927,271 | 199,139,770 | |
| 2022-09-15 |
|
4 | CRGY |
Crescent Energy Co
Class A Common Stock |
S - Sale | -5,750,000 | 572,354 | -90.95 | 14.10 | -81,075,000 | 8,070,191 | |
| 2022-09-15 |
|
4 | CRGY |
Crescent Energy Co
Class A Common Stock |
C - Conversion | 6,322,354 | 6,322,354 | |||||
| 2022-09-15 |
|
4 | CRGY |
Crescent Energy Co
Class B Common Stock |
J - Other | -6,322,354 | 81,831,695 | -7.17 | ||||
| 2022-09-02 |
|
4 | NONE |
KKR Real Estate Select Trust Inc.
Class I Common Stock, par value $0.001 per share |
J - Other | 46,868 | 6,254,782 | 0.75 | 31.50 | 1,476,329 | 197,025,621 | |
| 2022-08-02 |
|
4 | NONE |
KKR Real Estate Select Trust Inc.
Class I Common Stock, par value $0.001 per share |
J - Other | 44,980 | 6,207,914 | 0.73 | 31.34 | 1,409,668 | 194,556,025 | |
| 2022-07-05 |
|
4 | NONE |
KKR Real Estate Select Trust Inc.
Class I Common Stock, par value $0.001 per share |
J - Other | 54,955 | 6,162,934 | 0.90 | 32.11 | 1,764,592 | 197,891,816 | |
| 2022-06-09 |
|
4 | KREF |
KKR Real Estate Finance Trust Inc.
Common Stock |
S - Sale | -4,250,000 | 10,000,000 | -29.82 | 19.51 | -82,917,500 | 195,100,000 | |
| 2022-06-03 |
|
4 | TGAN |
Transphorm, Inc.
Common Stock |
X - Other | 500,000 | 22,675,980 | 2.25 | 5.00 | 2,500,000 | 113,379,900 | |
| 2022-06-02 |
|
4 | NONE |
KKR Real Estate Select Trust Inc.
Class I Common Stock, par value $0.001 per share |
J - Other | 19,367 | 6,107,980 | 0.32 | 32.49 | 629,239 | 198,448,257 | |
| 2022-05-31 |
|
4 | KKR |
KKR & Co. Inc.
Common Stock |
A - Award | 49,369 | 1,549,369 | 3.29 | ||||
| 2022-05-31 |
|
4 | KKR |
KKR & Co. Inc.
Common Stock |
M - Exercise | 1,500,000 | 1,500,000 | |||||
| 2022-05-31 |
|
4 | KKR |
KKR & Co. Inc.
Common Stock |
A - Award | 2,364,773 | 75,365,167 | 3.24 | ||||
| 2022-05-31 |
|
4 | KKR |
KKR & Co. Inc.
Common Stock |
M - Exercise | 71,849,925 | 73,000,394 | 6,245.27 | ||||
| 2022-05-31 |
|
4 | KKR |
KKR & Co. Inc.
Common Stock |
J - Other | 1,338 | 1,150,469 | 0.12 | ||||
| 2022-05-31 |
|
4 | KKR |
KKR & Co. Inc.
Common Stock |
G - Gift | -340,000 | 6,310,000 | -5.11 | ||||
| 2022-05-03 |
|
4 | NONE |
KKR Real Estate Select Trust Inc.
Class I Common Stock, par value $0.001 per share |
J - Other | 16,944 | 6,088,612 | 0.28 | 32.50 | 550,685 | 197,879,904 | |
| 2022-04-04 |
|
4 | NONE |
KKR Real Estate Select Trust Inc.
Class I Common Stock, par value $0.001 per share |
J - Other | 55,028 | 6,071,668 | 0.91 | 31.65 | 1,741,645 | 192,168,301 | |
| 2022-03-02 |
|
4 | NONE |
KKR Real Estate Select Trust Inc.
Class I Common Stock, par value $0.001 per share |
J - Other | 12,694 | 6,016,640 | 0.21 | 30.60 | 388,435 | 184,109,184 | |
| 2022-02-11 |
|
5 | KKR |
KKR & Co. Inc.
Common Stock |
G - Gift | -350,000 | 6,650,000 | -5.00 | ||||
| 2022-02-10 |
|
5 | IR |
Ingersoll Rand Inc.
Common Stock |
G - Gift | -17,449 | 0 | -100.00 | ||||
| 2022-02-02 |
|
4 | NONE |
KKR Real Estate Select Trust Inc.
Class I Common Stock, par value $0.001 per share |
J - Other | 12,663 | 6,003,946 | 0.21 | 29.82 | 377,615 | 179,037,671 | |
| 2022-01-04 |
|
4 | NONE |
KKR Real Estate Select Trust Inc.
Class I Common Stock, par value $0.001 per share |
J - Other | 35,974 | 5,991,283 | 0.60 | 29.49 | 1,060,875 | 176,682,932 | |
| 2021-12-09 |
|
4 | APP |
AppLovin Corp
Class B Common Stock |
C - Conversion | -69,145,000 | 38,905,489 | -63.99 | ||||
| 2021-12-09 |
|
4 | APP |
AppLovin Corp
Class A Common Stock |
S - Sale | -8,410,000 | 60,735,000 | -12.16 | 80.51 | -677,089,100 | 4,889,774,850 | |
| 2021-12-09 |
|
4 | APP |
AppLovin Corp
Class A Common Stock |
C - Conversion | 69,145,000 | 69,145,000 | |||||
| 2021-12-07 | 3 | CRGY |
Crescent Energy Co
Class B Common Stock |
88,154,049 | ||||||||
| 2021-11-17 |
|
4 | KNBE |
KnowBe4, Inc.
Class B Common Stock |
C - Conversion | -2,695,063 | 26,115,895 | -9.35 | ||||
| 2021-11-17 |
|
4 | KNBE |
KnowBe4, Inc.
Class A Common Stock |
S - Sale | -2,695,063 | 0 | -100.00 | 24.72 | -66,621,957 | ||
| 2021-11-17 |
|
4 | KNBE |
KnowBe4, Inc.
Class A Common Stock |
C - Conversion | 2,695,063 | 2,695,063 | |||||
| 2021-11-08 |
|
4 | NONE |
Transphorm, Inc.
Contractual Right to Purchase Warrant (Right to Buy) |
P - Purchase | 104,167 | 104,167 | |||||
| 2021-11-08 |
|
4 | NONE |
Transphorm, Inc.
Contractual Right to Purchase |
P - Purchase | 500,000 | 500,000 | |||||
| 2021-11-08 |
|
4 | NONE |
Transphorm, Inc.
Warrant (Right to Buy) |
P - Purchase | 208,333 | 208,333 | |||||
| 2021-11-08 |
|
4 | NONE |
Transphorm, Inc.
Common Stock |
P - Purchase | 1,000,000 | 22,175,980 | 4.72 | 5.00 | 5,000,000 | 110,879,900 | |
| 2021-11-05 |
|
4 | KKR |
KKR & Co. Inc.
Common Stock |
S - Sale | -4,667,166 | 0 | -100.00 | 82.25 | -383,874,404 | ||
| 2021-11-03 |
|
4 | KREF |
KKR Real Estate Finance Trust Inc.
Special Voting Preferred Stock |
C - Conversion | -1 | 0 | -100.00 | ||||
| 2021-11-03 |
|
4 | KREF |
KKR Real Estate Finance Trust Inc.
Common Stock |
C - Conversion | 1 | 1 | |||||
| 2021-11-01 |
|
4 | LAUR |
LAUREATE EDUCATION, INC.
Class B Common Stock |
C - Conversion | -699,340 | 0 | -100.00 | ||||
| 2021-11-01 |
|
4 | LAUR |
LAUREATE EDUCATION, INC.
Class B Common Stock |
C - Conversion | -15,374,715 | 0 | -100.00 | ||||
| 2021-11-01 |
|
4 | LAUR |
LAUREATE EDUCATION, INC.
Common Stock |
C - Conversion | 699,340 | 1,050,119 | 199.37 | ||||
| 2021-11-01 |
|
4 | LAUR |
LAUREATE EDUCATION, INC.
Common Stock |
C - Conversion | 15,374,715 | 31,792,064 | 93.65 | ||||
| 2021-10-04 |
|
4 | NONE |
KKR Real Estate Select Trust Inc.
Class I Common Stock, par value $0.001 per share |
J - Other | 20,872 | 5,955,309 | 0.35 | 28.33 | 591,313 | 168,713,899 | |
| 2021-10-01 |
|
4 | COTY |
COTY INC.
Series B Convertible Preferred Stock |
S - Sale | -290,465 | 277,902 | -51.11 | ||||
| 2021-09-22 |
|
4 | FORG |
ForgeRock, Inc.
Class B Common Stock |
J - Other | 5,287,352 | 5,287,352 | |||||
| 2021-09-22 |
|
4 | FORG |
ForgeRock, Inc.
Series E Convertible Preferred Stock |
C - Conversion | -2,591,935 | 0 | -100.00 | ||||
| 2021-09-22 |
|
4 | FORG |
ForgeRock, Inc.
Series D Convertible Preferred Stock |
C - Conversion | -2,695,417 | 0 | -100.00 | ||||
| 2021-09-22 |
|
4 | FORG |
ForgeRock, Inc.
Common Stock |
J - Other | -5,287,352 | 0 | -100.00 | ||||
| 2021-09-22 |
|
4 | FORG |
ForgeRock, Inc.
Common Stock |
C - Conversion | 2,591,935 | 5,287,352 | 96.16 | ||||
| 2021-09-22 |
|
4 | FORG |
ForgeRock, Inc.
Common Stock |
C - Conversion | 2,695,417 | 2,695,417 | |||||
| 2021-09-21 |
|
4 | ASO |
Academy Sports & Outdoors, Inc.
Common Stock |
S - Sale | -8,614,193 | 0 | -100.00 | 43.52 | -374,889,679 | ||
| 2021-09-21 |
|
4 | ASO |
Academy Sports & Outdoors, Inc.
Common Stock |
S - Sale | -6,670,127 | 0 | -100.00 | 43.52 | -290,283,927 | ||
| 2021-09-21 |
|
4 | ASO |
Academy Sports & Outdoors, Inc.
Common Stock |
S - Sale | -3,361,282 | 0 | -100.00 | 43.52 | -146,282,993 | ||
| 2021-09-10 |
|
4 | COTY |
COTY INC.
Class A Common Stock |
S - Sale | -50,000,088 | 0 | -100.00 | 8.39 | -419,500,738 | ||
| 2021-09-09 |
|
4 | COTY |
COTY INC.
Series B Convertible Preferred Stock |
C - Conversion | -285,576 | 568,367 | -33.44 | ||||
| 2021-09-09 |
|
4 | COTY |
COTY INC.
Class A Common Stock |
C - Conversion | 50,000,088 | 50,000,088 | 6.24 | 312,000,549 | 312,000,549 | ||
| 2021-08-18 |
|
4 | KNBE |
KnowBe4, Inc.
Class B Common Stock |
C - Conversion | -2,341,922 | 28,810,958 | -7.52 | ||||
| 2021-08-18 |
|
4 | KNBE |
KnowBe4, Inc.
Class A Common Stock |
S - Sale | -2,341,922 | 0 | -100.00 | 19.92 | -46,651,086 | ||
| 2021-08-18 |
|
4 | KNBE |
KnowBe4, Inc.
Class A Common Stock |
C - Conversion | 2,341,922 | 2,341,922 | |||||
| 2021-08-18 |
|
4 | NONE |
KKR Real Estate Select Trust Inc.
Class I Common Stock, par value $0.001 per share |
J - Other | 7,184 | 5,934,436 | 0.12 | 26.71 | 191,878 | 158,508,799 | |
| 2021-08-03 |
|
4 | COOP |
Mr. Cooper Group Inc.
Series A Convertible Preferred Stock |
S - Sale | -1,000,000 | 0 | -100.00 | 27.89 | -27,890,000 | ||
| 2021-08-03 |
|
4 | COOP |
Mr. Cooper Group Inc.
Common Stock |
S - Sale | -9,749,189 | 0 | -100.00 | 33.25 | -324,160,534 | ||
| 2021-08-03 |
|
4 | COOP |
Mr. Cooper Group Inc.
Common Stock |
S - Sale | -1,324,056 | 0 | -100.00 | 33.25 | -44,024,862 | ||
| 2021-07-14 |
|
4 | KRP |
Kimbell Royalty Partners, LP
Common units representing limited partner interests |
S - Sale | -63,906 | 202,170 | -24.02 | 12.20 | -779,653 | 2,466,474 | |
| 2021-07-14 |
|
4 | KRP |
Kimbell Royalty Partners, LP
Common units representing limited partner interests |
S - Sale | -936,094 | 2,961,389 | -24.02 | 12.20 | -11,420,347 | 36,128,946 | |
| 2021-07-14 |
|
4 | ASO |
Academy Sports & Outdoors, Inc.
Common Stock |
S - Sale | -4,666,158 | 8,614,193 | -35.14 | 38.30 | -178,713,851 | 329,923,592 | |
| 2021-07-14 |
|
4 | ASO |
Academy Sports & Outdoors, Inc.
Common Stock |
S - Sale | -3,613,093 | 6,670,127 | -35.14 | 38.30 | -138,381,462 | 255,465,864 | |
| 2021-07-14 |
|
4 | ASO |
Academy Sports & Outdoors, Inc.
Common Stock |
S - Sale | -1,820,749 | 3,361,282 | -35.14 | 38.30 | -69,734,687 | 128,737,101 | |
| 2021-07-08 |
|
4 | LAUR |
LAUREATE EDUCATION, INC.
Class B Common Stock |
C - Conversion | -62,758 | 699,340 | -8.23 | ||||
| 2021-07-08 |
|
4 | LAUR |
LAUREATE EDUCATION, INC.
Class B Common Stock |
C - Conversion | -2,937,242 | 15,374,715 | -16.04 | ||||
| 2021-07-08 |
|
4 | LAUR |
LAUREATE EDUCATION, INC.
Class A Common Stock |
C - Conversion | 62,758 | 62,758 | |||||
| 2021-07-08 |
|
4 | LAUR |
LAUREATE EDUCATION, INC.
Class A Common Stock |
C - Conversion | 2,937,242 | 2,937,242 | |||||
| 2021-06-24 |
|
4 | FOCS |
Focus Financial Partners Inc.
Units of Focus Financial Partners, LLC |
C - Conversion | -3,654,044 | 0 | -100.00 | ||||
| 2021-06-24 |
|
4 | FOCS |
Focus Financial Partners Inc.
Class A Common Stock |
S - Sale | -403,615 | 0 | -100.00 | 49.87 | -20,128,280 | ||
| 2021-06-24 |
|
4 | FOCS |
Focus Financial Partners Inc.
Class A Common Stock |
S - Sale | -3,086,585 | 0 | -100.00 | 49.87 | -153,927,994 | ||
| 2021-06-24 |
|
4 | FOCS |
Focus Financial Partners Inc.
Class A Common Stock |
S - Sale | -3,654,044 | 0 | -100.00 | 49.87 | -182,227,174 | ||
| 2021-06-24 |
|
4 | FOCS |
Focus Financial Partners Inc.
Class A Common Stock |
C - Conversion | 3,654,044 | 3,654,044 | |||||
| 2021-06-17 | 3 | MCF |
CONTANGO OIL & GAS CO
Common Stock |
0 | ||||||||
| 2021-05-28 |
|
4 | KREF |
KKR Real Estate Finance Trust Inc.
Common Stock |
S - Sale | -750,000 | 14,250,000 | -5.00 | 20.07 | -15,052,500 | 285,997,500 | |
| 2021-05-18 | 3 | NONE |
KKR Real Estate Select Trust Inc.
Common Stock |
5,927,253 | ||||||||
| 2021-05-17 |
|
4 | IR |
Ingersoll Rand Inc.
Common Stock |
J - Other | -75,919 | 29,788,635 | -0.25 | ||||
| 2021-05-17 |
|
4 | IR |
Ingersoll Rand Inc.
Common Stock |
S - Sale | -14,924,081 | 29,864,554 | -33.32 | 48.57 | -724,862,614 | 1,450,521,388 | |
| 2021-05-14 |
|
4 | KREF |
KKR Real Estate Finance Trust Inc.
Common Stock |
S - Sale | -5,000,000 | 15,000,000 | -25.00 | 20.07 | -100,350,000 | 301,050,000 | |
| 2021-05-12 |
|
4 | ASO |
Academy Sports & Outdoors, Inc.
Common Stock |
S - Sale | -6,052,145 | 13,280,351 | -31.31 | 30.96 | -187,374,409 | 411,159,667 | |
| 2021-05-12 |
|
4 | ASO |
Academy Sports & Outdoors, Inc.
Common Stock |
S - Sale | -4,686,289 | 10,283,220 | -31.31 | 30.96 | -145,087,507 | 318,368,491 | |
| 2021-05-12 |
|
4 | ASO |
Academy Sports & Outdoors, Inc.
Common Stock |
S - Sale | -2,361,566 | 5,182,031 | -31.31 | 30.96 | -73,114,083 | 160,435,680 | |
| 2021-05-04 |
|
4 | FISV |
FISERV INC
Common Stock |
S - Sale | -23,000,000 | 62,300,667 | -26.96 | 117.70 | -2,707,100,000 | 7,332,788,506 | |
| 2021-04-29 |
|
4 | IMPL |
IMPEL NEUROPHARMA INC
Series D Preferred Stock |
C - Conversion | -42,307,448 | 0 | -100.00 | ||||
| 2021-04-29 |
|
4 | IMPL |
IMPEL NEUROPHARMA INC
Common Stock |
P - Purchase | 1,100,000 | 3,802,638 | 40.70 | 15.00 | 16,500,000 | 57,039,570 | |
| 2021-04-29 |
|
4 | IMPL |
IMPEL NEUROPHARMA INC
Common Stock |
J - Other | 118,712 | 2,702,638 | 4.59 | 13.50 | 1,602,612 | 36,485,613 | |
| 2021-04-29 |
|
4 | IMPL |
IMPEL NEUROPHARMA INC
Common Stock |
C - Conversion | 2,583,926 | 2,583,926 | |||||
| 2021-04-28 |
|
4 | KNBE |
KnowBe4, Inc.
Class B Common Stock |
J - Other | 31,152,880 | 31,152,880 | |||||
| 2021-04-28 |
|
4 | KNBE |
KnowBe4, Inc.
Series C-1 Convertible Preferred Stock |
C - Conversion | -26,438,760 | 0 | -100.00 | ||||
| 2021-04-28 |
|
4 | KNBE |
KnowBe4, Inc.
Series C Convertible Preferred Stock |
C - Conversion | -4,431,800 | 0 | -100.00 | ||||
| 2021-04-28 |
|
4 | KNBE |
KnowBe4, Inc.
Common Stock |
J - Other | -31,152,880 | 0 | -100.00 | ||||
| 2021-04-28 |
|
4 | KNBE |
KnowBe4, Inc.
Common Stock |
C - Conversion | 26,438,760 | 31,152,880 | 560.84 | ||||
| 2021-04-28 |
|
4 | KNBE |
KnowBe4, Inc.
Common Stock |
C - Conversion | 4,431,800 | 4,714,120 | 1,569.78 | ||||
| 2021-04-26 |
|
4 | BCPL |
BC Partners Lending Corp
Common Stock |
P - Purchase | 11,433 | 413,949 | 2.84 | 26.24 | 300,000 | 10,862,030 | |
| 2021-04-21 |
|
4 | APP |
Applovin Corp
Class B Common Stock |
C - Conversion | -2,500,000 | 108,050,489 | -2.26 | ||||
| 2021-04-21 |
|
4 | APP |
Applovin Corp
Class B Common Stock |
C - Conversion | 109,090,908 | 110,550,489 | 7,474.12 | ||||
| 2021-04-21 |
|
4 | APP |
Applovin Corp
Series A Preferred Stock |
C - Conversion | -109,090,908 | 0 | -100.00 | ||||
| 2021-04-21 |
|
4 | APP |
Applovin Corp
Class A Common Stock |
S - Sale | -2,500,000 | 0 | -100.00 | 77.90 | -194,760,000 | ||
| 2021-04-21 |
|
4 | APP |
Applovin Corp
Class A Common Stock |
C - Conversion | 2,500,000 | 2,500,000 | |||||
| 2021-04-21 | 3 | KNBE |
KnowBe4, Inc.
Common Stock |
282,320 | ||||||||
| 2021-04-09 |
|
4 | ASO |
Academy Sports & Outdoors, Inc.
Common Stock |
S - Sale | -3,601,091 | 19,332,496 | -15.70 | 28.48 | -102,559,072 | 550,589,486 | |
| 2021-04-09 |
|
4 | ASO |
Academy Sports & Outdoors, Inc.
Common Stock |
S - Sale | -2,788,392 | 14,969,509 | -15.70 | 28.48 | -79,413,404 | 426,331,616 | |
| 2021-04-09 |
|
4 | ASO |
Academy Sports & Outdoors, Inc.
Common Stock |
S - Sale | -1,405,157 | 7,543,597 | -15.70 | 28.48 | -40,018,871 | 214,841,643 | |
| 2021-03-30 |
|
4 | LAUR |
LAUREATE EDUCATION, INC.
Class B Common Stock |
C - Conversion | -190,525 | 762,098 | -20.00 | ||||
| 2021-03-30 |
|
4 | LAUR |
LAUREATE EDUCATION, INC.
Class B Common Stock |
C - Conversion | -4,577,995 | 18,311,957 | -20.00 | ||||
| 2021-03-30 |
|
4 | LAUR |
LAUREATE EDUCATION, INC.
Class A Common Stock |
C - Conversion | 190,525 | 288,021 | 195.42 | ||||
| 2021-03-30 |
|
4 | LAUR |
LAUREATE EDUCATION, INC.
Class A Common Stock |
C - Conversion | 4,577,995 | 13,480,107 | 51.43 | ||||
| 2021-03-30 |
|
4 | COOP |
Mr. Cooper Group Inc.
Common Stock |
S - Sale | -3,257,588 | 9,749,189 | -25.05 | 32.25 | -105,057,213 | 314,411,345 | |
| 2021-03-30 |
|
4 | COOP |
Mr. Cooper Group Inc.
Common Stock |
S - Sale | -442,412 | 1,324,056 | -25.05 | 32.25 | -14,267,787 | 42,700,806 | |
| 2021-03-18 |
|
4 | FOCS |
Focus Financial Partners Inc.
Units of Focus Financial Partners, LLC |
C - Conversion | -155,558 | 3,654,044 | -4.08 | ||||
| 2021-03-18 |
|
4 | FOCS |
Focus Financial Partners Inc.
Class A Common Stock |
S - Sale | -17,182 | 403,615 | -4.08 | 46.20 | -793,808 | 18,647,013 | |
| 2021-03-18 |
|
4 | FOCS |
Focus Financial Partners Inc.
Class A Common Stock |
S - Sale | -131,401 | 3,086,585 | -4.08 | 46.20 | -6,070,726 | 142,600,227 | |
| 2021-03-18 |
|
4 | FOCS |
Focus Financial Partners Inc.
Class A Common Stock |
S - Sale | -155,558 | 0 | -100.00 | 46.20 | -7,186,780 | ||
| 2021-03-18 |
|
4 | FOCS |
Focus Financial Partners Inc.
Class A Common Stock |
C - Conversion | 155,558 | 155,558 | |||||
| 2021-03-03 |
|
4 | FOCS |
Focus Financial Partners Inc.
Units of Focus Financial Partners, LLC |
C - Conversion | -574,400 | 3,809,602 | -13.10 | ||||
| 2021-03-03 |
|
4 | FOCS |
Focus Financial Partners Inc.
Class A Common Stock |
S - Sale | -117,251 | 420,797 | -21.79 | 46.20 | -5,416,996 | 19,440,821 | |
| 2021-03-03 |
|
4 | FOCS |
Focus Financial Partners Inc.
Class A Common Stock |
S - Sale | -896,661 | 3,217,986 | -21.79 | 46.20 | -41,425,738 | 148,670,953 | |
| 2021-03-03 |
|
4 | FOCS |
Focus Financial Partners Inc.
Class A Common Stock |
S - Sale | -1,061,512 | 0 | -100.00 | 46.20 | -49,041,854 | ||
| 2021-03-03 |
|
4 | FOCS |
Focus Financial Partners Inc.
Class A Common Stock |
C - Conversion | 574,400 | 1,061,512 | 117.92 | ||||
| 2021-03-02 |
|
4 | KREF |
KKR Real Estate Finance Trust Inc.
Common Stock |
S - Sale | -177,408 | 0 | -100.00 | 18.71 | -3,319,304 | ||
| 2021-03-02 |
|
4 | KREF |
KKR Real Estate Finance Trust Inc.
Common Stock |
S - Sale | -72,510 | 177,408 | -29.01 | 18.52 | -1,342,885 | 3,285,596 | |
| 2021-02-25 |
|
4 | KREF |
KKR Real Estate Finance Trust Inc.
Common Stock |
S - Sale | -135,300 | 249,918 | -35.12 | 18.78 | -2,540,934 | 4,693,460 | |
| 2021-02-25 |
|
4 | KREF |
KKR Real Estate Finance Trust Inc.
Common Stock |
S - Sale | -288,270 | 385,218 | -42.80 | 18.95 | -5,462,716 | 7,299,881 | |
| 2021-02-25 |
|
4 | KREF |
KKR Real Estate Finance Trust Inc.
Common Stock |
S - Sale | -23,947 | 673,488 | -3.43 | 18.50 | -443,020 | 12,459,528 | |
| 2021-02-22 |
|
4 | KREF |
KKR Real Estate Finance Trust Inc.
Common Stock |
S - Sale | -31,564 | 697,435 | -4.33 | 18.62 | -587,722 | 12,986,240 | |
| 2021-02-22 |
|
4 | KREF |
KKR Real Estate Finance Trust Inc.
Common Stock |
S - Sale | -104,607 | 728,999 | -12.55 | 18.58 | -1,943,598 | 13,544,801 | |
| 2021-02-22 |
|
4 | KREF |
KKR Real Estate Finance Trust Inc.
Common Stock |
S - Sale | -4,111 | 833,606 | -0.49 | 18.50 | -76,054 | 15,421,711 | |
| 2021-02-19 | 3 | NONE |
KKR Credit Opportunities Portfolio
Class I Shares of Beneficial Interest |
2,040,000 | ||||||||
| 2021-02-19 |
|
4 | NONE |
KKR Credit Opportunities Portfolio
Class I Shares of Beneficial Interest |
P - Purchase | 1,960,000 | 4,000,000 | 96.08 | 25.00 | 49,000,000 | 100,000,000 | |
| 2021-02-17 |
|
4 | BBIO |
BridgeBio Pharma, Inc.
Common Stock |
S - Sale | -3,450,000 | 31,060,971 | -10.00 | 60.47 | -208,617,360 | 1,878,219,643 | |
| 2021-02-17 |
|
4 | KREF |
KKR Real Estate Finance Trust Inc.
Common Stock |
S - Sale | -19,524 | 837,717 | -2.28 | 18.51 | -361,389 | 15,506,142 | |
| 2021-02-17 |
|
4 | KREF |
KKR Real Estate Finance Trust Inc.
Common Stock |
S - Sale | -85,920 | 857,241 | -9.11 | 18.95 | -1,628,184 | 16,244,717 | |
| 2021-02-17 |
|
4 | KREF |
KKR Real Estate Finance Trust Inc.
Common Stock |
S - Sale | -76,101 | 943,161 | -7.47 | 18.73 | -1,425,372 | 17,665,406 | |
| 2021-02-12 |
|
4 | KKR |
KKR & Co. Inc.
Common Stock |
G - Gift | -1,000,000 | 7,000,000 | -12.50 | ||||
| 2021-02-12 |
|
4 | KKR |
KKR & Co. Inc.
Common Stock |
G - Gift | -1,000,000 | 8,000,000 | -11.11 | ||||
| 2021-02-11 | 3 | BCPL |
BC Partners Lending Corp
Common Stock |
402,516 | ||||||||
| 2021-02-11 |
|
4 | KREF |
KKR Real Estate Finance Trust Inc.
Common Stock |
S - Sale | -174,920 | 1,019,262 | -14.65 | 18.61 | -3,255,261 | 18,968,466 | |
| 2021-02-11 |
|
4 | KREF |
KKR Real Estate Finance Trust Inc.
Common Stock |
S - Sale | -35,676 | 1,194,182 | -2.90 | 18.66 | -665,714 | 22,283,436 | |
| 2021-02-11 |
|
4 | KREF |
KKR Real Estate Finance Trust Inc.
Common Stock |
S - Sale | -4,670 | 1,229,858 | -0.38 | 18.55 | -86,628 | 22,813,866 | |
| 2021-02-03 |
|
4 | ASO |
Academy Sports & Outdoors, Inc.
Common Stock |
S - Sale | -5,519,492 | 22,933,587 | -19.40 | 20.69 | -114,219,264 | 474,583,063 | |
| 2021-02-03 |
|
4 | ASO |
Academy Sports & Outdoors, Inc.
Common Stock |
S - Sale | -4,273,845 | 17,757,901 | -19.40 | 20.69 | -88,442,094 | 367,478,452 | |
| 2021-02-03 |
|
4 | ASO |
Academy Sports & Outdoors, Inc.
Common Stock |
S - Sale | -2,153,722 | 8,948,754 | -19.40 | 20.69 | -44,568,692 | 185,183,726 | |
| 2020-12-31 |
|
4 | COTY |
COTY INC.
Series B Convertible Preferred Stock |
S - Sale | -146,057 | 0 | -100.00 | 1,027.00 | -150,000,539 | ||
| 2020-12-31 |
|
4 | COTY |
COTY INC.
Series B Convertible Preferred Stock |
J - Other | -146,057 | 853,943 | -14.61 | ||||
| 2020-12-30 |
|
4 | KREF |
KKR Real Estate Finance Trust Inc.
Common Stock |
S - Sale | -17,182 | 1,234,528 | -1.37 | 18.51 | -318,039 | 22,851,113 | |
| 2020-12-30 |
|
4 | KREF |
KKR Real Estate Finance Trust Inc.
Common Stock |
S - Sale | -43,791 | 1,251,710 | -3.38 | 18.54 | -811,885 | 23,206,703 | |
| 2020-12-21 |
|
4 | KREF |
KKR Real Estate Finance Trust Inc.
Common Stock |
S - Sale | -13,291 | 1,295,501 | -1.02 | 18.55 | -246,548 | 24,031,544 | |
| 2020-12-21 |
|
4 | KREF |
KKR Real Estate Finance Trust Inc.
Common Stock |
S - Sale | -73,619 | 1,308,792 | -5.33 | 18.54 | -1,364,896 | 24,265,004 | |
| 2020-12-16 |
|
4 | KREF |
KKR Real Estate Finance Trust Inc.
Common Stock |
S - Sale | -39,847 | 1,382,411 | -2.80 | 18.54 | -738,763 | 25,629,900 | |
| 2020-12-16 |
|
4 | KREF |
KKR Real Estate Finance Trust Inc.
Common Stock |
S - Sale | -24,187 | 1,422,258 | -1.67 | 18.71 | -452,539 | 26,610,447 | |
| 2020-12-16 |
|
4 | KREF |
KKR Real Estate Finance Trust Inc.
Common Stock |
S - Sale | -9,139 | 1,446,445 | -0.63 | 18.51 | -169,163 | 26,773,697 | |
| 2020-12-14 |
|
4 | FISV |
FISERV INC
Common Stock |
S - Sale | -20,125,000 | 85,300,667 | -19.09 | 110.04 | -2,214,555,000 | 9,386,485,397 | |
| 2020-12-09 |
|
4 | KREF |
KKR Real Estate Finance Trust Inc.
Common Stock |
S - Sale | -1,371 | 1,455,584 | -0.09 | 18.67 | -25,597 | 27,175,753 | |
| 2020-12-09 |
|
4 | KREF |
KKR Real Estate Finance Trust Inc.
Common Stock |
S - Sale | -27,865 | 1,456,955 | -1.88 | 18.60 | -518,289 | 27,099,363 | |
| 2020-12-09 |
|
4 | KREF |
KKR Real Estate Finance Trust Inc.
Common Stock |
S - Sale | -27,566 | 1,484,820 | -1.82 | 18.53 | -510,798 | 27,513,715 | |
| 2020-12-04 |
|
4 | KREF |
KKR Real Estate Finance Trust Inc.
Common Stock |
S - Sale | -41,032 | 1,512,386 | -2.64 | 18.55 | -761,144 | 28,054,760 | |
| 2020-12-04 |
|
4 | KREF |
KKR Real Estate Finance Trust Inc.
Common Stock |
S - Sale | -24,402 | 1,553,418 | -1.55 | 18.53 | -452,169 | 28,784,836 | |
| 2020-12-02 |
|
4 | KREF |
KKR Real Estate Finance Trust Inc.
Common Stock |
S - Sale | -32,944 | 1,577,820 | -2.05 | 18.53 | -610,452 | 29,237,005 | |
| 2020-12-02 |
|
4 | KREF |
KKR Real Estate Finance Trust Inc.
Common Stock |
S - Sale | -6,353 | 1,610,764 | -0.39 | 18.57 | -117,975 | 29,911,887 | |
| 2020-12-02 |
|
4 | KREF |
KKR Real Estate Finance Trust Inc.
Common Stock |
S - Sale | -18,950 | 1,617,117 | -1.16 | 18.50 | -350,575 | 29,916,664 | |
| 2020-11-27 |
|
4 | KREF |
KKR Real Estate Finance Trust Inc.
Common Stock |
S - Sale | -7,258 | 1,636,067 | -0.44 | 18.50 | -134,273 | 30,267,240 | |
| 2020-11-27 |
|
4 | KREF |
KKR Real Estate Finance Trust Inc.
Common Stock |
S - Sale | -100,900 | 1,643,325 | -5.78 | 18.51 | -1,867,659 | 30,417,946 | |
| 2020-11-19 |
|
4 | KREF |
KKR Real Estate Finance Trust Inc.
Common Stock |
S - Sale | -9,824 | 1,744,225 | -0.56 | 18.55 | -182,235 | 32,355,374 | |
| 2020-11-19 |
|
4 | KREF |
KKR Real Estate Finance Trust Inc.
Common Stock |
S - Sale | -27,684 | 1,754,049 | -1.55 | 18.50 | -512,154 | 32,449,906 | |
| 2020-11-12 |
|
4 | KREF |
KKR Real Estate Finance Trust Inc.
Common Stock |
S - Sale | -76,623 | 1,781,733 | -4.12 | 18.52 | -1,419,058 | 32,997,695 | |
| 2020-10-02 |
|
4 | TGAN |
Transphorm, Inc.
Common Stock |
J - Other | 0 | 21,175,980 | 0.00 | ||||
| 2020-10-02 | 3 | ASO |
Academy Sports & Outdoors, Inc.
Common Stock |
11,102,476 | ||||||||
| 2020-10-02 | 3 | ASO |
Academy Sports & Outdoors, Inc.
Common Stock |
22,031,746 | ||||||||
| 2020-10-02 | 3 | ASO |
Academy Sports & Outdoors, Inc.
Common Stock |
28,453,079 | ||||||||
| 2020-09-18 |
|
4 | KREF |
KKR Real Estate Finance Trust Inc.
Common Stock |
S - Sale | -94,200 | 1,858,356 | -4.82 | 18.56 | -1,748,352 | 34,491,087 | |
| 2020-09-10 |
|
4 | KREF |
KKR Real Estate Finance Trust Inc.
Common Stock |
S - Sale | -2,623 | 1,952,556 | -0.13 | 18.51 | -48,552 | 36,141,812 | |
| 2020-09-10 |
|
4 | KREF |
KKR Real Estate Finance Trust Inc.
Common Stock |
S - Sale | -16,690 | 1,955,179 | -0.85 | 18.51 | -308,932 | 36,190,363 | |
| 2020-09-10 |
|
4 | KREF |
KKR Real Estate Finance Trust Inc.
Common Stock |
S - Sale | -16,090 | 1,971,869 | -0.81 | 18.51 | -297,826 | 36,499,295 | |
| 2020-09-03 |
|
4 | KREF |
KKR Real Estate Finance Trust Inc.
Common Stock |
S - Sale | -20,657 | 1,987,959 | -1.03 | 18.50 | -382,154 | 36,777,242 | |
| 2020-08-21 |
|
4 | FISV |
FISERV INC
Common Stock |
S - Sale | -5,000,000 | 105,425,667 | -4.53 | 98.00 | -490,000,000 | 10,331,715,366 | |
| 2020-07-30 |
|
4 | COTY |
COTY INC.
Series B Preferred Stock |
J - Other | -4,785 | 1,000,000 | -0.48 | ||||
| 2020-07-30 |
|
4 | COTY |
COTY INC.
Series B Preferred Stock |
J - Other | -179,500 | 1,000,000 | -15.22 | ||||
| 2020-06-23 |
|
4 | IR |
Ingersoll Rand Inc.
Common Stock |
S - Sale | -12,100,000 | 44,788,635 | -21.27 | 30.40 | -367,840,000 | 1,361,574,504 | |
| 2020-06-18 |
|
4 | SONO |
Sonos Inc
Common Stock |
S - Sale | -13,845,682 | 0 | -100.00 | 13.00 | -179,993,866 | ||
| 2020-06-17 |
|
4 | BV |
BrightView Holdings, Inc.
Common Stock |
S - Sale | -7,785,123 | 50,633,123 | -13.33 | 13.25 | -103,152,880 | 670,888,880 | |
| 2020-06-01 |
|
4 | BBIO |
BridgeBio Pharma, Inc.
Common Stock |
S - Sale | -2,389,690 | 34,510,971 | -6.48 | 33.39 | -79,791,749 | 1,152,321,322 | |
| 2020-05-29 |
|
4 | IR |
Ingersoll Rand Inc.
Common Stock |
S - Sale | -13,782,500 | 56,888,635 | -19.50 | 28.82 | -397,211,650 | 1,639,530,461 | |
| 2020-03-13 |
|
4 | NONE |
Transphorm, Inc.
Common Stock |
P - Purchase | 1,250,000 | 21,175,980 | 6.27 | 4.00 | 5,000,000 | 84,703,920 | |
| 2020-03-13 | 3 | NONE |
Transphorm, Inc.
Common Stock |
39,851,960 | ||||||||
| 2020-03-13 | 3 | NONE |
Transphorm, Inc.
Common Stock |
39,851,960 | ||||||||
| 2020-03-13 | 3 | NONE |
Transphorm, Inc.
Common Stock |
39,851,960 | ||||||||
| 2020-03-13 | 3 | NONE |
Transphorm, Inc.
Common Stock |
39,851,960 | ||||||||
| 2020-03-13 | 3 | NONE |
Transphorm, Inc.
Common Stock |
39,851,960 | ||||||||
| 2020-03-13 | 3 | NONE |
Transphorm, Inc.
Common Stock |
39,851,960 | ||||||||
| 2020-03-13 | 3 | NONE |
Transphorm, Inc.
Common Stock |
39,851,960 | ||||||||
| 2020-03-13 | 3 | NONE |
Transphorm, Inc.
Common Stock |
39,851,960 | ||||||||
| 2020-03-13 | 3 | NONE |
Transphorm, Inc.
Common Stock |
39,851,960 | ||||||||
| 2020-03-13 | 3 | NONE |
Transphorm, Inc.
Common Stock |
39,851,960 | ||||||||
| 2020-02-21 |
|
4 | SONO |
Sonos Inc
Common Stock |
S - Sale | -8,000,000 | 13,845,682 | -36.62 | 13.42 | -107,360,000 | 185,809,052 | |
| 2020-01-29 |
|
4 | KRP |
Kimbell Royalty Partners, LP
OpCo Units |
C - Conversion | 266,076 | 0 | -100.00 | ||||
| 2020-01-29 |
|
4 | KRP |
Kimbell Royalty Partners, LP
OpCo Units |
C - Conversion | 3,897,483 | 0 | -100.00 | ||||
| 2020-01-29 |
|
4 | KRP |
Kimbell Royalty Partners, LP
Common units representing limited partner interests |
C - Conversion | 266,076 | 266,076 | |||||
| 2020-01-29 |
|
4 | KRP |
Kimbell Royalty Partners, LP
Common units representing limited partner interests |
C - Conversion | 3,897,483 | 3,897,483 | |||||
| 2020-01-29 |
|
4 | KRP |
Kimbell Royalty Partners, LP
Common units representing limited partner interests |
S - Sale | -47,929 | 0 | -100.00 | 14.80 | -709,469 | ||
| 2020-01-29 |
|
4 | KRP |
Kimbell Royalty Partners, LP
Common units representing limited partner interests |
S - Sale | -702,071 | 0 | -100.00 | 14.80 | -10,392,406 | ||
| 2020-01-29 |
|
4 | KRP |
Kimbell Royalty Partners, LP
OpCo Units |
C - Conversion | 47,929 | 266,076 | 21.97 | ||||
| 2020-01-29 |
|
4 | KRP |
Kimbell Royalty Partners, LP
OpCo Units |
C - Conversion | 702,071 | 3,897,483 | 21.97 | ||||
| 2020-01-29 |
|
4 | KRP |
Kimbell Royalty Partners, LP
Common units representing limited partner interests |
C - Conversion | 47,929 | 47,929 | |||||
| 2020-01-29 |
|
4 | KRP |
Kimbell Royalty Partners, LP
Common units representing limited partner interests |
C - Conversion | 702,071 | 702,071 | |||||
| 2019-11-04 |
|
4 | OYST |
Oyster Point Pharma, Inc.
Series B Convertible Preferred Stock |
C - Conversion | -884,622 | 0 | -100.00 | ||||
| 2019-11-04 |
|
4 | OYST |
Oyster Point Pharma, Inc.
Common Stock, par value $0.001 per share |
P - Purchase | 155,000 | 1,039,622 | 17.52 | 16.00 | 2,480,000 | 16,633,952 | |
| 2019-11-04 |
|
4 | OYST |
Oyster Point Pharma, Inc.
Common Stock, par value $0.001 per share |
C - Conversion | 884,622 | 884,622 | |||||
| 2019-09-10 |
|
4 | PRAH |
PRA Health Sciences, Inc.
Common Stock |
J - Other | -29,300 | 0 | -100.00 | ||||
| 2019-09-10 |
|
4 | PRAH |
PRA Health Sciences, Inc.
Common Stock |
S - Sale | -6,666,684 | 29,300 | -99.56 | 97.41 | -649,401,688 | 2,854,113 | |
| 2019-08-14 |
|
4 | EYE |
National Vision Holdings, Inc.
Common Stock |
S - Sale | -9,149,908 | 0 | -100.00 | 30.52 | -279,255,192 | ||
| 2019-08-06 | 3 | FISV |
FISERV INC
Common Stock |
220,851,334 | ||||||||
| 2019-08-06 | 3 | FISV |
FISERV INC
Common Stock |
220,851,334 | ||||||||
| 2019-08-06 | 3 | FISV |
FISERV INC
Common Stock |
220,851,334 | ||||||||
| 2019-08-06 | 3 | FISV |
FISERV INC
Common Stock |
220,851,334 | ||||||||
| 2019-08-06 | 3 | FISV |
FISERV INC
Common Stock |
220,851,334 | ||||||||
| 2019-08-06 | 3 | FISV |
FISERV INC
Common Stock |
220,851,334 | ||||||||
| 2019-08-06 | 3 | FISV |
FISERV INC
Common Stock |
220,851,334 | ||||||||
| 2019-08-06 | 3 | FISV |
FISERV INC
Common Stock |
220,851,334 | ||||||||
| 2019-08-06 | 3 | FISV |
FISERV INC
Common Stock |
220,851,334 | ||||||||
| 2019-08-02 |
|
4 | KKR |
KKR & Co. Inc.
Class A Common Stock |
G - Gift | -1,000,000 | 9,000,000 | -10.00 | ||||
| 2019-07-29 |
|
4 | FDC |
FIRST DATA CORP
Units in Director Deferred Compensation Plan |
D - Sale to Issuer | -31,425 | 0 | -100.00 | ||||
| 2019-07-29 |
|
4 | FDC |
FIRST DATA CORP
Class B Common Stock |
J - Other | -364,441,146 | 0 | -100.00 | ||||
| 2019-07-03 |
|
4 | BBIO |
BridgeBio Pharma, Inc.
Series D Preferred Units |
C - Conversion | -50,446,451 | 0 | -100.00 | ||||
| 2019-07-03 |
|
4 | BBIO |
BridgeBio Pharma, Inc.
Series C Preferred Units |
C - Conversion | -36,246,893 | 0 | -100.00 | ||||
| 2019-07-03 |
|
4 | BBIO |
BridgeBio Pharma, Inc.
Series B Preferred Units |
C - Conversion | -81,022,727 | 0 | -100.00 | ||||
| 2019-07-03 |
|
4 | BBIO |
BridgeBio Pharma, Inc.
Common Stock |
P - Purchase | 2,647,100 | 36,900,661 | 7.73 | 17.00 | 45,000,700 | 627,311,237 | |
| 2019-07-03 |
|
4 | BBIO |
BridgeBio Pharma, Inc.
Common Stock |
C - Conversion | 34,253,561 | 34,253,561 | |||||
| 2019-07-02 |
|
4 | FDC |
FIRST DATA CORP
Units in Director Deferred Compensation Plan |
A - Award | 728 | 31,425 | 2.37 | 27.48 | 20,000 | 863,562 | |
| 2019-01-16 |
|
4 | EGL |
Engility Holdings, Inc.
Common Stock, par value $0.01 per share |
J - Other | -8,960,446 | 0 | -100.00 | ||||
| 2019-01-03 |
|
4 | FDC |
FIRST DATA CORP
Units in Director Deferred Compensation Plan |
A - Award | 1,174 | 30,697 | 3.98 | 17.04 | 20,000 | 523,082 | |
| 2018-11-21 |
|
4 | EYE |
National Vision Holdings, Inc.
Common Stock |
S - Sale | -10,054,259 | 9,149,908 | -52.35 | 40.20 | -404,181,212 | 367,826,302 | |
| 2018-11-19 |
|
4 | KREF |
KKR Real Estate Finance Trust Inc.
Common Stock |
S - Sale | -1,750,000 | 2,008,616 | -46.56 | 20.00 | -35,000,000 | 40,172,320 | |
| 2018-11-16 |
|
4 | KKR |
KKR & Co. Inc.
Class A Common Stock |
G - Gift | -1,000,000 | 10,000,000 | -9.09 | ||||
| 2018-11-05 |
|
4 | GDI |
GARDNER DENVER HOLDINGS, INC.
Common Stock |
J - Other | -50,274 | 70,671,135 | -0.07 | ||||
| 2018-11-05 |
|
4 | GDI |
GARDNER DENVER HOLDINGS, INC.
Common Stock |
S - Sale | -20,000,000 | 70,721,409 | -22.05 | 25.66 | -513,200,000 | 1,814,711,355 | |
| 2018-09-25 |
|
4 | KRP |
Kimbell Royalty Partners, LP
OpCo Units |
J - Other | 314,005 | 314,005 | |||||
| 2018-09-25 |
|
4 | KRP |
Kimbell Royalty Partners, LP
OpCo Units |
J - Other | 4,599,554 | 4,599,554 | |||||
| 2018-09-25 |
|
4 | KRP |
Kimbell Royalty Partners, LP
Common units representing limited partner interests |
J - Other | -314,005 | 0 | -100.00 | ||||
| 2018-09-25 |
|
4 | KRP |
Kimbell Royalty Partners, LP
Common units representing limited partner interests |
J - Other | -4,599,554 | 0 | -100.00 | ||||
| 2018-08-31 |
|
4 | RNET |
RigNet, Inc.
Common Stock |
P - Purchase | 14,132 | 5,000,254 | 0.28 | 15.93 | 225,123 | 79,654,046 | |
| 2018-08-31 |
|
4 | RNET |
RigNet, Inc.
Common Stock |
P - Purchase | 17,883 | 4,986,122 | 0.36 | 15.99 | 285,949 | 79,728,091 | |
| 2018-08-31 |
|
4 | RNET |
RigNet, Inc.
Common Stock |
P - Purchase | 10,074 | 4,968,239 | 0.20 | 15.98 | 160,983 | 79,392,459 | |
| 2018-08-29 |
|
4 | RNET |
RigNet, Inc.
Common Stock |
P - Purchase | 35,399 | 4,958,165 | 0.72 | 15.98 | 565,676 | 79,231,477 | |
| 2018-08-29 |
|
4 | RNET |
RigNet, Inc.
Common Stock |
P - Purchase | 11,806 | 4,922,766 | 0.24 | 15.99 | 188,778 | 78,715,028 | |
| 2018-08-23 |
|
4 | RNET |
RigNet, Inc.
Common Stock |
P - Purchase | 16,817 | 4,910,960 | 0.34 | 15.79 | 265,540 | 77,544,058 | |
| 2018-08-23 |
|
4 | RNET |
RigNet, Inc.
Common Stock |
P - Purchase | 41,060 | 4,894,143 | 0.85 | 15.11 | 620,417 | 73,950,501 | |
| 2018-08-20 |
|
4 | FDC |
FIRST DATA CORP
Class B Common Stock |
S - Sale | -73,600,000 | 364,441,146 | -16.80 | 23.22 | -1,708,668,160 | 8,460,719,869 | |
| 2018-08-20 |
|
4 | RNET |
RigNet, Inc.
Common Stock |
P - Purchase | 30,076 | 4,853,083 | 0.62 | 14.14 | 425,275 | 68,622,594 | |
| 2018-08-20 |
|
4 | RNET |
RigNet, Inc.
Common Stock |
P - Purchase | 8,576 | 4,823,007 | 0.18 | 13.98 | 119,892 | 67,425,638 | |
| 2018-08-20 |
|
4 | RNET |
RigNet, Inc.
Common Stock |
P - Purchase | 6,264 | 4,814,431 | 0.13 | 14.00 | 87,696 | 67,402,034 | |
| 2018-08-20 |
|
4 | GDDY |
GoDaddy Inc.
Units of Desert Newco, LLC |
C - Conversion | -38,880 | 29,374 | -56.96 | ||||
| 2018-08-20 |
|
4 | GDDY |
GoDaddy Inc.
Units of Desert Newco, LLC |
C - Conversion | -178,047 | 134,515 | -56.96 | ||||
| 2018-08-20 |
|
4 | GDDY |
GoDaddy Inc.
Units of Desert Newco, LLC |
C - Conversion | -1,617,609 | 1,222,099 | -56.96 | ||||
| 2018-08-20 |
|
4 | GDDY |
GoDaddy Inc.
Class A Common Stock |
S - Sale | -38,880 | 8,050 | -82.85 | 75.61 | -2,939,717 | 608,660 | |
| 2018-08-20 |
|
4 | GDDY |
GoDaddy Inc.
Class A Common Stock |
C - Conversion | 38,880 | 46,930 | 482.98 | ||||
| 2018-08-20 |
|
4 | GDDY |
GoDaddy Inc.
Class A Common Stock |
S - Sale | -178,047 | 36,864 | -82.85 | 75.61 | -13,462,134 | 2,787,287 | |
| 2018-08-20 |
|
4 | GDDY |
GoDaddy Inc.
Class A Common Stock |
C - Conversion | 178,047 | 214,911 | 482.98 | ||||
| 2018-08-20 |
|
4 | GDDY |
GoDaddy Inc.
Class A Common Stock |
S - Sale | -1,617,609 | 374,147 | -81.22 | 75.61 | -122,307,416 | 28,289,255 | |
| 2018-08-20 |
|
4 | GDDY |
GoDaddy Inc.
Class A Common Stock |
C - Conversion | 1,617,609 | 1,991,756 | 432.35 | ||||
| 2018-08-20 |
|
4 | GDDY |
GoDaddy Inc.
Class A Common Stock |
S - Sale | -544,323 | 457,523 | -54.33 | 75.61 | -41,156,262 | 34,593,314 | |
| 2018-08-20 |
|
4 | GDDY |
GoDaddy Inc.
Class A Common Stock |
S - Sale | -1,121,141 | 1,106,336 | -50.33 | 75.61 | -84,769,471 | 83,650,065 | |
| 2018-08-15 |
|
4 | RNET |
RigNet, Inc.
Common Stock |
P - Purchase | 25,773 | 4,808,167 | 0.54 | 13.50 | 347,936 | 64,910,254 | |
| 2018-08-15 |
|
4 | RNET |
RigNet, Inc.
Common Stock |
P - Purchase | 18,992 | 4,782,394 | 0.40 | 13.82 | 262,469 | 66,092,685 | |
| 2018-08-15 |
|
4 | RNET |
RigNet, Inc.
Common Stock |
P - Purchase | 13,402 | 4,763,402 | 0.28 | 13.48 | 180,659 | 64,210,659 | |
| 2018-08-13 |
|
4 | PRAH |
PRA Health Sciences, Inc.
Common Stock |
S - Sale | -6,500,000 | 6,695,984 | -49.26 | 101.01 | -656,565,000 | 676,361,344 | |
| 2018-08-08 |
|
4 | SONO |
Sonos Inc
Common Stock |
S - Sale | -2,030,892 | 21,845,682 | -8.51 | 14.18 | -28,787,894 | 309,662,542 | |
| 2018-08-06 |
|
4 | EYE |
National Vision Holdings, Inc.
Common Stock |
S - Sale | -1,742,007 | 19,204,167 | -8.32 | 38.26 | -66,648,143 | 734,739,907 | |
| 2018-08-02 |
|
4 | WMIH |
WMIH CORP.
Warrants |
S - Sale | -30,700,000 | 0 | -100.00 | ||||
| 2018-08-02 |
|
4 | WMIH |
WMIH CORP.
Warrants |
S - Sale | -30,700,000 | 0 | -100.00 | ||||
| 2018-08-02 |
|
4 | WMIH |
WMIH CORP.
Series B Convertible Preferred Stock |
C - Conversion | -200,000 | 0 | -100.00 | ||||
| 2018-08-02 |
|
4 | WMIH |
WMIH CORP.
Common Stock |
P - Purchase | 21,197,619 | 21,197,619 | |||||
| 2018-08-02 |
|
4 | WMIH |
WMIH CORP.
Common Stock |
C - Conversion | 148,148,148 | 156,081,323 | 1,867.45 | 1.35 | 200,000,000 | 210,709,786 | |
| 2018-08-01 | 3 | FOCS |
Focus Financial Partners Inc.
Class A Common Stock |
5,626,919 | ||||||||
| 2018-08-01 | 3 | FOCS |
Focus Financial Partners Inc.
Class A Common Stock |
9,254,454 | ||||||||
| 2018-08-01 | 3 | FOCS |
Focus Financial Partners Inc.
Class A Common Stock |
5,677,855 | ||||||||
| 2018-08-01 | 3 | FOCS |
Focus Financial Partners Inc.
Class A Common Stock |
5,626,919 | ||||||||
| 2018-08-01 | 3 | FOCS |
Focus Financial Partners Inc.
Class A Common Stock |
9,254,454 | ||||||||
| 2018-08-01 | 3 | FOCS |
Focus Financial Partners Inc.
Class A Common Stock |
5,677,855 | ||||||||
| 2018-08-01 | 3 | FOCS |
Focus Financial Partners Inc.
Class A Common Stock |
5,626,919 | ||||||||
| 2018-08-01 | 3 | FOCS |
Focus Financial Partners Inc.
Class A Common Stock |
9,254,454 | ||||||||
| 2018-08-01 | 3 | FOCS |
Focus Financial Partners Inc.
Class A Common Stock |
5,677,855 | ||||||||
| 2018-08-01 | 3 | FOCS |
Focus Financial Partners Inc.
Class A Common Stock |
5,626,919 | ||||||||
| 2018-08-01 | 3 | FOCS |
Focus Financial Partners Inc.
Class A Common Stock |
9,254,454 | ||||||||
| 2018-08-01 | 3 | FOCS |
Focus Financial Partners Inc.
Class A Common Stock |
5,677,855 | ||||||||
| 2018-08-01 | 3 | FOCS |
Focus Financial Partners Inc.
Class A Common Stock |
5,626,919 | ||||||||
| 2018-08-01 | 3 | FOCS |
Focus Financial Partners Inc.
Class A Common Stock |
9,254,454 | ||||||||
| 2018-08-01 | 3 | FOCS |
Focus Financial Partners Inc.
Class A Common Stock |
5,677,855 | ||||||||
| 2018-08-01 | 3 | FOCS |
Focus Financial Partners Inc.
Class A Common Stock |
5,626,919 | ||||||||
| 2018-08-01 | 3 | FOCS |
Focus Financial Partners Inc.
Class A Common Stock |
9,254,454 | ||||||||
| 2018-08-01 | 3 | FOCS |
Focus Financial Partners Inc.
Class A Common Stock |
5,677,855 | ||||||||
| 2018-08-01 | 3 | FOCS |
Focus Financial Partners Inc.
Class A Common Stock |
5,626,919 | ||||||||
| 2018-08-01 | 3 | FOCS |
Focus Financial Partners Inc.
Class A Common Stock |
9,254,454 | ||||||||
| 2018-08-01 | 3 | FOCS |
Focus Financial Partners Inc.
Class A Common Stock |
5,677,855 | ||||||||
| 2018-08-01 | 3 | FOCS |
Focus Financial Partners Inc.
Class A Common Stock |
5,626,919 | ||||||||
| 2018-08-01 | 3 | FOCS |
Focus Financial Partners Inc.
Class A Common Stock |
9,254,454 | ||||||||
| 2018-08-01 | 3 | FOCS |
Focus Financial Partners Inc.
Class A Common Stock |
5,677,855 | ||||||||
| 2018-08-01 | 3 | FOCS |
Focus Financial Partners Inc.
Class A Common Stock |
5,626,919 | ||||||||
| 2018-08-01 | 3 | FOCS |
Focus Financial Partners Inc.
Class A Common Stock |
9,254,454 | ||||||||
| 2018-08-01 | 3 | FOCS |
Focus Financial Partners Inc.
Class A Common Stock |
5,677,855 | ||||||||
| 2018-08-01 | 3 | FOCS |
Focus Financial Partners Inc.
Class A Common Stock |
5,626,919 | ||||||||
| 2018-08-01 | 3 | FOCS |
Focus Financial Partners Inc.
Class A Common Stock |
9,254,454 | ||||||||
| 2018-08-01 | 3 | FOCS |
Focus Financial Partners Inc.
Class A Common Stock |
5,677,855 | ||||||||
| 2018-08-01 | 3 | FOCS |
Focus Financial Partners Inc.
Class A Common Stock |
5,626,919 | ||||||||
| 2018-08-01 | 3 | FOCS |
Focus Financial Partners Inc.
Class A Common Stock |
9,254,454 | ||||||||
| 2018-08-01 | 3 | FOCS |
Focus Financial Partners Inc.
Class A Common Stock |
5,677,855 | ||||||||
| 2018-08-01 |
|
4 | EYE |
National Vision Holdings, Inc.
Common Stock |
S - Sale | -11,452,321 | 20,946,174 | -35.35 | 38.26 | -438,158,930 | 801,388,050 | |
| 2018-08-01 | 3 | SONO |
Sonos Inc
Common Stock |
47,753,148 | ||||||||
| 2018-08-01 | 3 | SONO |
Sonos Inc
Common Stock |
47,753,148 | ||||||||
| 2018-08-01 | 3 | SONO |
Sonos Inc
Common Stock |
47,753,148 | ||||||||
| 2018-08-01 | 3 | SONO |
Sonos Inc
Common Stock |
47,753,148 | ||||||||
| 2018-08-01 | 3 | SONO |
Sonos Inc
Common Stock |
47,753,148 | ||||||||
| 2018-08-01 | 3 | SONO |
Sonos Inc
Common Stock |
47,753,148 | ||||||||
| 2018-08-01 | 3 | SONO |
Sonos Inc
Common Stock |
47,753,148 | ||||||||
| 2018-08-01 | 3 | SONO |
Sonos Inc
Common Stock |
47,753,148 | ||||||||
| 2018-07-23 | 3 | KRP |
Kimbell Royalty Partners, LP
Common units representing limited partner interests |
9,513,113 | ||||||||
| 2018-07-23 | 3 | KRP |
Kimbell Royalty Partners, LP
Common units representing limited partner interests |
5,227,564 | ||||||||
| 2018-07-23 | 3 | KRP |
Kimbell Royalty Partners, LP
Common units representing limited partner interests |
9,513,113 | ||||||||
| 2018-07-23 | 3 | KRP |
Kimbell Royalty Partners, LP
Common units representing limited partner interests |
5,227,564 | ||||||||
| 2018-07-23 | 3 | KRP |
Kimbell Royalty Partners, LP
Common units representing limited partner interests |
9,513,113 | ||||||||
| 2018-07-23 | 3 | KRP |
Kimbell Royalty Partners, LP
Common units representing limited partner interests |
5,227,564 | ||||||||
| 2018-07-23 | 3 | KRP |
Kimbell Royalty Partners, LP
Common units representing limited partner interests |
9,513,113 | ||||||||
| 2018-07-23 | 3 | KRP |
Kimbell Royalty Partners, LP
Common units representing limited partner interests |
5,227,564 | ||||||||
| 2018-07-23 | 3 | KRP |
Kimbell Royalty Partners, LP
Common units representing limited partner interests |
9,513,113 | ||||||||
| 2018-07-23 | 3 | KRP |
Kimbell Royalty Partners, LP
Common units representing limited partner interests |
5,227,564 | ||||||||
| 2018-07-23 | 3 | KRP |
Kimbell Royalty Partners, LP
Common units representing limited partner interests |
9,513,113 | ||||||||
| 2018-07-23 | 3 | KRP |
Kimbell Royalty Partners, LP
Common units representing limited partner interests |
5,227,564 | ||||||||
| 2018-07-23 | 3 | KRP |
Kimbell Royalty Partners, LP
Common units representing limited partner interests |
9,513,113 | ||||||||
| 2018-07-23 | 3 | KRP |
Kimbell Royalty Partners, LP
Common units representing limited partner interests |
5,227,564 | ||||||||
| 2018-07-23 | 3 | KRP |
Kimbell Royalty Partners, LP
Common units representing limited partner interests |
9,513,113 | ||||||||
| 2018-07-23 | 3 | KRP |
Kimbell Royalty Partners, LP
Common units representing limited partner interests |
5,227,564 | ||||||||
| 2018-07-23 | 3 | KRP |
Kimbell Royalty Partners, LP
Common units representing limited partner interests |
9,513,113 | ||||||||
| 2018-07-23 | 3 | KRP |
Kimbell Royalty Partners, LP
Common units representing limited partner interests |
5,227,564 | ||||||||
| 2018-07-23 | 3 | KRP |
Kimbell Royalty Partners, LP
Common units representing limited partner interests |
9,513,113 | ||||||||
| 2018-07-23 | 3 | KRP |
Kimbell Royalty Partners, LP
Common units representing limited partner interests |
5,227,564 | ||||||||
| 2018-07-05 |
|
4 | FDC |
FIRST DATA CORP
Units in Director Deferred Compensation Plan |
A - Award | 947 | 29,524 | 3.31 | 21.12 | 20,000 | 623,538 | |
| 2018-06-28 | 3 | BV |
BrightView Holdings, Inc.
Common Stock |
116,836,492 | ||||||||
| 2018-06-28 | 3 | BV |
BrightView Holdings, Inc.
Common Stock |
116,836,492 | ||||||||
| 2018-06-28 | 3 | BV |
BrightView Holdings, Inc.
Common Stock |
116,836,492 | ||||||||
| 2018-06-28 | 3 | BV |
BrightView Holdings, Inc.
Common Stock |
116,836,492 | ||||||||
| 2018-06-28 | 3 | BV |
BrightView Holdings, Inc.
Common Stock |
116,836,492 | ||||||||
| 2018-06-28 | 3 | BV |
BrightView Holdings, Inc.
Common Stock |
116,836,492 | ||||||||
| 2018-06-28 | 3 | BV |
BrightView Holdings, Inc.
Common Stock |
116,836,492 | ||||||||
| 2018-06-28 | 3 | BV |
BrightView Holdings, Inc.
Common Stock |
116,836,492 | ||||||||
| 2018-06-28 | 3 | BV |
BrightView Holdings, Inc.
Common Stock |
116,836,492 | ||||||||
| 2018-06-28 | 3 | BV |
BrightView Holdings, Inc.
Common Stock |
116,836,492 | ||||||||
| 2018-06-06 |
|
4 | AMED |
AMEDISYS INC
Common Stock |
S - Sale | -19,120 | 22,933 | -45.47 | 73.96 | -1,414,115 | 1,696,125 | |
| 2018-06-06 |
|
4 | AMED |
AMEDISYS INC
Common Stock |
S - Sale | -2,418,304 | 2,395,371 | -50.24 | 73.96 | -178,857,764 | 177,161,639 | |
| 2018-06-05 |
|
4 | WG |
Willbros Group, Inc.\NEW\
Common Stock, $0.05 par value |
J - Other | -10,125,410 | 0 | -100.00 | 0.60 | -6,075,246 | ||
| 2018-05-25 |
|
4 | GDDY |
GoDaddy Inc.
Units of Desert Newco, LLC |
C - Conversion | -44,435 | 68,254 | -39.43 | ||||
| 2018-05-25 |
|
4 | GDDY |
GoDaddy Inc.
Units of Desert Newco, LLC |
C - Conversion | -203,482 | 312,562 | -39.43 | ||||
| 2018-05-25 |
|
4 | GDDY |
GoDaddy Inc.
Units of Desert Newco, LLC |
C - Conversion | -1,848,696 | 2,839,708 | -39.43 | ||||
| 2018-05-25 |
|
4 | GDDY |
GoDaddy Inc.
Class A Common Stock |
S - Sale | -44,435 | 8,050 | -84.66 | 70.73 | -3,142,888 | 569,376 | |
| 2018-05-25 |
|
4 | GDDY |
GoDaddy Inc.
Class A Common Stock |
C - Conversion | 44,435 | 52,485 | 551.99 | ||||
| 2018-05-25 |
|
4 | GDDY |
GoDaddy Inc.
Class A Common Stock |
S - Sale | -203,482 | 36,864 | -84.66 | 70.73 | -14,392,282 | 2,607,391 | |
| 2018-05-25 |
|
4 | GDDY |
GoDaddy Inc.
Class A Common Stock |
C - Conversion | 203,482 | 240,346 | 551.98 | ||||
| 2018-05-25 |
|
4 | GDDY |
GoDaddy Inc.
Class A Common Stock |
S - Sale | -1,848,696 | 374,147 | -83.17 | 70.73 | -130,758,268 | 26,463,417 | |
| 2018-05-25 |
|
4 | GDDY |
GoDaddy Inc.
Class A Common Stock |
C - Conversion | 1,848,696 | 2,222,843 | 494.11 | ||||
| 2018-05-25 |
|
4 | GDDY |
GoDaddy Inc.
Class A Common Stock |
S - Sale | -622,084 | 1,001,846 | -38.31 | 70.73 | -44,000,001 | 70,860,568 | |
| 2018-05-25 |
|
4 | GDDY |
GoDaddy Inc.
Class A Common Stock |
S - Sale | -1,281,303 | 2,227,477 | -36.52 | 70.73 | -90,626,561 | 157,549,448 | |
| 2018-05-18 |
|
4 | KKR |
KKR & Co. L.P.
KKR Holdings L.P. Units |
C - Conversion | -10,000,000 | 71,314,740 | -12.30 | ||||
| 2018-05-18 |
|
4 | KKR |
KKR & Co. L.P.
Common Units |
G - Gift | 10,000,000 | 11,000,000 | 1,000.00 | ||||
| 2018-05-18 |
|
4 | KKR |
KKR & Co. L.P.
Common Units |
G - Gift | -10,000,000 | 1,105,832 | -90.04 | ||||
| 2018-05-18 |
|
4 | KKR |
KKR & Co. L.P.
Common Units |
C - Conversion | 10,000,000 | 11,105,832 | 904.30 | ||||
| 2018-05-18 |
|
4 | KKR |
KKR & Co. L.P.
Common Units |
W - Other | 43,299 | 1,149,131 | 3.92 | ||||
| 2018-05-09 |
|
4 | GDI |
GARDNER DENVER HOLDINGS, INC.
Common Stock |
S - Sale | -30,436,064 | 90,721,409 | -25.12 | 29.84 | -908,136,060 | 2,706,900,041 | |
| 2018-04-25 |
|
4 | LAUR |
LAUREATE EDUCATION, INC.
Convertible Redeemable Preferred Stock, Series A |
C - Conversion | -650 | 0 | -100.00 | ||||
| 2018-04-25 |
|
4 | LAUR |
LAUREATE EDUCATION, INC.
Convertible Redeemable Preferred Stock, Series A |
C - Conversion | -59,350 | 0 | -100.00 | ||||
| 2018-04-25 |
|
4 | LAUR |
LAUREATE EDUCATION, INC.
Class A Common Stock |
C - Conversion | 58,805 | 97,496 | 151.99 | 11.72 | 689,195 | 1,142,653 | |
| 2018-04-25 |
|
4 | LAUR |
LAUREATE EDUCATION, INC.
Class A Common Stock |
C - Conversion | 5,369,375 | 8,902,112 | 151.99 | 11.72 | 62,929,075 | 104,332,753 | |
| 2018-03-28 |
|
4 | EYE |
National Vision Holdings, Inc.
Common Stock |
S - Sale | -1,444,822 | 32,398,495 | -4.27 | 31.68 | -45,771,961 | 1,026,384,322 | |
| 2018-03-21 |
|
4 | EYE |
National Vision Holdings, Inc.
Common Stock |
S - Sale | -9,632,145 | 33,843,317 | -22.16 | 31.68 | -305,146,354 | 1,072,156,283 | |
| 2018-03-07 |
|
4 | GDDY |
GoDaddy Inc.
Units of Desert Newco, LLC |
C - Conversion | -2,310,870 | 4,688,404 | -33.02 | ||||
| 2018-03-07 |
|
4 | GDDY |
GoDaddy Inc.
Units of Desert Newco, LLC |
C - Conversion | -254,353 | 516,044 | -33.02 | ||||
| 2018-03-07 |
|
4 | GDDY |
GoDaddy Inc.
Units of Desert Newco, LLC |
C - Conversion | -55,543 | 112,689 | -33.02 | ||||
| 2018-03-07 |
|
4 | GDDY |
GoDaddy Inc.
Class A Common Stock |
S - Sale | -55,543 | 8,050 | -87.34 | 59.21 | -3,288,701 | 476,640 | |
| 2018-03-07 |
|
4 | GDDY |
GoDaddy Inc.
Class A Common Stock |
C - Conversion | 55,543 | 63,593 | 689.98 | ||||
| 2018-03-07 |
|
4 | GDDY |
GoDaddy Inc.
Class A Common Stock |
S - Sale | -254,353 | 36,864 | -87.34 | 59.21 | -15,060,241 | 2,182,717 | |
| 2018-03-07 |
|
4 | GDDY |
GoDaddy Inc.
Class A Common Stock |
C - Conversion | 254,353 | 291,217 | 689.98 | ||||
| 2018-03-07 |
|
4 | GDDY |
GoDaddy Inc.
Class A Common Stock |
S - Sale | -2,310,870 | 374,147 | -86.07 | 59.21 | -136,826,613 | 22,153,244 | |
| 2018-03-07 |
|
4 | GDDY |
GoDaddy Inc.
Class A Common Stock |
C - Conversion | 2,310,870 | 2,685,017 | 617.64 | ||||
| 2018-03-07 |
|
4 | GDDY |
GoDaddy Inc.
Class A Common Stock |
S - Sale | -777,605 | 1,623,930 | -32.38 | 59.21 | -46,041,992 | 96,152,895 | |
| 2018-03-07 |
|
4 | GDDY |
GoDaddy Inc.
Class A Common Stock |
S - Sale | -1,601,629 | 3,508,780 | -31.34 | 59.21 | -94,832,453 | 207,754,864 | |
| 2018-01-09 |
|
4 | WMIH |
WMIH CORP.
Series B Convertible Preferred Stock |
J - Other | 200,000 | 200,000 | 1,000.00 | 200,000,000 | 200,000,000 | ||
| 2018-01-09 |
|
4 | WMIH |
WMIH CORP.
Series B Convertible Preferred Stock |
J - Other | -200,000 | 0 | -100.00 | 1,000.00 | -200,000,000 | ||
| 2018-01-04 |
|
4 | FDC |
FIRST DATA CORP
Units in Director Deferred Compensation Plan |
A - Award | 1,201 | 28,577 | 4.39 | 16.65 | 20,000 | 475,801 | |
| 2017-12-06 |
|
4 | USFD |
US Foods Holding Corp.
Common Stock, par value $0.01 per share |
S - Sale | -159,822 | 0 | -100.00 | 28.00 | -4,475,016 | ||
| 2017-12-06 |
|
4 | USFD |
US Foods Holding Corp.
Common Stock, par value $0.01 per share |
S - Sale | -325,860 | 0 | -100.00 | 28.00 | -9,124,080 | ||
| 2017-12-06 |
|
4 | USFD |
US Foods Holding Corp.
Common Stock, par value $0.01 per share |
S - Sale | -355,160 | 0 | -100.00 | 28.00 | -9,944,480 | ||
| 2017-12-06 |
|
4 | USFD |
US Foods Holding Corp.
Common Stock, par value $0.01 per share |
S - Sale | -1,420,641 | 0 | -100.00 | 28.00 | -39,777,948 | ||
| 2017-12-06 |
|
4 | USFD |
US Foods Holding Corp.
Common Stock, par value $0.01 per share |
S - Sale | -17,716,289 | 0 | -100.00 | 28.00 | -496,056,092 | ||
| 2017-11-22 |
|
4 | GDI |
GARDNER DENVER HOLDINGS, INC.
Common Stock |
S - Sale | -25,250,880 | 121,157,473 | -17.25 | 26.43 | -667,443,886 | 3,202,494,905 | |
| 2017-11-03 |
|
4 | KKR |
KKR & Co. L.P.
KKR Holdings L.P. Units |
J - Other | 2,500,000 | 81,314,740 | 3.17 | ||||
| 2017-10-25 | 3 | EYE |
National Vision Holdings, Inc.
Common Stock |
86,950,924 | ||||||||
| 2017-10-25 | 3 | EYE |
National Vision Holdings, Inc.
Common Stock |
86,950,924 | ||||||||
| 2017-10-25 | 3 | EYE |
National Vision Holdings, Inc.
Common Stock |
86,950,924 | ||||||||
| 2017-10-25 | 3 | EYE |
National Vision Holdings, Inc.
Common Stock |
86,950,924 | ||||||||
| 2017-10-25 | 3 | EYE |
National Vision Holdings, Inc.
Common Stock |
86,950,924 | ||||||||
| 2017-10-25 | 3 | EYE |
National Vision Holdings, Inc.
Common Stock |
86,950,924 | ||||||||
| 2017-10-25 | 3 | EYE |
National Vision Holdings, Inc.
Common Stock |
86,950,924 | ||||||||
| 2017-10-25 | 3 | EYE |
National Vision Holdings, Inc.
Common Stock |
86,950,924 | ||||||||
| 2017-10-25 | 3 | EYE |
National Vision Holdings, Inc.
Common Stock |
86,950,924 | ||||||||
| 2017-09-20 |
|
4 | USFD |
US Foods Holding Corp.
Common Stock, par value $0.01 per share |
S - Sale | -160,000 | 159,822 | -50.03 | 27.34 | -4,374,400 | 4,369,533 | |
| 2017-09-20 |
|
4 | USFD |
US Foods Holding Corp.
Common Stock, par value $0.01 per share |
S - Sale | -326,222 | 325,860 | -50.03 | 27.34 | -8,918,909 | 8,909,012 | |
| 2017-09-20 |
|
4 | USFD |
US Foods Holding Corp.
Common Stock, par value $0.01 per share |
S - Sale | -355,556 | 355,160 | -50.03 | 27.34 | -9,720,901 | 9,710,074 | |
| 2017-09-20 |
|
4 | USFD |
US Foods Holding Corp.
Common Stock, par value $0.01 per share |
S - Sale | -1,422,222 | 1,420,641 | -50.03 | 27.34 | -38,883,549 | 38,840,325 | |
| 2017-09-20 |
|
4 | USFD |
US Foods Holding Corp.
Common Stock, par value $0.01 per share |
S - Sale | -17,736,000 | 17,716,289 | -50.03 | 27.34 | -484,902,240 | 484,363,341 | |
| 2017-09-20 |
|
4 | FDC |
FIRST DATA CORP
Class B Common Stock |
S - Sale | -97,750,000 | 438,041,146 | -18.24 | 17.17 | -1,678,670,525 | 7,522,524,404 | |
| 2017-09-12 |
|
4 | GDDY |
GoDaddy Inc.
Units of Desert Newco, LLC |
C - Conversion | -2,684,894 | 6,999,274 | -27.72 | ||||
| 2017-09-12 |
|
4 | GDDY |
GoDaddy Inc.
Units of Desert Newco, LLC |
C - Conversion | -29,522 | 770,397 | -3.69 | ||||
| 2017-09-12 |
|
4 | GDDY |
GoDaddy Inc.
Units of Desert Newco, LLC |
C - Conversion | -64,533 | 168,232 | -27.72 | ||||
| 2017-09-12 |
|
4 | GDDY |
GoDaddy Inc.
Class A Common Stock |
S - Sale | -64,533 | 8,050 | -88.91 | 43.71 | -2,820,737 | 351,866 | |
| 2017-09-12 |
|
4 | GDDY |
GoDaddy Inc.
Class A Common Stock |
C - Conversion | 64,533 | 72,583 | 801.65 | ||||
| 2017-09-12 |
|
4 | GDDY |
GoDaddy Inc.
Class A Common Stock |
S - Sale | -295,522 | 36,864 | -88.91 | 43.71 | -12,917,267 | 1,611,325 | |
| 2017-09-12 |
|
4 | GDDY |
GoDaddy Inc.
Class A Common Stock |
C - Conversion | 295,522 | 332,386 | 801.65 | ||||
| 2017-09-12 |
|
4 | GDDY |
GoDaddy Inc.
Class A Common Stock |
S - Sale | -2,684,894 | 374,147 | -87.77 | 43.71 | -117,356,717 | 16,353,965 | |
| 2017-09-12 |
|
4 | GDDY |
GoDaddy Inc.
Class A Common Stock |
C - Conversion | 2,684,894 | 3,059,041 | 717.60 | ||||
| 2017-09-12 |
|
4 | GDDY |
GoDaddy Inc.
Class A Common Stock |
S - Sale | -903,463 | 2,401,535 | -27.34 | 43.71 | -39,490,368 | 104,971,095 | |
| 2017-09-12 |
|
4 | GDDY |
GoDaddy Inc.
Class A Common Stock |
S - Sale | -1,860,860 | 5,110,409 | -26.69 | 43.71 | -81,338,191 | 223,375,977 | |
| 2017-09-05 |
|
4 | NONE |
Sentio Healthcare Properties Inc
Series B Convt Preferred Units of Sentio Partnership |
J - Other | -1,586,260 | 0 | -100.00 | ||||
| 2017-09-05 |
|
4 | NONE |
Sentio Healthcare Properties Inc
3% Senior Cumulative Preferred Stock, Series C |
J - Other | -1,000 | 0 | -100.00 | ||||
| 2017-08-16 |
|
4 | PRAH |
PRA Health Sciences, Inc.
Common Stock |
S - Sale | -9,500,000 | 13,195,984 | -41.86 | 74.85 | -711,075,000 | 987,719,402 | |
| 2017-07-06 |
|
4 | FDC |
FIRST DATA CORP
Units in Director Deferred Compensation Plan |
A - Award | 1,107 | 27,375 | 4.21 | 18.07 | 20,000 | 494,674 | |
| 2017-05-19 |
|
4 | USFD |
US Foods Holding Corp.
Common Stock, par value $0.01 per share |
S - Sale | -181,244 | 319,822 | -36.17 | 27.40 | -4,966,539 | 8,763,922 | |
| 2017-05-19 |
|
4 | USFD |
US Foods Holding Corp.
Common Stock, par value $0.01 per share |
S - Sale | -369,537 | 652,082 | -36.17 | 27.40 | -10,126,238 | 17,868,677 | |
| 2017-05-19 |
|
4 | USFD |
US Foods Holding Corp.
Common Stock, par value $0.01 per share |
S - Sale | -402,765 | 710,716 | -36.17 | 27.40 | -11,036,768 | 19,475,395 | |
| 2017-05-19 |
|
4 | USFD |
US Foods Holding Corp.
Common Stock, par value $0.01 per share |
S - Sale | -1,611,062 | 2,842,863 | -36.17 | 27.40 | -44,147,126 | 77,901,553 | |
| 2017-05-19 |
|
4 | USFD |
US Foods Holding Corp.
Common Stock, par value $0.01 per share |
S - Sale | -20,090,951 | 35,452,289 | -36.17 | 27.40 | -550,542,285 | 971,481,349 | |
| 2017-05-12 |
|
4 | GDDY |
GoDaddy Inc.
Units of Desert Newco, LLC |
S - Sale | -1,877,269 | 9,684,168 | -16.24 | 37.44 | -70,287,204 | 362,586,871 | |
| 2017-05-12 |
|
4 | GDDY |
GoDaddy Inc.
Units of Desert Newco, LLC |
S - Sale | -206,627 | 1,065,919 | -16.24 | 37.44 | -7,736,363 | 39,909,286 | |
| 2017-05-12 |
|
4 | GDDY |
GoDaddy Inc.
Units of Desert Newco, LLC |
S - Sale | -45,122 | 232,765 | -16.24 | 37.44 | -1,689,422 | 8,715,001 | |
| 2017-05-12 |
|
4 | GDDY |
GoDaddy Inc.
Units of Desert Newco, LLC |
C - Conversion | -2,806,245 | 11,561,437 | -19.53 | ||||
| 2017-05-12 |
|
4 | GDDY |
GoDaddy Inc.
Units of Desert Newco, LLC |
C - Conversion | -308,879 | 1,272,546 | -19.53 | ||||
| 2017-05-12 |
|
4 | GDDY |
GoDaddy Inc.
Units of Desert Newco, LLC |
C - Conversion | -67,449 | 277,887 | -19.53 | ||||
| 2017-05-12 |
|
4 | GDDY |
GoDaddy Inc.
Class A Common Stock |
S - Sale | -67,449 | 8,050 | -89.34 | 37.44 | -2,525,371 | 301,402 | |
| 2017-05-12 |
|
4 | GDDY |
GoDaddy Inc.
Class A Common Stock |
C - Conversion | 67,449 | 75,499 | 837.88 | ||||
| 2017-05-12 |
|
4 | GDDY |
GoDaddy Inc.
Class A Common Stock |
S - Sale | -308,879 | 36,864 | -89.34 | 37.44 | -11,564,800 | 1,380,232 | |
| 2017-05-12 |
|
4 | GDDY |
GoDaddy Inc.
Class A Common Stock |
C - Conversion | 308,879 | 345,743 | 837.89 | ||||
| 2017-05-12 |
|
4 | GDDY |
GoDaddy Inc.
Class A Common Stock |
S - Sale | -2,806,245 | 374,147 | -88.24 | 37.44 | -105,069,180 | 14,008,513 | |
| 2017-05-12 |
|
4 | GDDY |
GoDaddy Inc.
Class A Common Stock |
C - Conversion | 2,806,245 | 3,180,392 | 750.04 | ||||
| 2017-05-12 |
|
4 | GDDY |
GoDaddy Inc.
Class A Common Stock |
S - Sale | -1,575,997 | 3,304,998 | -32.29 | 37.44 | -59,007,219 | 123,743,091 | |
| 2017-05-12 |
|
4 | GDDY |
GoDaddy Inc.
Class A Common Stock |
S - Sale | -3,246,075 | 6,971,269 | -31.77 | 37.44 | -121,536,943 | 261,012,677 | |
| 2017-05-11 | 3 | GDI |
GARDNER DENVER HOLDINGS, INC.
Common Stock |
292,816,706 | ||||||||
| 2017-05-11 | 3 | GDI |
GARDNER DENVER HOLDINGS, INC.
Common Stock |
292,816,706 | ||||||||
| 2017-05-11 | 3 | GDI |
GARDNER DENVER HOLDINGS, INC.
Common Stock |
292,816,706 | ||||||||
| 2017-05-11 | 3 | GDI |
GARDNER DENVER HOLDINGS, INC.
Common Stock |
292,816,706 | ||||||||
| 2017-05-11 | 3 | GDI |
GARDNER DENVER HOLDINGS, INC.
Common Stock |
292,816,706 | ||||||||
| 2017-05-11 | 3 | GDI |
GARDNER DENVER HOLDINGS, INC.
Common Stock |
292,816,706 | ||||||||
| 2017-05-11 | 3 | GDI |
GARDNER DENVER HOLDINGS, INC.
Common Stock |
292,816,706 | ||||||||
| 2017-05-11 | 3 | GDI |
GARDNER DENVER HOLDINGS, INC.
Common Stock |
292,816,706 | ||||||||
| 2017-05-11 | 3 | GDI |
GARDNER DENVER HOLDINGS, INC.
Common Stock |
292,816,706 | ||||||||
| 2017-05-04 | 3 | KREF |
KKR Real Estate Finance Trust Inc.
Common Stock |
43,758,616 | ||||||||
| 2017-05-04 | 3 | KREF |
KKR Real Estate Finance Trust Inc.
Common Stock |
27,517,232 | ||||||||
| 2017-05-04 | 3 | KREF |
KKR Real Estate Finance Trust Inc.
Common Stock |
43,758,616 | ||||||||
| 2017-05-04 | 3 | KREF |
KKR Real Estate Finance Trust Inc.
Common Stock |
27,517,232 | ||||||||
| 2017-05-04 | 3 | KREF |
KKR Real Estate Finance Trust Inc.
Common Stock |
43,758,616 | ||||||||
| 2017-05-04 | 3 | KREF |
KKR Real Estate Finance Trust Inc.
Common Stock |
27,517,232 | ||||||||
| 2017-05-04 | 3 | KREF |
KKR Real Estate Finance Trust Inc.
Common Stock |
43,758,616 | ||||||||
| 2017-05-04 | 3 | KREF |
KKR Real Estate Finance Trust Inc.
Common Stock |
27,517,232 | ||||||||
| 2017-05-04 | 3 | KREF |
KKR Real Estate Finance Trust Inc.
Common Stock |
43,758,616 | ||||||||
| 2017-05-04 | 3 | KREF |
KKR Real Estate Finance Trust Inc.
Common Stock |
27,517,232 | ||||||||
| 2017-05-04 | 3 | KREF |
KKR Real Estate Finance Trust Inc.
Common Stock |
43,758,616 | ||||||||
| 2017-05-04 | 3 | KREF |
KKR Real Estate Finance Trust Inc.
Common Stock |
27,517,232 | ||||||||
| 2017-05-04 | 3 | KREF |
KKR Real Estate Finance Trust Inc.
Common Stock |
43,758,616 | ||||||||
| 2017-05-04 | 3 | KREF |
KKR Real Estate Finance Trust Inc.
Common Stock |
27,517,232 | ||||||||
| 2017-05-04 | 3 | KREF |
KKR Real Estate Finance Trust Inc.
Common Stock |
43,758,616 | ||||||||
| 2017-05-04 | 3 | KREF |
KKR Real Estate Finance Trust Inc.
Common Stock |
27,517,232 | ||||||||
| 2017-05-04 | 3 | KREF |
KKR Real Estate Finance Trust Inc.
Common Stock |
43,758,616 | ||||||||
| 2017-05-04 | 3 | KREF |
KKR Real Estate Finance Trust Inc.
Common Stock |
27,517,232 | ||||||||
| 2017-05-04 | 3 | KREF |
KKR Real Estate Finance Trust Inc.
Common Stock |
43,758,616 | ||||||||
| 2017-05-04 | 3 | KREF |
KKR Real Estate Finance Trust Inc.
Common Stock |
27,517,232 | ||||||||
| 2017-05-04 | 3 | KREF |
KKR Real Estate Finance Trust Inc.
Common Stock |
43,758,616 | ||||||||
| 2017-05-04 | 3 | KREF |
KKR Real Estate Finance Trust Inc.
Common Stock |
27,517,232 | ||||||||
| 2017-04-21 |
|
4 | HCC |
WARRIOR MET COAL, INC.
Common Stock |
S - Sale | -2,389,274 | 4,071,745 | -36.98 | 17.81 | -42,558,943 | 72,527,958 | |
| 2017-04-13 | 3 | HCC |
WARRIOR MET COAL, INC.
Common Stock |
12,922,038 | ||||||||
| 2017-04-13 | 3 | HCC |
WARRIOR MET COAL, INC.
Common Stock |
12,922,038 | ||||||||
| 2017-04-13 | 3 | HCC |
WARRIOR MET COAL, INC.
Common Stock |
12,922,038 | ||||||||
| 2017-04-13 | 3 | HCC |
WARRIOR MET COAL, INC.
Common Stock |
12,922,038 | ||||||||
| 2017-04-13 | 3 | HCC |
WARRIOR MET COAL, INC.
Common Stock |
12,922,038 | ||||||||
| 2017-04-13 | 3 | HCC |
WARRIOR MET COAL, INC.
Common Stock |
12,922,038 | ||||||||
| 2017-04-13 | 3 | HCC |
WARRIOR MET COAL, INC.
Common Stock |
12,922,038 | ||||||||
| 2017-04-13 | 3 | HCC |
WARRIOR MET COAL, INC.
Common Stock |
12,922,038 | ||||||||
| 2017-04-13 | 3 | HCC |
WARRIOR MET COAL, INC.
Common Stock |
12,922,038 | ||||||||
| 2017-04-13 | 3 | HCC |
WARRIOR MET COAL, INC.
Common Stock |
12,922,038 | ||||||||
| 2017-04-13 | 3 | HCC |
WARRIOR MET COAL, INC.
Common Stock |
12,922,038 | ||||||||
| 2017-02-08 |
|
4 | LAUR |
LAUREATE EDUCATION, INC.
Class A Common Stock |
P - Purchase | 38,691 | 38,691 | 14.00 | 541,674 | 541,674 | ||
| 2017-02-08 |
|
4 | LAUR |
LAUREATE EDUCATION, INC.
Class A Common Stock |
P - Purchase | 3,532,737 | 3,532,737 | 14.00 | 49,458,318 | 49,458,318 | ||
| 2017-02-02 |
|
4 | USFD |
US Foods Holding Corp.
Common Stock, par value $0.01 per share |
S - Sale | -165,600 | 501,066 | -24.84 | 25.09 | -4,154,904 | 12,571,746 | |
| 2017-02-02 |
|
4 | USFD |
US Foods Holding Corp.
Common Stock, par value $0.01 per share |
S - Sale | -337,640 | 1,021,619 | -24.84 | 25.09 | -8,471,388 | 25,632,421 | |
| 2017-02-02 |
|
4 | USFD |
US Foods Holding Corp.
Common Stock, par value $0.01 per share |
S - Sale | -368,000 | 1,113,481 | -24.84 | 25.09 | -9,233,120 | 27,937,238 | |
| 2017-02-02 |
|
4 | USFD |
US Foods Holding Corp.
Common Stock, par value $0.01 per share |
S - Sale | -1,472,000 | 4,453,925 | -24.84 | 25.09 | -36,932,480 | 111,748,978 | |
| 2017-02-02 |
|
4 | USFD |
US Foods Holding Corp.
Common Stock, par value $0.01 per share |
S - Sale | -18,356,760 | 55,543,240 | -24.84 | 25.09 | -460,571,108 | 1,393,579,892 | |
| 2017-01-04 |
|
4 | FDC |
FIRST DATA CORP
Units in Director Deferred Compensation Plan |
A - Award | 1,409 | 26,269 | 5.67 | 14.19 | 20,000 | 372,752 | |
| 2016-12-16 |
|
4 | FDC |
FIRST DATA CORP
Class B Common Stock |
J - Other | 0 | 535,791,146 | 0.00 | ||||
| 2016-12-16 |
|
4 | USFD |
US Foods Holding Corp.
Common Stock, par value $0.01 per share |
J - Other | 0 | 5,925,925 | 0.00 | ||||
| 2016-11-18 |
|
4 | PRAH |
PRA Health Sciences, Inc.
Common Stock |
S - Sale | -7,500,000 | 22,695,984 | -24.84 | 55.51 | -416,325,000 | 1,259,854,072 | |
| 2016-08-08 |
|
4/A | GDDY |
GoDaddy Inc.
Units of Desert Newco, LLC |
C - Conversion | -2,274,280 | 14,367,682 | -13.67 | ||||
| 2016-08-08 |
|
4/A | GDDY |
GoDaddy Inc.
Units of Desert Newco, LLC |
C - Conversion | -250,325 | 1,581,425 | -13.67 | ||||
| 2016-08-08 |
|
4/A | GDDY |
GoDaddy Inc.
Units of Desert Newco, LLC |
C - Conversion | -54,664 | 345,336 | -13.67 | ||||
| 2016-08-08 |
|
4/A | GDDY |
GoDaddy Inc.
Class A Common Stock |
S - Sale | -54,664 | 8,050 | -87.16 | 29.27 | -1,599,846 | 235,599 | |
| 2016-08-08 |
|
4/A | GDDY |
GoDaddy Inc.
Class A Common Stock |
C - Conversion | 54,664 | 62,714 | 679.06 | ||||
| 2016-08-08 |
|
4/A | GDDY |
GoDaddy Inc.
Class A Common Stock |
S - Sale | -250,325 | 36,864 | -87.16 | 29.27 | -7,326,237 | 1,078,895 | |
| 2016-08-08 |
|
4/A | GDDY |
GoDaddy Inc.
Class A Common Stock |
C - Conversion | 250,325 | 287,189 | 679.05 | ||||
| 2016-08-08 |
|
4/A | GDDY |
GoDaddy Inc.
Class A Common Stock |
S - Sale | -2,274,280 | 374,147 | -85.87 | 29.27 | -66,561,125 | 10,950,123 | |
| 2016-08-08 |
|
4/A | GDDY |
GoDaddy Inc.
Class A Common Stock |
C - Conversion | 2,274,280 | 2,648,427 | 607.86 | ||||
| 2016-08-08 |
|
4/A | GDDY |
GoDaddy Inc.
Class A Common Stock |
S - Sale | -765,293 | 4,880,995 | -13.55 | 29.27 | -22,397,754 | 142,851,593 | |
| 2016-08-08 |
|
4/A | GDDY |
GoDaddy Inc.
Class A Common Stock |
S - Sale | -1,576,271 | 10,217,344 | -13.37 | 29.27 | -46,132,566 | 299,029,985 | |
| 2016-07-05 |
|
4 | FDC |
FIRST DATA CORP
Units in Director Deferred Compensation Plan |
A - Award | 1,807 | 24,859 | 7.84 | 11.07 | 20,000 | 275,191 | |
| 2016-05-25 | 3 | USFD |
US Foods Holding Corp.
Common Stock, par value $0.01 per share |
157,233,331 | ||||||||
| 2016-05-25 | 3 | USFD |
US Foods Holding Corp.
Common Stock, par value $0.01 per share |
89,259,256 | ||||||||
| 2016-05-25 | 3 | USFD |
US Foods Holding Corp.
Common Stock, par value $0.01 per share |
84,814,812 | ||||||||
| 2016-05-25 | 3 | USFD |
US Foods Holding Corp.
Common Stock, par value $0.01 per share |
84,692,590 | ||||||||
| 2016-05-25 | 3 | USFD |
US Foods Holding Corp.
Common Stock, par value $0.01 per share |
83,999,997 | ||||||||
| 2016-05-25 | 3 | USFD |
US Foods Holding Corp.
Common Stock, par value $0.01 per share |
157,233,331 | ||||||||
| 2016-05-25 | 3 | USFD |
US Foods Holding Corp.
Common Stock, par value $0.01 per share |
89,259,256 | ||||||||
| 2016-05-25 | 3 | USFD |
US Foods Holding Corp.
Common Stock, par value $0.01 per share |
84,814,812 | ||||||||
| 2016-05-25 | 3 | USFD |
US Foods Holding Corp.
Common Stock, par value $0.01 per share |
84,692,590 | ||||||||
| 2016-05-25 | 3 | USFD |
US Foods Holding Corp.
Common Stock, par value $0.01 per share |
83,999,997 | ||||||||
| 2016-05-12 |
|
4 | HCA |
HCA Holdings, Inc.
Common Stock, par value $0.01 per share |
S - Sale | -332,799 | 208,507 | -61.48 | 80.12 | -26,663,856 | 16,705,581 | |
| 2016-05-12 |
|
4 | HCA |
HCA Holdings, Inc.
Common Stock, par value $0.01 per share |
S - Sale | -381,309 | 238,899 | -61.48 | 80.12 | -30,550,477 | 19,140,620 | |
| 2016-05-12 |
|
4 | HCA |
HCA Holdings, Inc.
Common Stock, par value $0.01 per share |
S - Sale | -78,529 | 49,200 | -61.48 | 80.12 | -6,291,743 | 3,941,936 | |
| 2016-05-12 |
|
4 | HCA |
HCA Holdings, Inc.
Common Stock, par value $0.01 per share |
S - Sale | -127,923 | 80,148 | -61.48 | 80.12 | -10,249,191 | 6,421,426 | |
| 2016-05-12 |
|
4 | HCA |
HCA Holdings, Inc.
Common Stock, par value $0.01 per share |
S - Sale | -1,249,115 | 782,602 | -61.48 | 80.12 | -100,079,094 | 62,702,064 | |
| 2016-05-12 |
|
4 | HCA |
HCA Holdings, Inc.
Common Stock, par value $0.01 per share |
S - Sale | -3,461,161 | 2,168,506 | -61.48 | 80.12 | -277,308,219 | 173,740,717 | |
| 2016-05-12 |
|
4 | HCA |
HCA Holdings, Inc.
Common Stock, par value $0.01 per share |
S - Sale | -3,730,122 | 2,337,018 | -61.48 | 80.12 | -298,857,375 | 187,241,890 | |
| 2016-05-12 |
|
4 | HCA |
HCA Holdings, Inc.
Common Stock, par value $0.01 per share |
J - Other | -541,306 | 2,031,717 | -21.04 | 51.98 | -28,134,379 | 105,598,486 | |
| 2016-05-10 |
|
4 | PRAH |
PRA Health Sciences, Inc.
Common Stock |
S - Sale | -4,907,692 | 30,195,984 | -13.98 | 46.70 | -229,189,216 | 1,410,152,453 | |
| 2016-04-14 |
|
4 | GDDY |
GoDaddy Inc.
Units of Desert Newco, LLC |
C - Conversion | -2,274,280 | 14,367,682 | -13.67 | ||||
| 2016-04-14 |
|
4 | GDDY |
GoDaddy Inc.
Units of Desert Newco, LLC |
C - Conversion | -250,325 | 1,581,425 | -13.67 | ||||
| 2016-04-14 |
|
4 | GDDY |
GoDaddy Inc.
Units of Desert Newco, LLC |
C - Conversion | -54,664 | 345,336 | -13.67 | ||||
| 2016-04-14 |
|
4 | GDDY |
GoDaddy Inc.
Class A Common Stock |
S - Sale | -54,664 | 8,050 | -87.16 | 29.27 | -1,599,846 | 235,599 | |
| 2016-04-14 |
|
4 | GDDY |
GoDaddy Inc.
Class A Common Stock |
C - Conversion | 54,664 | 62,714 | 679.06 | ||||
| 2016-04-14 |
|
4 | GDDY |
GoDaddy Inc.
Class A Common Stock |
S - Sale | -250,325 | 36,864 | -87.16 | 29.27 | -7,326,237 | 1,078,895 | |
| 2016-04-14 |
|
4 | GDDY |
GoDaddy Inc.
Class A Common Stock |
C - Conversion | 250,325 | 287,189 | 679.05 | ||||
| 2016-04-14 |
|
4 | GDDY |
GoDaddy Inc.
Class A Common Stock |
S - Sale | -2,274,280 | 374,147 | -85.87 | 29.27 | -66,561,125 | 10,950,123 | |
| 2016-04-14 |
|
4 | GDDY |
GoDaddy Inc.
Class A Common Stock |
C - Conversion | 2,274,280 | 2,648,427 | 607.86 | ||||
| 2016-04-14 |
|
4 | GDDY |
GoDaddy Inc.
Class A Common Stock |
S - Sale | -765,293 | 4,880,995 | -13.55 | 29.27 | -22,397,754 | 142,851,593 | |
| 2016-04-14 |
|
4 | GDDY |
GoDaddy Inc.
Class A Common Stock |
S - Sale | -1,576,271 | 10,217,344 | -13.37 | 29.27 | -46,132,566 | 299,029,985 | |
| 2016-03-10 |
|
4 | PRAH |
PRA Health Sciences, Inc.
Common Stock |
S - Sale | -4,829,981 | 35,103,676 | -12.10 | 42.26 | -204,114,997 | 1,483,481,348 | |
| 2015-09-25 |
|
4 | SJM |
J M SMUCKER Co
Common Stock, without par value |
S - Sale | -8,277,495 | 0 | -100.00 | 113.31 | -937,922,958 | ||
| 2015-06-30 | 3 | ZBH |
ZIMMER BIOMET HOLDINGS, INC.
Common Stock |
15,059,280 | ||||||||
| 2015-06-30 | 3 | ZBH |
ZIMMER BIOMET HOLDINGS, INC.
Common Stock |
15,059,280 | ||||||||
| 2015-06-30 | 3 | ZBH |
ZIMMER BIOMET HOLDINGS, INC.
Common Stock |
15,059,280 | ||||||||
| 2015-06-30 | 3 | ZBH |
ZIMMER BIOMET HOLDINGS, INC.
Common Stock |
15,059,280 | ||||||||
| 2015-06-26 |
|
4 | NONE |
LVB Acquisition, Inc.
Common Stock |
J - Other | -134,008,582 | 0 | -100.00 | ||||
| 2015-05-27 |
|
4 | NONE |
Sentio Healthcare Properties Inc
Series B Convt Preferred Units of Sentio Partnership |
P - Purchase | 484,700 | 1,586,260 | 44.00 | 100.00 | 48,470,000 | 158,626,000 | |
| 2015-04-09 | 3 | WG |
Willbros Group, Inc.\NEW\
Common Stock, $0.05 par value |
20,250,820 | ||||||||
| 2015-04-09 | 3 | WG |
Willbros Group, Inc.\NEW\
Common Stock, $0.05 par value |
20,250,820 | ||||||||
| 2015-04-09 | 3 | WG |
Willbros Group, Inc.\NEW\
Common Stock, $0.05 par value |
20,250,820 | ||||||||
| 2015-04-09 | 3 | WG |
Willbros Group, Inc.\NEW\
Common Stock, $0.05 par value |
20,250,820 | ||||||||
| 2015-04-09 | 3 | WG |
Willbros Group, Inc.\NEW\
Common Stock, $0.05 par value |
20,250,820 | ||||||||
| 2015-04-09 | 3 | WG |
Willbros Group, Inc.\NEW\
Common Stock, $0.05 par value |
20,250,820 | ||||||||
| 2015-04-09 | 3 | WG |
Willbros Group, Inc.\NEW\
Common Stock, $0.05 par value |
20,250,820 | ||||||||
| 2015-04-09 | 3 | WG |
Willbros Group, Inc.\NEW\
Common Stock, $0.05 par value |
20,250,820 | ||||||||
| 2015-04-09 | 3 | WG |
Willbros Group, Inc.\NEW\
Common Stock, $0.05 par value |
20,250,820 | ||||||||
| 2015-04-09 | 3 | WG |
Willbros Group, Inc.\NEW\
Common Stock, $0.05 par value |
20,250,820 | ||||||||
| 2015-04-09 | 3 | WG |
Willbros Group, Inc.\NEW\
Common Stock, $0.05 par value |
20,250,820 | ||||||||
| 2015-04-02 | 3 | SJM |
J M SMUCKER Co
Common Stock, without par value |
16,554,990 | ||||||||
| 2015-04-02 | 3 | SJM |
J M SMUCKER Co
Common Stock, without par value |
16,554,990 | ||||||||
| 2015-04-02 | 3 | SJM |
J M SMUCKER Co
Common Stock, without par value |
16,554,990 | ||||||||
| 2015-04-02 | 3 | SJM |
J M SMUCKER Co
Common Stock, without par value |
16,554,990 | ||||||||
| 2015-04-02 | 3 | SJM |
J M SMUCKER Co
Common Stock, without par value |
16,554,990 | ||||||||
| 2015-04-02 | 3 | SJM |
J M SMUCKER Co
Common Stock, without par value |
16,554,990 | ||||||||
| 2015-04-02 | 3 | SJM |
J M SMUCKER Co
Common Stock, without par value |
16,554,990 | ||||||||
| 2015-04-02 | 3 | SJM |
J M SMUCKER Co
Common Stock, without par value |
16,554,990 | ||||||||
| 2015-04-02 | 3 | SJM |
J M SMUCKER Co
Common Stock, without par value |
16,554,990 | ||||||||
| 2015-04-01 | 3 | GDDY |
GoDaddy Inc.
Class A Common Stock |
29,652,579 | ||||||||
| 2015-04-01 | 3 | GDDY |
GoDaddy Inc.
Class A Common Stock |
23,505,252 | ||||||||
| 2015-04-01 | 3 | GDDY |
GoDaddy Inc.
Class A Common Stock |
18,233,111 | ||||||||
| 2015-04-01 | 3 | GDDY |
GoDaddy Inc.
Class A Common Stock |
17,895,828 | ||||||||
| 2015-04-01 | 3 | GDDY |
GoDaddy Inc.
Class A Common Stock |
17,867,014 | ||||||||
| 2015-04-01 | 3 | GDDY |
GoDaddy Inc.
Class A Common Stock |
29,652,579 | ||||||||
| 2015-04-01 | 3 | GDDY |
GoDaddy Inc.
Class A Common Stock |
23,505,252 | ||||||||
| 2015-04-01 | 3 | GDDY |
GoDaddy Inc.
Class A Common Stock |
18,233,111 | ||||||||
| 2015-04-01 | 3 | GDDY |
GoDaddy Inc.
Class A Common Stock |
17,895,828 | ||||||||
| 2015-04-01 | 3 | GDDY |
GoDaddy Inc.
Class A Common Stock |
17,867,014 | ||||||||
| 2015-03-09 |
|
4 | NLSN |
Nielsen N.V.
Common Stock |
S - Sale | -3,336,440 | 12,401,027 | -21.20 | 45.00 | -150,139,800 | 558,046,215 | |
| 2015-03-09 |
|
4 | NLSN |
Nielsen N.V.
Common Stock |
S - Sale | -663,560 | 2,466,349 | -21.20 | 45.00 | -29,860,200 | 110,985,705 | |
| 2015-03-05 |
|
4 | KKR |
KKR & Co. L.P.
Common Units |
G - Gift | -1,000,000 | 1,000,000 | -50.00 | ||||
| 2015-03-04 | 3 | EGL |
Engility Holdings, Inc.
Common Stock, par value $0.01 per share |
17,920,892 | ||||||||
| 2015-03-04 | 3 | EGL |
Engility Holdings, Inc.
Common Stock, par value $0.01 per share |
17,920,892 | ||||||||
| 2015-03-04 | 3 | EGL |
Engility Holdings, Inc.
Common Stock, par value $0.01 per share |
17,920,892 | ||||||||
| 2015-03-04 | 3 | EGL |
Engility Holdings, Inc.
Common Stock, par value $0.01 per share |
17,920,892 | ||||||||
| 2015-03-04 | 3 | EGL |
Engility Holdings, Inc.
Common Stock, par value $0.01 per share |
17,920,892 | ||||||||
| 2015-03-04 | 3 | EGL |
Engility Holdings, Inc.
Common Stock, par value $0.01 per share |
17,920,892 | ||||||||
| 2015-03-04 | 3 | EGL |
Engility Holdings, Inc.
Common Stock, par value $0.01 per share |
17,920,892 | ||||||||
| 2015-03-04 | 3 | EGL |
Engility Holdings, Inc.
Common Stock, par value $0.01 per share |
17,920,892 | ||||||||
| 2015-03-04 | 3 | EGL |
Engility Holdings, Inc.
Common Stock, par value $0.01 per share |
17,920,892 | ||||||||
| 2015-01-21 |
|
4 | NONE |
Sentio Healthcare Properties Inc
Series B Convt Preferred Units of Sentio Partnership |
P - Purchase | 155,000 | 1,101,560 | 16.38 | 100.00 | 15,500,000 | 110,156,000 | |
| 2015-01-07 |
|
4 | WMIH |
WMI HOLDINGS CORP.
3% Series B Convertible Preferred Stock |
P - Purchase | 200,000 | 200,000 | 1,000.00 | 200,000,000 | 200,000,000 | ||
| 2014-12-31 |
|
4 | NONE |
Sentio Healthcare Properties Inc
Series B Convt Preferred Units of Sentio Partnership |
P - Purchase | 341,400 | 946,560 | 56.41 | 100.00 | 34,140,000 | 94,656,000 | |
| 2014-12-31 | 3 | WBA |
Walgreens Boots Alliance, Inc.
Common Stock |
149,652,400 | ||||||||
| 2014-12-31 | 3 | WBA |
Walgreens Boots Alliance, Inc.
Common Stock |
148,119,747 | ||||||||
| 2014-12-31 | 3 | WBA |
Walgreens Boots Alliance, Inc.
Common Stock |
146,873,003 | ||||||||
| 2014-12-31 | 3 | WBA |
Walgreens Boots Alliance, Inc.
Common Stock |
146,093,133 | ||||||||
| 2014-12-31 | 3 | WBA |
Walgreens Boots Alliance, Inc.
Common Stock |
146,104,323 | ||||||||
| 2014-12-31 | 3 | WBA |
Walgreens Boots Alliance, Inc.
Common Stock |
146,088,878 | ||||||||
| 2014-12-31 | 3 | WBA |
Walgreens Boots Alliance, Inc.
Common Stock |
285,778,028 | ||||||||
| 2014-12-31 | 3 | WBA |
Walgreens Boots Alliance, Inc.
Common Stock |
149,652,400 | ||||||||
| 2014-12-31 | 3 | WBA |
Walgreens Boots Alliance, Inc.
Common Stock |
148,119,747 | ||||||||
| 2014-12-31 | 3 | WBA |
Walgreens Boots Alliance, Inc.
Common Stock |
146,873,003 | ||||||||
| 2014-12-31 | 3 | WBA |
Walgreens Boots Alliance, Inc.
Common Stock |
146,093,133 | ||||||||
| 2014-12-31 | 3 | WBA |
Walgreens Boots Alliance, Inc.
Common Stock |
146,104,323 | ||||||||
| 2014-12-31 | 3 | WBA |
Walgreens Boots Alliance, Inc.
Common Stock |
146,088,878 | ||||||||
| 2014-12-31 | 3 | WBA |
Walgreens Boots Alliance, Inc.
Common Stock |
285,778,028 | ||||||||
| 2014-12-17 |
|
4 | NONE |
Sentio Healthcare Properties Inc
Series B Convt Preferred Units of Sentio Partnership |
P - Purchase | 56,880 | 605,160 | 10.37 | 100.00 | 5,688,000 | 60,516,000 | |
| 2014-11-18 |
|
4 | NONE |
Sentio Healthcare Properties Inc
Series B Convt Preferred Units of Sentio Partnership |
P - Purchase | 86,710 | 548,280 | 18.79 | 100.00 | 8,671,000 | 54,828,000 | |
| 2014-11-14 |
|
4 | CHRS |
Coherus BioSciences, Inc.
Series C Preferred Stock |
C - Conversion | -2,499,499 | 0 | -100.00 | ||||
| 2014-11-14 |
|
4 | CHRS |
Coherus BioSciences, Inc.
Common Stock |
C - Conversion | 2,499,499 | 2,499,499 | |||||
| 2014-11-12 | 3 | PRAH |
PRA Health Sciences, Inc.
Common Stock |
79,867,314 | ||||||||
| 2014-11-12 | 3 | PRAH |
PRA Health Sciences, Inc.
Common Stock |
79,867,314 | ||||||||
| 2014-11-12 | 3 | PRAH |
PRA Health Sciences, Inc.
Common Stock |
79,867,314 | ||||||||
| 2014-11-12 | 3 | PRAH |
PRA Health Sciences, Inc.
Common Stock |
79,867,314 | ||||||||
| 2014-11-12 | 3 | PRAH |
PRA Health Sciences, Inc.
Common Stock |
79,867,314 | ||||||||
| 2014-11-12 | 3 | PRAH |
PRA Health Sciences, Inc.
Common Stock |
79,867,314 | ||||||||
| 2014-11-12 | 3 | PRAH |
PRA Health Sciences, Inc.
Common Stock |
79,867,314 | ||||||||
| 2014-11-12 | 3 | PRAH |
PRA Health Sciences, Inc.
Common Stock |
79,867,314 | ||||||||
| 2014-11-12 | 3 | PRAH |
PRA Health Sciences, Inc.
Common Stock |
79,867,314 | ||||||||
| 2014-11-07 |
|
4 | KKR |
KKR & Co. L.P.
KKR Holdings L.P. Units |
C - Conversion | -1,000,000 | 0 | -100.00 | ||||
| 2014-11-07 |
|
4 | KKR |
KKR & Co. L.P.
Common Units |
C - Conversion | 1,000,000 | 2,000,000 | 100.00 | ||||
| 2014-11-07 |
|
4 | KKR |
KKR & Co. L.P.
KKR Holdings L.P. Units |
G - Gift | 1,000,000 | 1,000,000 | |||||
| 2014-11-07 |
|
4 | KKR |
KKR & Co. L.P.
KKR Holdings L.P. Units |
G - Gift | -1,000,000 | 78,814,740 | -1.25 | ||||
| 2014-09-10 |
|
4 | SC |
Santander Consumer USA Holdings Inc.
Common Stock, par value $0.01 per share |
S - Sale | -5,023,977 | 0 | -100.00 | 18.65 | -93,697,162 | ||
| 2014-08-15 |
|
4 | NONE |
Sentio Healthcare Properties Inc
Series B Convt Preferred Units of Sentio Partnership |
P - Purchase | 127,310 | 461,570 | 38.09 | 100.00 | 12,731,000 | 46,157,000 | |
| 2014-06-17 |
|
4 | NONE |
Sentio Healthcare Properties Inc
Series B Convt Preferred Units of Sentio Partnership |
P - Purchase | 87,260 | 334,260 | 35.33 | 100.00 | 8,726,000 | 33,426,000 | |
| 2014-05-28 |
|
4 | HCA |
HCA Holdings, Inc.
Common Stock, par value $0.01 per share |
S - Sale | -296,434 | 620,208 | -32.34 | 51.53 | -15,275,244 | 31,959,339 | |
| 2014-05-28 |
|
4 | HCA |
HCA Holdings, Inc.
Common Stock, par value $0.01 per share |
S - Sale | -305,505 | 916,642 | -25.00 | 51.53 | -15,742,673 | 47,234,583 | |
| 2014-05-28 |
|
4 | HCA |
HCA Holdings, Inc.
Common Stock, par value $0.01 per share |
S - Sale | -61,049 | 127,729 | -32.34 | 51.53 | -3,145,855 | 6,581,896 | |
| 2014-05-28 |
|
4 | HCA |
HCA Holdings, Inc.
Common Stock, par value $0.01 per share |
S - Sale | -62,917 | 188,778 | -25.00 | 51.53 | -3,242,113 | 9,727,751 | |
| 2014-05-28 |
|
4 | HCA |
HCA Holdings, Inc.
Common Stock, par value $0.01 per share |
S - Sale | -99,449 | 208,071 | -32.34 | 51.53 | -5,124,607 | 10,721,878 | |
| 2014-05-28 |
|
4 | HCA |
HCA Holdings, Inc.
Common Stock, par value $0.01 per share |
S - Sale | -102,492 | 307,520 | -25.00 | 51.53 | -5,281,413 | 15,846,485 | |
| 2014-05-28 |
|
4 | HCA |
HCA Holdings, Inc.
Common Stock, par value $0.01 per share |
S - Sale | -1,229,797 | 2,573,023 | -32.34 | 51.53 | -63,371,439 | 132,587,870 | |
| 2014-05-28 |
|
4 | HCA |
HCA Holdings, Inc.
Common Stock, par value $0.01 per share |
S - Sale | -1,267,429 | 3,802,820 | -25.00 | 51.53 | -65,310,616 | 195,959,309 | |
| 2014-05-28 |
|
4 | HCA |
HCA Holdings, Inc.
Common Stock, par value $0.01 per share |
S - Sale | -2,690,746 | 5,629,667 | -32.34 | 51.53 | -138,654,141 | 290,096,751 | |
| 2014-05-28 |
|
4 | HCA |
HCA Holdings, Inc.
Common Stock, par value $0.01 per share |
S - Sale | -2,773,083 | 8,320,413 | -25.00 | 51.53 | -142,896,967 | 428,750,892 | |
| 2014-05-28 |
|
4 | HCA |
HCA Holdings, Inc.
Common Stock, par value $0.01 per share |
S - Sale | -2,899,839 | 6,067,140 | -32.34 | 51.53 | -149,428,704 | 312,639,729 | |
| 2014-05-28 |
|
4 | HCA |
HCA Holdings, Inc.
Common Stock, par value $0.01 per share |
S - Sale | -2,988,574 | 8,966,979 | -25.00 | 51.53 | -154,001,218 | 462,068,433 | |
| 2014-05-02 |
|
4 | KKR |
KKR & Co. L.P.
Common Units |
A - Award | 15,227 | 15,227 | |||||
| 2014-05-02 |
|
4 | KKR |
KKR & Co. L.P.
Common Units |
A - Award | 30,454 | 43,299 | 237.09 | ||||
| 2014-05-02 |
|
4 | KKR |
KKR & Co. L.P.
Common Units |
A - Award | 130,925 | 130,925 | |||||
| 2014-05-02 |
|
4 | KKR |
KKR & Co. L.P.
Common Units |
A - Award | 910,043 | 1,105,832 | 464.81 | ||||
| 2014-04-09 |
|
4 | NONE |
Sentio Healthcare Properties Inc
Series B Convt Preferred Units of Sentio Partnership |
P - Purchase | 54,000 | 247,000 | 27.98 | 100.00 | 5,400,000 | 24,700,000 | |
| 2014-04-03 |
|
4 | AMED |
AMEDISYS INC
Common Stock |
J - Other | 16,639 | 42,053 | 65.47 | 14.89 | 247,755 | 626,169 | |
| 2014-03-12 |
|
4 | NLSN |
Nielsen Holdings N.V.
Common Stock |
S - Sale | -5,170,057 | 15,737,467 | -24.73 | 46.25 | -239,115,136 | 727,857,849 | |
| 2014-03-12 |
|
4 | NLSN |
Nielsen Holdings N.V.
Common Stock |
S - Sale | -1,028,235 | 3,129,909 | -24.73 | 46.25 | -47,555,869 | 144,758,291 | |
| 2014-02-21 |
|
4 | KKR |
KKR & Co. L.P.
KKR Holdings L.P. Units |
C - Conversion | -1,000,000 | 0 | -100.00 | ||||
| 2014-02-21 |
|
4 | KKR |
KKR & Co. L.P.
Common Units |
C - Conversion | 1,000,000 | 1,000,000 | |||||
| 2014-02-12 |
|
4 | KKR |
KKR & Co. L.P.
Common Units |
G - Gift | -1,500,000 | 0 | -100.00 | ||||
| 2014-02-12 |
|
4 | KKR |
KKR & Co. L.P.
KKR Holdings L.P. Units |
G - Gift | 1,000,000 | 1,000,000 | |||||
| 2014-02-12 |
|
4 | KKR |
KKR & Co. L.P.
KKR Holdings L.P. Units |
G - Gift | -1,000,000 | 79,814,740 | -1.24 | ||||
| 2014-01-30 |
|
4 | SC |
Santander Consumer USA Holdings Inc.
Common Stock, par value $0.01 per share |
S - Sale | -24,392,927 | 5,023,977 | -82.92 | 23.04 | -562,013,038 | 115,752,419 | |
| 2014-01-22 | 3 | SC |
Santander Consumer USA Holdings Inc.
Common Stock, par value $0.01 per share |
29,416,904 | ||||||||
| 2013-12-09 |
|
4 | NONE |
Sentio Healthcare Properties Inc
Series B Convt Preferred Units of Sentio Partnership |
P - Purchase | 51,000 | 193,000 | 35.92 | 100.00 | 5,100,000 | 19,300,000 | |
| 2013-11-29 |
|
4 | NLSN |
Nielsen Holdings N.V.
Common Stock |
S - Sale | -5,170,057 | 20,907,524 | -19.83 | 39.09 | -202,097,528 | 817,275,113 | |
| 2013-11-29 |
|
4 | NLSN |
Nielsen Holdings N.V.
Common Stock |
S - Sale | -1,028,235 | 4,158,144 | -19.83 | 39.09 | -40,193,706 | 162,541,849 | |
| 2013-11-21 |
|
4 | AMED |
AMEDISYS INC
Common Stock |
P - Purchase | 80,000 | 4,836,608 | 1.68 | 14.77 | 1,181,416 | 71,425,576 | |
| 2013-11-21 |
|
4 | AMED |
AMEDISYS INC
Common Stock |
P - Purchase | 156,917 | 4,756,608 | 3.41 | 14.39 | 2,257,392 | 68,428,087 | |
| 2013-11-21 |
|
4 | AMED |
AMEDISYS INC
Common Stock |
P - Purchase | 188,598 | 4,599,691 | 4.28 | 14.43 | 2,720,715 | 66,355,142 | |
| 2013-11-14 |
|
4 | AMED |
AMEDISYS INC
Common Stock |
P - Purchase | 165,000 | 4,411,115 | 3.89 | 13.53 | 2,232,384 | 59,680,622 | |
| 2013-11-14 |
|
4 | AMED |
AMEDISYS INC
Common Stock |
P - Purchase | 300,000 | 4,246,115 | 7.60 | 13.37 | 4,010,310 | 56,760,791 | |
| 2013-11-14 |
|
4 | AMED |
AMEDISYS INC
Common Stock |
P - Purchase | 468,167 | 3,946,115 | 13.46 | 14.36 | 6,721,380 | 56,653,584 | |
| 2013-11-14 |
|
4 | AMED |
AMEDISYS INC
Common Stock |
P - Purchase | 13,333 | 3,477,948 | 0.38 | 13.98 | 186,438 | 48,632,842 | |
| 2013-11-05 |
|
4 | HCA |
HCA Holdings, Inc.
Common Stock, par value $0.01 per share |
S - Sale | -217,039 | 1,222,147 | -15.08 | 46.92 | -10,183,470 | 57,343,156 | |
| 2013-11-05 |
|
4 | HCA |
HCA Holdings, Inc.
Common Stock, par value $0.01 per share |
S - Sale | -611,009 | 1,439,186 | -29.80 | 46.92 | -28,668,542 | 67,526,626 | |
| 2013-11-05 |
|
4 | HCA |
HCA Holdings, Inc.
Common Stock, par value $0.01 per share |
S - Sale | -44,698 | 251,695 | -15.08 | 46.92 | -2,097,230 | 11,809,548 | |
| 2013-11-05 |
|
4 | HCA |
HCA Holdings, Inc.
Common Stock, par value $0.01 per share |
S - Sale | -125,834 | 296,393 | -29.80 | 46.92 | -5,904,131 | 13,906,778 | |
| 2013-11-05 |
|
4 | HCA |
HCA Holdings, Inc.
Common Stock, par value $0.01 per share |
S - Sale | -72,813 | 410,012 | -15.08 | 46.92 | -3,416,386 | 19,237,744 | |
| 2013-11-05 |
|
4 | HCA |
HCA Holdings, Inc.
Common Stock, par value $0.01 per share |
S - Sale | -204,984 | 482,825 | -29.80 | 46.92 | -9,617,849 | 22,654,130 | |
| 2013-11-05 |
|
4 | HCA |
HCA Holdings, Inc.
Common Stock, par value $0.01 per share |
S - Sale | -900,419 | 5,070,249 | -15.08 | 46.92 | -42,247,659 | 237,896,078 | |
| 2013-11-05 |
|
4 | HCA |
HCA Holdings, Inc.
Common Stock, par value $0.01 per share |
S - Sale | -2,534,859 | 5,970,668 | -29.80 | 46.92 | -118,935,584 | 280,143,738 | |
| 2013-11-05 |
|
4 | HCA |
HCA Holdings, Inc.
Common Stock, par value $0.01 per share |
S - Sale | -1,970,078 | 11,093,496 | -15.08 | 46.92 | -92,436,060 | 520,506,842 | |
| 2013-11-05 |
|
4 | HCA |
HCA Holdings, Inc.
Common Stock, par value $0.01 per share |
S - Sale | -5,546,165 | 13,063,574 | -29.80 | 46.92 | -260,226,062 | 612,942,901 | |
| 2013-11-05 |
|
4 | HCA |
HCA Holdings, Inc.
Common Stock, par value $0.01 per share |
S - Sale | -2,123,171 | 11,955,553 | -15.08 | 46.92 | -99,619,183 | 560,954,551 | |
| 2013-11-05 |
|
4 | HCA |
HCA Holdings, Inc.
Common Stock, par value $0.01 per share |
S - Sale | -5,977,149 | 14,078,724 | -29.80 | 46.92 | -280,447,831 | 660,573,735 | |
| 2013-10-31 |
|
4 | AMED |
AMEDISYS INC
Common Stock |
P - Purchase | 29,615 | 3,464,615 | 0.86 | 15.94 | 472,010 | 55,219,727 | |
| 2013-10-28 | 3 | NONE |
Sentio Healthcare Properties Inc
3% Senior Cumulative Preferred Stock, Series C |
1,000 | ||||||||
| 2013-10-23 |
|
4 | AMED |
AMEDISYS INC
Common Stock |
P - Purchase | 79,626 | 3,435,000 | 2.37 | 17.75 | 1,413,274 | 60,967,472 | |
| 2013-10-23 |
|
4 | AMED |
AMEDISYS INC
Common Stock |
P - Purchase | 106,387 | 3,355,374 | 3.27 | 17.40 | 1,851,208 | 58,385,856 | |
| 2013-10-21 |
|
4 | AMED |
AMEDISYS INC
Common Stock |
P - Purchase | 2,700 | 3,248,987 | 0.08 | 17.91 | 48,351 | 58,181,560 | |
| 2013-10-21 |
|
4 | AMED |
AMEDISYS INC
Common Stock |
P - Purchase | 9,952 | 3,246,287 | 0.31 | 17.96 | 178,702 | 58,291,628 | |
| 2013-10-21 | 3 | AMED |
AMEDISYS INC
Common Stock |
3,236,335 | ||||||||
| 2013-09-26 |
|
4 | RNET |
RigNet, Inc.
Warrants to purchase Common Stock |
X - Other | -6,712 | 0 | -100.00 | ||||
| 2013-09-26 |
|
4 | RNET |
RigNet, Inc.
Warrants to purchase Common Stock |
X - Other | -446,999 | 0 | -100.00 | ||||
| 2013-09-26 |
|
4 | RNET |
RigNet, Inc.
Warrants to purchase Common Stock |
X - Other | -246,598 | 0 | -100.00 | ||||
| 2013-09-26 |
|
4 | RNET |
RigNet, Inc.
Common Stock |
X - Other | 6,712 | 4,750,000 | 0.14 | 7.00 | 46,984 | 33,250,000 | |
| 2013-09-26 |
|
4 | RNET |
RigNet, Inc.
Common Stock |
X - Other | 446,999 | 4,743,288 | 10.40 | 7.00 | 3,128,993 | 33,203,016 | |
| 2013-09-26 |
|
4 | RNET |
RigNet, Inc.
Common Stock |
X - Other | 246,598 | 4,296,289 | 6.09 | 0.04 | 9,864 | 171,852 | |
| 2013-09-23 | 3 | RNET |
RigNet, Inc.
Common Stock |
4,049,691 | ||||||||
| 2013-05-21 |
|
4 | NLSN |
Nielsen Holdings N.V.
Common Stock |
S - Sale | -6,934,508 | 26,077,581 | -21.01 | 34.48 | -239,135,815 | 899,282,773 | |
| 2013-05-21 |
|
4 | NLSN |
Nielsen Holdings N.V.
Common Stock |
S - Sale | -1,379,153 | 5,186,379 | -21.01 | 34.48 | -47,559,953 | 178,851,761 | |
| 2013-04-05 |
|
4 | DG |
DOLLAR GENERAL CORP
Common Stock, par value $0.875 per share |
S - Sale | -251,669 | 210,339 | -54.47 | 50.14 | -12,618,684 | 10,546,397 | |
| 2013-04-05 |
|
4 | DG |
DOLLAR GENERAL CORP
Common Stock, par value $0.875 per share |
S - Sale | -1,609,088 | 1,344,837 | -54.47 | 50.14 | -80,679,672 | 67,430,127 | |
| 2013-04-05 |
|
4 | DG |
DOLLAR GENERAL CORP
Common Stock, par value $0.875 per share |
S - Sale | -376,187 | 314,407 | -54.47 | 50.14 | -18,862,016 | 15,764,367 | |
| 2013-04-05 |
|
4 | DG |
DOLLAR GENERAL CORP
Common Stock, par value $0.875 per share |
S - Sale | -2,286,982 | 1,911,404 | -54.47 | 50.14 | -114,669,277 | 95,837,797 | |
| 2013-04-05 |
|
4 | DG |
DOLLAR GENERAL CORP
Common Stock, par value $0.875 per share |
S - Sale | -10,837,228 | 9,057,495 | -54.47 | 50.14 | -543,378,612 | 454,142,799 | |
| 2013-03-20 |
|
4 | ZZ |
SEALY CORP
8% Senior Secured Third Lien Convertible Note due 2016 |
J - Other | -4,939,889 | 0 | -100.00 | ||||
| 2013-03-20 |
|
4 | ZZ |
SEALY CORP
Common Stock, par value $0.01 per share |
S - Sale | -46,625,921 | 0 | -100.00 | 2.20 | -102,577,026 | ||
| 2013-03-12 |
|
4 | JAZZ |
Jazz Pharmaceuticals plc
Common Stock |
S - Sale | -15,865 | 7,888 | -66.79 | 58.28 | -924,612 | 459,713 | |
| 2013-03-12 |
|
4 | JAZZ |
Jazz Pharmaceuticals plc
Common Stock |
S - Sale | -3,734,135 | 3,185,058 | -53.97 | 58.28 | -217,625,388 | 185,625,180 | |
| 2013-02-25 |
|
4 | NLSN |
Nielsen Holdings N.V.
Common Stock |
S - Sale | -7,031,829 | 33,012,088 | -17.56 | 31.57 | -222,019,453 | 1,042,307,160 | |
| 2013-02-25 |
|
4 | NLSN |
Nielsen Holdings N.V.
Common Stock |
S - Sale | -1,398,509 | 6,565,532 | -17.56 | 31.57 | -44,155,824 | 207,296,825 | |
| 2013-02-20 |
|
4 | HCA |
HCA Holdings, Inc.
Common Stock, par value $0.01 per share |
S - Sale | -972,920 | 2,050,195 | -32.18 | 35.87 | -34,898,640 | 73,540,509 | |
| 2013-02-20 |
|
4 | HCA |
HCA Holdings, Inc.
Common Stock, par value $0.01 per share |
S - Sale | -200,368 | 422,227 | -32.18 | 35.87 | -7,187,200 | 15,145,297 | |
| 2013-02-20 |
|
4 | HCA |
HCA Holdings, Inc.
Common Stock, par value $0.01 per share |
S - Sale | -326,400 | 687,809 | -32.18 | 35.87 | -11,707,968 | 24,671,694 | |
| 2013-02-20 |
|
4 | HCA |
HCA Holdings, Inc.
Common Stock, par value $0.01 per share |
S - Sale | -4,036,298 | 8,505,527 | -32.18 | 35.87 | -144,782,009 | 305,093,250 | |
| 2013-02-20 |
|
4 | HCA |
HCA Holdings, Inc.
Common Stock, par value $0.01 per share |
S - Sale | -8,831,251 | 18,609,739 | -32.18 | 35.87 | -316,776,973 | 667,531,345 | |
| 2013-02-20 |
|
4 | HCA |
HCA Holdings, Inc.
Common Stock, par value $0.01 per share |
S - Sale | -9,517,514 | 20,055,873 | -32.18 | 35.87 | -341,393,227 | 719,404,168 | |
| 2012-12-18 |
|
4 | HCA |
HCA Holdings, Inc.
Common Stock, par value $0.01 per share |
S - Sale | -622,669 | 3,023,115 | -17.08 | 33.00 | -20,548,077 | 99,762,808 | |
| 2012-12-18 |
|
4 | HCA |
HCA Holdings, Inc.
Common Stock, par value $0.01 per share |
S - Sale | -128,236 | 622,595 | -17.08 | 33.00 | -4,231,788 | 20,545,648 | |
| 2012-12-18 |
|
4 | HCA |
HCA Holdings, Inc.
Common Stock, par value $0.01 per share |
S - Sale | -208,896 | 1,014,209 | -17.08 | 33.00 | -6,893,568 | 33,468,884 | |
| 2012-12-18 |
|
4 | HCA |
HCA Holdings, Inc.
Common Stock, par value $0.01 per share |
S - Sale | -2,583,231 | 12,541,825 | -17.08 | 33.00 | -85,246,623 | 413,880,222 | |
| 2012-12-18 |
|
4 | HCA |
HCA Holdings, Inc.
Common Stock, par value $0.01 per share |
S - Sale | -5,652,001 | 27,440,990 | -17.08 | 33.00 | -186,516,033 | 905,552,677 | |
| 2012-12-18 |
|
4 | HCA |
HCA Holdings, Inc.
Common Stock, par value $0.01 per share |
S - Sale | -6,091,208 | 29,573,387 | -17.08 | 33.00 | -201,009,864 | 975,921,774 | |
| 2012-12-13 |
|
4 | AVGO |
Avago Technologies LTD
Ordinary Shares, no par value |
S - Sale | -390,665 | 0 | -100.00 | 34.43 | -13,450,596 | ||
| 2012-12-13 |
|
4 | AVGO |
Avago Technologies LTD
Ordinary Shares, no par value |
S - Sale | -1,506,428 | 0 | -100.00 | 34.43 | -51,866,316 | ||
| 2012-12-13 |
|
4 | AVGO |
Avago Technologies LTD
Ordinary Shares, no par value |
S - Sale | -2,950,886 | 0 | -100.00 | 34.43 | -101,599,005 | ||
| 2012-12-13 |
|
4 | AVGO |
Avago Technologies LTD
Ordinary Shares, no par value |
S - Sale | -4,339,604 | 0 | -100.00 | 34.43 | -149,412,566 | ||
| 2012-12-13 |
|
4 | AVGO |
Avago Technologies LTD
Ordinary Shares, no par value |
S - Sale | -2,209,597 | 0 | -100.00 | 34.43 | -76,076,425 | ||
| 2012-12-03 |
|
4 | DG |
DOLLAR GENERAL CORP
Common Stock, par value $0.875 per share |
S - Sale | X | -55,890 | 462,008 | -10.79 | 50.07 | -2,798,412 | 23,132,741 |
| 2012-12-03 |
|
4 | DG |
DOLLAR GENERAL CORP
Common Stock, par value $0.875 per share |
S - Sale | X | -357,341 | 2,953,925 | -10.79 | 50.07 | -17,892,064 | 147,903,025 |
| 2012-12-03 |
|
4 | DG |
DOLLAR GENERAL CORP
Common Stock, par value $0.875 per share |
S - Sale | X | -83,542 | 690,594 | -10.79 | 50.07 | -4,182,948 | 34,578,042 |
| 2012-12-03 |
|
4 | DG |
DOLLAR GENERAL CORP
Common Stock, par value $0.875 per share |
S - Sale | X | -507,885 | 4,198,386 | -10.79 | 50.07 | -25,429,802 | 210,213,187 |
| 2012-12-03 |
|
4 | DG |
DOLLAR GENERAL CORP
Common Stock, par value $0.875 per share |
S - Sale | X | -2,406,693 | 19,894,723 | -10.79 | 50.07 | -120,503,119 | 996,128,781 |
| 2012-12-03 |
|
4 | DG |
DOLLAR GENERAL CORP
Common Stock, par value $0.875 per share |
S - Sale | X | -24,323 | 517,898 | -4.49 | 49.98 | -1,215,664 | 25,884,542 |
| 2012-12-03 |
|
4 | DG |
DOLLAR GENERAL CORP
Common Stock, par value $0.875 per share |
S - Sale | X | -155,513 | 3,311,266 | -4.49 | 49.98 | -7,772,540 | 165,497,075 |
| 2012-12-03 |
|
4 | DG |
DOLLAR GENERAL CORP
Common Stock, par value $0.875 per share |
S - Sale | X | -36,357 | 774,136 | -4.49 | 49.98 | -1,817,123 | 38,691,317 |
| 2012-12-03 |
|
4 | DG |
DOLLAR GENERAL CORP
Common Stock, par value $0.875 per share |
S - Sale | X | -221,029 | 4,706,271 | -4.49 | 49.98 | -11,047,029 | 235,219,425 |
| 2012-12-03 |
|
4 | DG |
DOLLAR GENERAL CORP
Common Stock, par value $0.875 per share |
S - Sale | X | -1,047,382 | 22,301,416 | -4.49 | 49.98 | -52,348,152 | 1,114,624,772 |
| 2012-11-29 |
|
4 | DG |
DOLLAR GENERAL CORP
Common Stock, par value $0.875 per share |
S - Sale | X | -9,962 | 542,221 | -1.80 | 49.60 | -494,115 | 26,894,162 |
| 2012-11-29 |
|
4 | DG |
DOLLAR GENERAL CORP
Common Stock, par value $0.875 per share |
S - Sale | X | -63,692 | 3,446,779 | -1.81 | 49.60 | -3,159,123 | 170,960,238 |
| 2012-11-29 |
|
4 | DG |
DOLLAR GENERAL CORP
Common Stock, par value $0.875 per share |
S - Sale | X | -14,891 | 810,493 | -1.80 | 49.60 | -738,594 | 40,200,453 |
| 2012-11-29 |
|
4 | DG |
DOLLAR GENERAL CORP
Common Stock, par value $0.875 per share |
S - Sale | X | -90,525 | 4,927,300 | -1.80 | 49.60 | -4,490,040 | 244,394,080 |
| 2012-11-29 |
|
4 | DG |
DOLLAR GENERAL CORP
Common Stock, par value $0.875 per share |
S - Sale | X | -428,969 | 23,348,798 | -1.80 | 49.60 | -21,276,862 | 1,158,100,381 |
| 2012-11-29 |
|
4 | DG |
DOLLAR GENERAL CORP
Common Stock, par value $0.875 per share |
S - Sale | X | -1,908 | 552,183 | -0.34 | 50.30 | -95,972 | 27,774,805 |
| 2012-11-29 |
|
4 | DG |
DOLLAR GENERAL CORP
Common Stock, par value $0.875 per share |
S - Sale | X | -11,753 | 554,091 | -2.08 | 49.73 | -584,477 | 27,554,945 |
| 2012-11-29 |
|
4 | DG |
DOLLAR GENERAL CORP
Common Stock, par value $0.875 per share |
S - Sale | X | -12,200 | 3,530,471 | -0.34 | 50.30 | -613,660 | 177,582,691 |
| 2012-11-29 |
|
4 | DG |
DOLLAR GENERAL CORP
Common Stock, par value $0.875 per share |
S - Sale | X | -75,144 | 3,542,671 | -2.08 | 49.73 | -3,736,911 | 176,177,029 |
| 2012-11-29 |
|
4 | DG |
DOLLAR GENERAL CORP
Common Stock, par value $0.875 per share |
S - Sale | X | -2,852 | 825,384 | -0.34 | 50.30 | -143,456 | 41,516,815 |
| 2012-11-29 |
|
4 | DG |
DOLLAR GENERAL CORP
Common Stock, par value $0.875 per share |
S - Sale | X | -17,568 | 828,236 | -2.08 | 49.73 | -873,657 | 41,188,176 |
| 2012-11-29 |
|
4 | DG |
DOLLAR GENERAL CORP
Common Stock, par value $0.875 per share |
S - Sale | X | -17,340 | 5,017,825 | -0.34 | 50.30 | -872,202 | 252,396,598 |
| 2012-11-29 |
|
4 | DG |
DOLLAR GENERAL CORP
Common Stock, par value $0.875 per share |
S - Sale | X | -106,801 | 5,035,165 | -2.08 | 49.73 | -5,311,214 | 250,398,755 |
| 2012-11-29 |
|
4 | DG |
DOLLAR GENERAL CORP
Common Stock, par value $0.875 per share |
S - Sale | X | -82,170 | 23,777,767 | -0.34 | 50.30 | -4,133,151 | 1,196,021,680 |
| 2012-11-29 |
|
4 | DG |
DOLLAR GENERAL CORP
Common Stock, par value $0.875 per share |
S - Sale | X | -506,092 | 23,859,937 | -2.08 | 49.73 | -25,167,955 | 1,186,554,667 |
| 2012-11-21 |
|
4 | ROC |
Rockwood Holdings, Inc.
Common Stock, par value $0.01 per share |
S - Sale | -149,806 | 0 | -100.00 | 42.67 | -6,392,222 | ||
| 2012-11-21 |
|
4 | ROC |
Rockwood Holdings, Inc.
Common Stock, par value $0.01 per share |
S - Sale | -5,011,109 | 0 | -100.00 | 42.67 | -213,824,021 | ||
| 2012-11-21 |
|
4 | ROC |
Rockwood Holdings, Inc.
Common Stock, par value $0.01 per share |
S - Sale | -1,739,923 | 0 | -100.00 | 42.67 | -74,242,514 | ||
| 2012-11-16 |
|
4 | ROC |
Rockwood Holdings, Inc.
Warrants to purchase Common Stock |
X - Other | -973,170 | 0 | -100.00 | ||||
| 2012-11-16 |
|
4 | ROC |
Rockwood Holdings, Inc.
Common Stock, par value $0.01 per share |
J - Other | -305,351 | 1,739,923 | -14.93 | 45.85 | -14,000,954 | 79,778,949 | |
| 2012-11-16 |
|
4 | ROC |
Rockwood Holdings, Inc.
Common Stock, par value $0.01 per share |
X - Other | 973,170 | 2,045,274 | 90.77 | 14.39 | 14,000,997 | 29,425,357 | |
| 2012-11-07 |
|
4 | KKR |
KKR & Co. L.P.
KKR Holdings L.P. Units |
C - Conversion | -3,000,000 | 0 | -100.00 | ||||
| 2012-11-07 |
|
4 | KKR |
KKR & Co. L.P.
Common Units |
G - Gift | -1,500,000 | 1,500,000 | -50.00 | ||||
| 2012-11-07 |
|
4 | KKR |
KKR & Co. L.P.
Common Units |
C - Conversion | 3,000,000 | 3,000,000 | |||||
| 2012-11-07 |
|
4 | KKR |
KKR & Co. L.P.
KKR Holdings L.P. Units |
G - Gift | 3,000,000 | 3,000,000 | |||||
| 2012-11-07 |
|
4 | KKR |
KKR & Co. L.P.
KKR Holdings L.P. Units |
G - Gift | -3,000,000 | 80,814,740 | -3.58 | ||||
| 2012-11-07 |
|
4 | KKR |
KKR & Co. L.P.
Common units |
J - Other | -3,639,010 | 4,667,166 | -43.81 | ||||
| 2012-11-02 |
|
4 | NONE |
KKR Alternative Corporate Opportunities Fund
Common Stock |
P - Purchase | 2,500,000 | 2,510,000 | 25,000.00 | 10.00 | 25,000,000 | 25,100,000 | |
| 2012-10-22 | 3 | NONE |
KKR Alternative Corporate Opportunities Fund P
Common Stock |
10,000 | ||||||||
| 2012-10-22 | 3 | NONE |
KKR Alternative Corporate Opportunities Fund
Common Stock |
10,000 | ||||||||
| 2012-10-12 |
|
4 | DG |
DOLLAR GENERAL CORP
Common Stock, par value $0.875 per share |
J - Other | -42,062 | 565,844 | -6.92 | 50.72 | -2,133,174 | 28,696,778 | |
| 2012-10-12 |
|
4 | DG |
DOLLAR GENERAL CORP
Common Stock, par value $0.875 per share |
J - Other | -268,933 | 3,617,815 | -6.92 | 50.72 | -13,638,937 | 183,477,488 | |
| 2012-10-12 |
|
4 | DG |
DOLLAR GENERAL CORP
Common Stock, par value $0.875 per share |
J - Other | -62,874 | 845,804 | -6.92 | 50.72 | -3,188,655 | 42,894,950 | |
| 2012-10-12 |
|
4 | DG |
DOLLAR GENERAL CORP
Common Stock, par value $0.875 per share |
J - Other | -382,232 | 5,141,966 | -6.92 | 50.72 | -19,384,896 | 260,774,806 | |
| 2012-10-12 |
|
4 | DG |
DOLLAR GENERAL CORP
Common Stock, par value $0.875 per share |
J - Other | -1,811,269 | 24,366,029 | -6.92 | 50.72 | -91,858,507 | 1,235,723,161 | |
| 2012-10-12 |
|
4 | DG |
DOLLAR GENERAL CORP
Common Stock, par value $0.875 per share |
S - Sale | -46,156 | 607,906 | -7.06 | 50.72 | -2,340,802 | 30,829,953 | |
| 2012-10-12 |
|
4 | DG |
DOLLAR GENERAL CORP
Common Stock, par value $0.875 per share |
S - Sale | -295,105 | 3,886,748 | -7.06 | 50.72 | -14,966,250 | 197,116,425 | |
| 2012-10-12 |
|
4 | DG |
DOLLAR GENERAL CORP
Common Stock, par value $0.875 per share |
S - Sale | -68,992 | 908,678 | -7.06 | 50.72 | -3,498,929 | 46,083,605 | |
| 2012-10-12 |
|
4 | DG |
DOLLAR GENERAL CORP
Common Stock, par value $0.875 per share |
S - Sale | -419,430 | 5,524,198 | -7.06 | 50.72 | -21,271,392 | 280,159,702 | |
| 2012-10-12 |
|
4 | DG |
DOLLAR GENERAL CORP
Common Stock, par value $0.875 per share |
S - Sale | -1,987,537 | 26,177,298 | -7.06 | 50.72 | -100,797,939 | 1,327,581,668 | |
| 2012-10-05 |
|
4 | DG |
DOLLAR GENERAL CORP
Common Stock, par value $0.875 per share |
S - Sale | -303,683 | 654,062 | -31.71 | 50.72 | -15,401,283 | 33,170,754 | |
| 2012-10-05 |
|
4 | DG |
DOLLAR GENERAL CORP
Common Stock, par value $0.875 per share |
S - Sale | -1,941,651 | 4,181,853 | -31.71 | 50.72 | -98,470,830 | 212,082,675 | |
| 2012-10-05 |
|
4 | DG |
DOLLAR GENERAL CORP
Common Stock, par value $0.875 per share |
S - Sale | -453,936 | 977,670 | -31.71 | 50.72 | -23,021,364 | 49,582,534 | |
| 2012-10-05 |
|
4 | DG |
DOLLAR GENERAL CORP
Common Stock, par value $0.875 per share |
S - Sale | -2,759,650 | 5,943,628 | -31.71 | 50.72 | -139,955,650 | 301,431,094 | |
| 2012-10-05 |
|
4 | DG |
DOLLAR GENERAL CORP
Common Stock, par value $0.875 per share |
S - Sale | -13,077,044 | 28,164,835 | -31.71 | 50.72 | -663,202,286 | 1,428,379,607 | |
| 2012-08-17 |
|
4 | KKR |
KKR & Co. L.P.
KKR Holdings L.P. Units |
G - Gift | -172,500 | 1,500,000 | -10.31 | ||||
| 2012-06-13 |
|
4 | DG |
DOLLAR GENERAL CORP
Common Stock, par value $0.875 per share |
S - Sale | -290,569 | 957,745 | -23.28 | 45.23 | -13,142,639 | 43,319,477 | |
| 2012-06-13 |
|
4 | DG |
DOLLAR GENERAL CORP
Common Stock, par value $0.875 per share |
S - Sale | -1,857,793 | 6,123,504 | -23.28 | 45.23 | -84,029,278 | 276,970,372 | |
| 2012-06-13 |
|
4 | DG |
DOLLAR GENERAL CORP
Common Stock, par value $0.875 per share |
S - Sale | -434,331 | 1,431,606 | -23.28 | 45.23 | -19,645,095 | 64,752,542 | |
| 2012-06-13 |
|
4 | DG |
DOLLAR GENERAL CORP
Common Stock, par value $0.875 per share |
S - Sale | -2,640,464 | 8,703,278 | -23.28 | 45.23 | -119,430,035 | 393,655,356 | |
| 2012-06-13 |
|
4 | DG |
DOLLAR GENERAL CORP
Common Stock, par value $0.875 per share |
S - Sale | -12,512,266 | 41,241,879 | -23.28 | 45.23 | -565,938,550 | 1,865,399,056 | |
| 2012-04-04 |
|
4 | DG |
DOLLAR GENERAL CORP
Common Stock, par value $0.875 per share |
J - Other | -58,207 | 1,248,314 | -4.46 | 44.01 | -2,561,434 | 54,932,807 | |
| 2012-04-04 |
|
4 | DG |
DOLLAR GENERAL CORP
Common Stock, par value $0.875 per share |
S - Sale | -240,356 | 1,306,521 | -15.54 | 44.01 | -10,577,010 | 57,494,241 | |
| 2012-04-04 |
|
4 | DG |
DOLLAR GENERAL CORP
Common Stock, par value $0.875 per share |
J - Other | -372,157 | 7,981,297 | -4.46 | 44.01 | -16,376,992 | 351,221,763 | |
| 2012-04-04 |
|
4 | DG |
DOLLAR GENERAL CORP
Common Stock, par value $0.875 per share |
S - Sale | -1,536,752 | 8,353,454 | -15.54 | 44.01 | -67,625,694 | 367,598,755 | |
| 2012-04-04 |
|
4 | DG |
DOLLAR GENERAL CORP
Common Stock, par value $0.875 per share |
J - Other | -87,006 | 1,865,937 | -4.46 | 44.01 | -3,828,751 | 82,111,677 | |
| 2012-04-04 |
|
4 | DG |
DOLLAR GENERAL CORP
Common Stock, par value $0.875 per share |
S - Sale | -359,275 | 1,952,943 | -15.54 | 44.01 | -15,810,112 | 85,940,428 | |
| 2012-04-04 |
|
4 | DG |
DOLLAR GENERAL CORP
Common Stock, par value $0.875 per share |
J - Other | -528,942 | 11,343,742 | -4.46 | 44.01 | -23,276,410 | 499,188,173 | |
| 2012-04-04 |
|
4 | DG |
DOLLAR GENERAL CORP
Common Stock, par value $0.875 per share |
S - Sale | -2,184,171 | 11,872,684 | -15.54 | 44.01 | -96,115,755 | 522,464,583 | |
| 2012-04-04 |
|
4 | DG |
DOLLAR GENERAL CORP
Common Stock, par value $0.875 per share |
J - Other | -2,506,475 | 53,754,145 | -4.46 | 44.01 | -110,298,936 | 2,365,483,403 | |
| 2012-04-04 |
|
4 | DG |
DOLLAR GENERAL CORP
Common Stock, par value $0.875 per share |
S - Sale | -10,350,049 | 56,260,620 | -15.54 | 44.01 | -455,460,116 | 2,475,782,339 | |
| 2012-03-28 |
|
4 | NLSN |
Nielsen Holdings N.V.
Common Stock |
S - Sale | -6,615,207 | 40,043,916 | -14.18 | 29.12 | -192,605,721 | 1,165,902,641 | |
| 2012-03-28 |
|
4 | NLSN |
Nielsen Holdings N.V.
Common Stock |
S - Sale | -1,315,650 | 7,964,041 | -14.18 | 29.12 | -38,305,939 | 231,877,832 | |
| 2012-03-13 |
|
4 | JAZZ |
Jazz Pharmaceuticals plc
Common Stock |
S - Sale | -12,692 | 23,753 | -34.83 | 49.56 | -629,016 | 1,177,199 | |
| 2012-03-13 |
|
4 | JAZZ |
Jazz Pharmaceuticals plc
Common Stock |
S - Sale | -2,987,308 | 6,919,193 | -30.16 | 49.56 | -148,050,984 | 342,915,205 | |
| 2012-02-14 |
|
5 | ROC |
Rockwood Holdings, Inc.
Common Stock, par value $0.01 per share |
G - Gift | -309,055 | 825,129 | -27.25 | ||||
| 2012-02-14 |
|
5 | ROC |
Rockwood Holdings, Inc.
Common Stock, par value $0.01 per share |
G - Gift | -440,816 | 1,134,184 | -27.99 | ||||
| 2012-01-18 |
|
4 | JAZZ |
Jazz Pharmaceuticals plc
Common Stock Warrant (right to buy) |
U - Other | -597,837 | 0 | -100.00 | ||||
| 2012-01-18 |
|
4 | JAZZ |
Jazz Pharmaceuticals plc
Common Stock |
U - Other | -36,445 | 0 | -100.00 | ||||
| 2012-01-18 |
|
4 | JAZZ |
Jazz Pharmaceuticals plc
Common Stock |
U - Other | -9,906,501 | 0 | -100.00 | ||||
| 2012-01-18 | 3 | JAZZ |
Jazz Pharmaceuticals plc
Common Stock |
9,906,501 | ||||||||
| 2012-01-18 | 3 | JAZZ |
Jazz Pharmaceuticals plc
Common Stock |
36,445 | ||||||||
| 2011-01-25 | 3 | NLSN |
Nielsen Holdings N.V.
Common Stock |
9,279,691 | ||||||||
| 2011-01-25 | 3 | NLSN |
Nielsen Holdings N.V.
Common Stock |
46,659,123 | ||||||||
| 2011-01-25 | 3 | NLSN |
Nielsen Holdings N.V.
Common Stock |
174 | ||||||||
| 2010-07-14 | 3 | KKR |
KKR & Co. L.P.
Common Units |
4,667,166 | ||||||||
| 2010-07-14 | 3 | KKR |
KKR & Co. L.P.
Common Units |
208,634 | ||||||||
| 2010-04-22 |
|
4 | DG |
DOLLAR GENERAL CORP
Common Stock, par value $0.875 per share |
S - Sale | -253,320 | 2,305,671 | -9.90 | 25.92 | -6,566,054 | 59,762,992 | |
| 2010-04-22 |
|
4 | DG |
DOLLAR GENERAL CORP
Common Stock, par value $0.875 per share |
S - Sale | -1,619,639 | 14,741,679 | -9.90 | 25.92 | -41,981,043 | 382,104,320 | |
| 2010-04-22 |
|
4 | DG |
DOLLAR GENERAL CORP
Common Stock, par value $0.875 per share |
S - Sale | -378,653 | 3,446,437 | -9.90 | 25.92 | -9,814,686 | 89,331,647 | |
| 2010-04-22 |
|
4 | DG |
DOLLAR GENERAL CORP
Common Stock, par value $0.875 per share |
S - Sale | -2,301,978 | 20,952,208 | -9.90 | 25.92 | -59,667,270 | 543,081,231 | |
| 2010-04-22 |
|
4 | DG |
DOLLAR GENERAL CORP
Common Stock, par value $0.875 per share |
S - Sale | -10,908,293 | 99,285,406 | -9.90 | 25.92 | -282,742,955 | 2,573,477,724 | |
| 2009-11-12 | 3 | DG |
DOLLAR GENERAL CORP
Common Stock, par value $0.875 per share |
116,265,659 | ||||||||
| 2009-11-12 | 3 | DG |
DOLLAR GENERAL CORP
Common Stock, par value $0.875 per share |
24,535,553 | ||||||||
| 2009-11-12 | 3 | DG |
DOLLAR GENERAL CORP
Common Stock, par value $0.875 per share |
4,035,862 | ||||||||
| 2009-11-12 | 3 | DG |
DOLLAR GENERAL CORP
Common Stock, par value $0.875 per share |
17,262,869 | ||||||||
| 2009-11-12 | 3 | DG |
DOLLAR GENERAL CORP
Common Stock, par value $0.875 per share |
2,699,999 | ||||||||
| 2009-07-16 |
|
4 | ZZ |
SEALY CORP
8% Senior Secured Third Lien Convertible Notes due 2016 |
P - Purchase | 3,753,910 | 3,753,910 | 25.00 | 93,847,750 | 93,847,750 | ||
| 2008-04-29 | 3 | HCA INC. |
HCA INC/TN
Common stock, par value $0.01 per share |
9,313,725 | ||||||||
| 2008-04-29 | 3 | HCA INC. |
HCA INC/TN
Common stock, par value $0.01 per share |
8,642,157 | ||||||||
| 2008-04-29 | 3 | HCA INC. |
HCA INC/TN
Common stock, par value $0.01 per share |
4,901,961 | ||||||||
| 2008-04-29 | 3 | HCA INC. |
HCA INC/TN
Common stock, par value $0.01 per share |
319,411 | ||||||||
| 2008-04-29 | 3 | HCA INC. |
HCA INC/TN
Common stock, par value $0.01 per share |
196,078 | ||||||||
| 2006-11-29 |
|
4 | AIQ |
ALLIANCE IMAGING INC /DE/
Common Stock |
S - Sale | -1,200,000 | 25,944,570 | -4.42 | 5.40 | -6,486,000 | 140,230,401 | |
| 2006-11-29 |
|
4 | AIQ |
ALLIANCE IMAGING INC /DE/
Common Stock |
S - Sale | -8,000,000 | 27,144,570 | -22.76 | 5.40 | -43,240,000 | 146,716,401 | |
| 2006-08-16 |
|
4 | NRG |
NRG ENERGY, INC.
Common Stock, par value $0.01 per share |
S - Sale | -215,786 | 215,786 | -50.00 | 48.41 | -10,446,200 | 10,446,200 | |
| 2006-08-16 |
|
4 | NRG |
NRG ENERGY, INC.
Common Stock, par value $0.01 per share |
S - Sale | -4,099,941 | 4,099,941 | -50.00 | 48.41 | -198,478,144 | 198,478,144 | |
| 2006-08-11 | 3 | NRG |
NRG ENERGY, INC.
Common stock, par value $0.01 per share |
8,199,882 | ||||||||
| 2006-08-11 | 3 | NRG |
NRG ENERGY, INC.
Common stock, par value $0.01 per share |
431,572 | ||||||||
| 2006-04-13 |
|
4 | ZZ |
SEALY CORP
Common stock, par value $0.01 per share |
S - Sale | -3,481,868 | 46,625,921 | -6.95 | 16.00 | -55,709,888 | 746,014,736 | |
| 2006-04-10 |
|
4 | ZZ |
SEALY CORP
Common Stock, par value $0.01 per share |
P - Purchase | 146,000 | 146,000 | 16.00 | 2,336,000 | 2,336,000 | ||
| 2006-04-10 |
|
4 | ZZ |
SEALY CORP
Common stock, par value $0.01 per share |
S - Sale | -6,632,130 | 50,107,789 | -11.69 | 16.00 | -106,114,080 | 801,724,624 | |
| 2006-04-06 | 3 | ZZ |
SEALY CORP
Common stock, par value $0.01 per share |
56,739,919 | ||||||||
| 2005-10-14 |
|
4 | ACW |
ACCURIDE CORP
Common Stock |
S - Sale | -641,137 | 7,850,213 | -7.55 | 13.25 | -8,495,065 | 104,015,322 | |
| 2005-10-07 |
|
4 | ACW |
ACCURIDE CORP
Common Stock |
S - Sale | -4,274,250 | 8,491,350 | -33.48 | 13.25 | -56,633,812 | 112,510,388 | |
| 2005-08-12 | 3/A | ROC |
Rockwood Holdings, Inc.
Common Stock, par value $0.01 per share |
4,445,896 | ||||||||
| 2005-08-12 | 3/A | ROC |
Rockwood Holdings, Inc.
Common Stock, par value $0.01 per share |
19,138,916 | ||||||||
| 2005-08-12 | 3/A | ROC |
Rockwood Holdings, Inc.
Common Stock, par value $0.01 per share |
164,282 | ||||||||
| 2005-08-12 | 3/A | ROC |
Rockwood Holdings, Inc.
Common Stock, par value $0.01 per share |
398,727 | ||||||||
| 2005-08-12 | 3/A | ROC |
Rockwood Holdings, Inc.
Common Stock, par value $0.01 per share |
13,337,689 | ||||||||
| 2005-08-12 | 3/A | ROC |
Rockwood Holdings, Inc.
Series A Participating Preferred Stock, par value $0.01 p/sh |
25,000 | ||||||||
| 2005-08-12 | 3 | ROC |
Rockwood Holdings, Inc.
Common Stock, par value $0.01 per share |
4,445,896 | ||||||||
| 2005-08-12 | 3 | ROC |
Rockwood Holdings, Inc.
Common Stock, par value $0.01 per share |
19,138,916 | ||||||||
| 2005-08-12 | 3 | ROC |
Rockwood Holdings, Inc.
Common Stock, par value $0.01 per share |
164,282 | ||||||||
| 2005-08-12 | 3 | ROC |
Rockwood Holdings, Inc.
Common Stock, par value $0.01 per share |
398,727 | ||||||||
| 2005-08-12 | 3 | ROC |
Rockwood Holdings, Inc.
Common Stock, par value $0.01 per share |
13,337,689 | ||||||||
| 2005-08-12 | 3 | ROC |
Rockwood Holdings, Inc.
Series A Participating Preferred Stock, par value $0.01 p/sh |
25,000 | ||||||||
| 2005-04-27 |
|
4 | ACW |
ACCURIDE CORP
Common stock |
P - Purchase | 53,000 | 12,818,600 | 0.42 | 9.00 | 477,000 | 115,367,400 | |
| 2005-04-25 | 3 | ACW |
ACCURIDE CORP
Common Stock |
12,765,600 | ||||||||
| 2004-12-06 |
|
4 | OI |
OWENS ILLINOIS INC /DE/
Common Stock |
S - Sale | -202,475 | 28,925 | -87.50 | 22.98 | -4,652,876 | 664,696 | |
| 2004-12-06 |
|
4 | OI |
OWENS ILLINOIS INC /DE/
Common Stock |
S - Sale | -742,525 | 106,075 | -87.50 | 22.98 | -17,063,224 | 2,437,604 | |
| 2004-12-06 |
|
4 | OI |
OWENS ILLINOIS INC /DE/
Common Stock |
S - Sale | -30,555,000 | 4,365,000 | -87.50 | 22.98 | -702,153,900 | 100,307,700 | |
| 2003-11-24 | 3 | ZHNE |
ZHONE TECHNOLOGIES INC
Common Stock |
8,959,375 |
P
Pasaran terbuka atau pembelian persendirian sekuriti bukan derivatif atau derivatif
S
Pasaran terbuka atau jualan persendirian sekuriti bukan derivatif atau derivatif
A
Pemberian, penganugerahan atau pemerolehan lain sekuriti daripada syarikat (seperti opsyen)
C
Penukaran derivatif
D
Penjualan atau pemindahan sekuriti kembali kepada syarikat
F
Pembayaran harga pelaksanaan atau liabiliti cukai menggunakan sebahagian daripada sekuriti yang diterima daripada syarikat
G
Hadiah sekuriti oleh atau kepada orang dalam
K
Swap ekuiti dan urus niaga lindung nilai yang serupa
M
Pelaksanaan atau penukaran sekuriti derivatif yang diterima daripada syarikat (seperti opsyen)
V
Transaksi dilaporkan secara sukarela pada Borang 4
J
Lain-lain (disertai dengan nota kaki yang menerangkan transaksi)