Statistik Asas
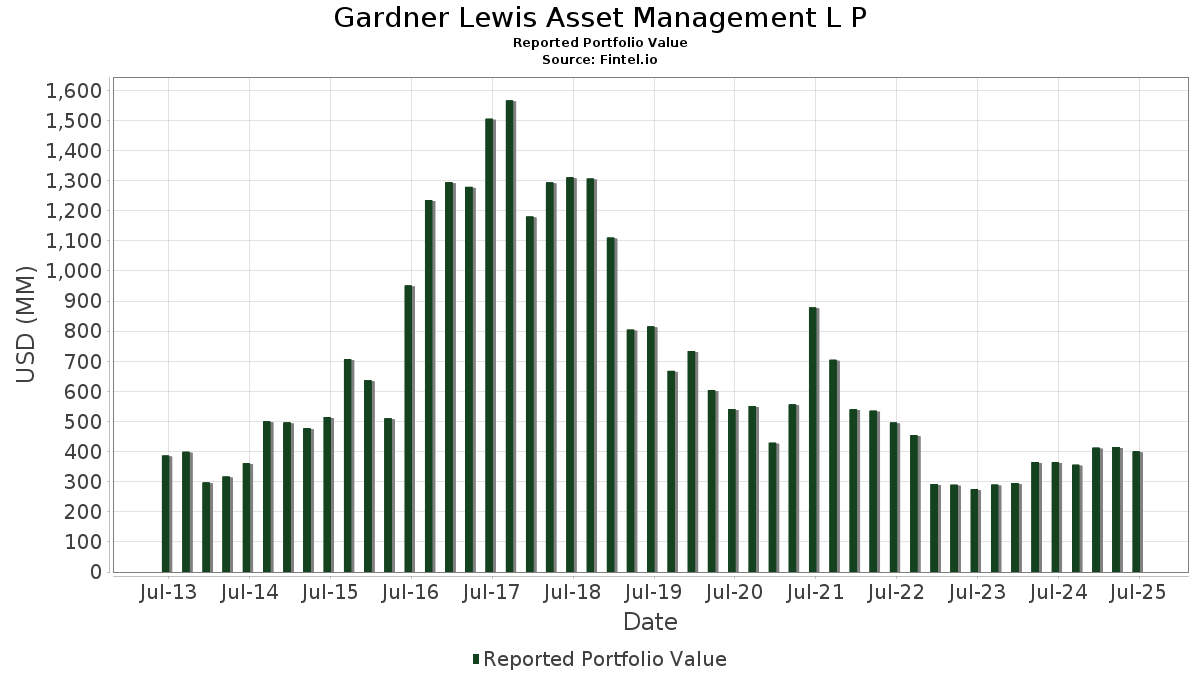
| Nilai Portfolio | $ 400,373,837 |
| Kedudukan Semasa | 76 |
Pegangan Terkini, Prestasi, AUM (dari 13F, 13D)
Gardner Lewis Asset Management L P telah mendedahkan 76 jumlah pegangan dalam pemfailan SEC terkini mereka. Nilai portfolio terkini dikira sebagai $ 400,373,837 USD. Aset Sebenar Di Bawah Pengurusan (AUM) ialah nilai ini ditambah dengan tunai (yang tidak didedahkan). Pegangan teratas Gardner Lewis Asset Management L P ialah NVIDIA Corporation (US:NVDA) , Mastercard Incorporated (US:MA) , The Boeing Company (US:BA) , Microsoft Corporation (US:MSFT) , and Amazon.com, Inc. (US:AMZN) . Kedudukan baharu Gardner Lewis Asset Management L P termasuk Everi Holdings Inc. (US:EVRI) , Redfin Corporation (US:RDFN) , Frontier Communications Parent, Inc. (US:FYBR) , Enstar Group Limited (US:ESGR) , and Servotronics, Inc. (US:SVT) . Industri teratas Gardner Lewis Asset Management L P ialah "Railroad Transportation" (sic 40) , "Electric, Gas, And Sanitary Services " (sic 49) , and "Restaurants, Dining, Eating And Drinking Places" (sic 58) .
Kenaikan Teratas Suku Tahun Ini
Kami menggunakan perubahan dalam peruntukan portfolio kerana ini adalah metrik yang paling bermakna. Perubahan boleh disebabkan oleh perdagangan atau perubahan dalam harga saham.
| Sekuriti | Saham (MM) |
Nilai (MM$) |
Portfolio % | ΔPortfolio % |
|---|---|---|---|---|
| 0.85 | 12.16 | 3.0360 | 3.0360 | |
| 0.25 | 39.42 | 9.8461 | 2.9117 | |
| 1.17 | 10.64 | 2.6583 | 2.6583 | |
| 0.37 | 11.11 | 2.7756 | 2.5944 | |
| 0.87 | 9.76 | 2.4381 | 2.4381 | |
| 0.22 | 8.15 | 2.0351 | 2.0351 | |
| 0.02 | 6.20 | 1.5482 | 1.5482 | |
| 0.36 | 7.00 | 1.7488 | 1.3489 | |
| 0.11 | 5.39 | 1.3472 | 1.3472 | |
| 0.05 | 5.13 | 1.2803 | 1.2803 |
Penurunan Teratas Suku Tahun Ini
Kami menggunakan perubahan dalam peruntukan portfolio kerana ini adalah metrik yang paling bermakna. Perubahan boleh disebabkan oleh perdagangan atau perubahan dalam harga saham.
| Sekuriti | Saham (MM) |
Nilai (MM$) |
Portfolio % | ΔPortfolio % |
|---|---|---|---|---|
| 0.15 | 6.12 | 1.5281 | -1.1458 | |
| 0.04 | 3.93 | 0.9822 | -0.5328 | |
| 0.32 | 7.86 | 1.9642 | -0.3086 | |
| 0.12 | 9.20 | 2.2979 | -0.2310 | |
| 0.01 | 1.70 | 0.4250 | -0.1363 | |
| 0.05 | 11.27 | 2.8148 | -0.1352 | |
| 0.05 | 1.40 | 0.3486 | -0.1049 | |
| 0.01 | 1.53 | 0.3824 | -0.0807 | |
| 0.01 | 0.90 | 0.2248 | -0.0275 | |
| 0.01 | 0.90 | 0.2249 | -0.0252 |
Pemfailan 13D/G
Ini ialah senarai pemfailan 13D dan 13G yang dibuat pada tahun lepas (jika ada). Klik ikon pautan untuk melihat sejarah transaksi penuh. Baris hijau menunjukkan kedudukan baharu. Baris merah menunjukkan kedudukan tertutup.
| Tarikh Fail | Borang | Sekuriti | Saham Terdahulu |
Saham Semasa |
ΔSaham % | % Pemilikan |
% ΔPemilikan | |
|---|---|---|---|---|---|---|---|---|
| 2025-04-23 | EMKR / Emcore Corporation | 585,958 | 0 | -100.00 | 0.00 | -100.00 | ||
| 2025-04-23 | ICCH / ICC Holdings, Inc. | 164,866 | 0 | -100.00 | 0.00 | -100.00 | ||
| 2025-04-22 | MNTX / Manitex International, Inc. | 1,779,816 | 0 | -100.00 | 0.00 | -100.00 | ||
| 2025-04-17 | SCWX / SecureWorks Corp. | 1,276,021 | 0 | -100.00 | 0.00 | -100.00 |
13F dan Pemfailan Dana
Borang ini telah difailkan pada 2025-08-12 untuk tempoh pelaporan 2025-06-30. Klik ikon pautan untuk melihat sejarah transaksi penuh.
Tingkatkan untuk membuka data premium dan eksport ke Excel ![]() .
.
| Sekuriti | Jenis | Purata Harga Saham | Saham (MM) |
ΔSaham (%) |
ΔSaham (%) |
Nilai ($MM) |
Portfolio (%) |
ΔPortfolio (%) |
|
|---|---|---|---|---|---|---|---|---|---|
| NVDA / NVIDIA Corporation | 0.25 | -6.05 | 39.42 | 36.95 | 9.8461 | 2.9117 | |||
| MA / Mastercard Incorporated | 0.03 | -0.54 | 15.60 | 1.97 | 3.8975 | 0.2110 | |||
| BA / The Boeing Company | 0.07 | -0.26 | 14.21 | 22.55 | 3.5503 | 0.7559 | |||
| MSFT / Microsoft Corporation | 0.03 | -3.97 | 13.71 | 27.24 | 3.4251 | 0.8289 | |||
| AMZN / Amazon.com, Inc. | 0.06 | 0.18 | 13.69 | 15.53 | 3.4191 | 0.5645 | |||
| UBS / UBS Group AG | 0.37 | -0.54 | 12.47 | 9.82 | 3.1144 | 0.3791 | |||
| EVRI / Everi Holdings Inc. | 0.85 | 12.16 | 3.0360 | 3.0360 | |||||
| TDG / TransDigm Group Incorporated | 0.01 | -0.66 | 11.50 | 9.21 | 2.8728 | 0.3356 | |||
| AAPL / Apple Inc. | 0.05 | -0.36 | 11.27 | -7.97 | 2.8148 | -0.1352 | |||
| PWOD / Penns Woods Bancorp, Inc. | 0.37 | 1,257.86 | 11.11 | 1,377.66 | 2.7756 | 2.5944 | |||
| AGS / AGS LLC | 0.88 | 13.29 | 11.02 | 16.84 | 2.7518 | 0.4803 | |||
| DNB / Dun & Bradstreet Holdings, Inc. | 1.17 | 10.64 | 2.6583 | 2.6583 | |||||
| META / Meta Platforms, Inc. | 0.01 | -1.47 | 10.20 | 26.17 | 2.5468 | 0.6000 | |||
| C / Citigroup Inc. | 0.12 | -0.51 | 10.06 | 19.30 | 2.5115 | 0.4810 | |||
| RDFN / Redfin Corporation | 0.87 | 9.76 | 2.4381 | 2.4381 | |||||
| GOOG / Alphabet Inc. | 0.05 | 0.00 | 9.42 | 13.55 | 2.3534 | 0.3543 | |||
| K / Kellanova | 0.12 | -9.10 | 9.20 | -12.36 | 2.2979 | -0.2310 | |||
| NFLX / Netflix, Inc. | 0.01 | -2.51 | 8.31 | 39.99 | 2.0751 | 0.6454 | |||
| FYBR / Frontier Communications Parent, Inc. | 0.22 | 8.15 | 2.0351 | 2.0351 | |||||
| CHX / ChampionX Corporation | 0.32 | 0.00 | 7.86 | -16.64 | 1.9642 | -0.3086 | |||
| ESSA / ESSA Bancorp, Inc. | 0.36 | 309.85 | 7.00 | 322.00 | 1.7488 | 1.3489 | |||
| TJX / The TJX Companies, Inc. | 0.05 | 2.76 | 6.63 | 4.19 | 1.6565 | 0.1231 | |||
| BRDG / Bridge Investment Group Holdings Inc. | 0.65 | 19.81 | 6.51 | 25.17 | 1.6259 | 0.3732 | |||
| ESGR / Enstar Group Limited | 0.02 | 6.20 | 1.5482 | 1.5482 | |||||
| JNPR / Juniper Networks, Inc. | 0.15 | -50.04 | 6.12 | -44.88 | 1.5281 | -1.1458 | |||
| SPOT / Spotify Technology S.A. | 0.01 | -9.16 | 5.85 | 26.75 | 1.4604 | 0.3490 | |||
| NOW / ServiceNow, Inc. | 0.01 | -0.44 | 5.84 | 28.58 | 1.4575 | 0.3641 | |||
| SVT / Servotronics, Inc. | 0.11 | 5.39 | 1.3472 | 1.3472 | |||||
| AVGO / Broadcom Inc. | 0.02 | -2.97 | 5.38 | 59.79 | 1.3438 | 0.5325 | |||
| SNPS / Synopsys, Inc. | 0.01 | 4.00 | 5.20 | 24.33 | 1.2995 | 0.2914 | |||
| VMC / Vulcan Materials Company | 0.02 | -0.38 | 5.19 | 11.38 | 1.2960 | 0.1737 | |||
| AMED / Amedisys, Inc. | 0.05 | 5.13 | 1.2803 | 1.2803 | |||||
| ICAD / iCAD, Inc. | 1.33 | 5.07 | 1.2662 | 1.2662 | |||||
| INZY / Inozyme Pharma, Inc. | 1.26 | 5.03 | 1.2566 | 1.2566 | |||||
| XOM / Exxon Mobil Corporation | 0.04 | -31.01 | 3.93 | -37.48 | 0.9822 | -0.5328 | |||
| IT / Gartner, Inc. | 0.01 | -0.51 | 3.92 | -4.20 | 0.9803 | -0.0066 | |||
| LLY / Eli Lilly and Company | 0.00 | 2.99 | 3.89 | -2.80 | 0.9718 | 0.0076 | |||
| TOL / Toll Brothers, Inc. | 0.03 | -12.34 | 3.81 | -5.25 | 0.9514 | -0.0171 | |||
| EBTC / Enterprise Bancorp, Inc. | 0.09 | 31.25 | 3.68 | 33.65 | 0.9187 | 0.2557 | |||
| HEI / HEICO Corporation | 0.01 | -9.96 | 3.17 | 10.55 | 0.7906 | 0.1008 | |||
| SSBK / Southern States Bancshares, Inc. | 0.08 | 234.47 | 2.83 | 240.50 | 0.7077 | 0.5071 | |||
| HUM / Humana Inc. | 0.01 | 50.63 | 2.53 | 39.23 | 0.6313 | 0.1938 | |||
| MLM / Martin Marietta Materials, Inc. | 0.00 | -1.11 | 2.45 | 13.54 | 0.6117 | 0.0921 | |||
| STR / Sitio Royalties Corp. | 0.13 | 2.37 | 0.5922 | 0.5922 | |||||
| NDAQ / Nasdaq, Inc. | 0.02 | 0.00 | 2.15 | 17.91 | 0.5378 | 0.0978 | |||
| RACE / Ferrari N.V. | 0.00 | 12.32 | 2.15 | 28.81 | 0.5362 | 0.1348 | |||
| DECK / Deckers Outdoor Corporation | 0.02 | 1.99 | 0.4966 | 0.4966 | |||||
| DIS / The Walt Disney Company | 0.02 | 0.00 | 1.98 | 25.63 | 0.4946 | 0.1149 | |||
| APH / Amphenol Corporation | 0.02 | -18.35 | 1.98 | 22.89 | 0.4938 | 0.1064 | |||
| TSM / Taiwan Semiconductor Manufacturing Company Limited - Depositary Receipt (Common Stock) | 0.01 | -14.38 | 1.92 | 16.84 | 0.4785 | 0.0834 | |||
| LHX / L3Harris Technologies, Inc. | 0.01 | -17.36 | 1.88 | -0.95 | 0.4689 | 0.0123 | |||
| LULU / lululemon athletica inc. | 0.01 | -12.99 | 1.70 | -26.96 | 0.4250 | -0.1363 | |||
| AZO / AutoZone, Inc. | 0.00 | 111.54 | 1.63 | 105.93 | 0.4080 | 0.2169 | |||
| IBKR / Interactive Brokers Group, Inc. | 0.03 | 211.71 | 1.55 | 4.31 | 0.3870 | 0.0291 | |||
| NXPI / NXP Semiconductors N.V. | 0.01 | -30.72 | 1.53 | -20.40 | 0.3824 | -0.0807 | |||
| CFSB / CFSB Bancorp, Inc. | 0.10 | 1.42 | 0.3547 | 0.3547 | |||||
| BABA / Alibaba Group Holding Limited - Depositary Receipt (Common Stock) | 0.01 | 1.40 | 0.3490 | 0.3490 | |||||
| SRDX / Surmodics, Inc. | 0.05 | -23.81 | 1.40 | -25.88 | 0.3486 | -0.1049 | |||
| ANSS / ANSYS, Inc. | 0.00 | 63.99 | 1.26 | 82.08 | 0.3148 | 0.1479 | |||
| CRM / Salesforce, Inc. | 0.00 | 0.00 | 1.25 | 1.63 | 0.3116 | 0.0158 | |||
| SPR / Spirit AeroSystems Holdings, Inc. | 0.03 | 0.00 | 1.08 | 10.71 | 0.2687 | 0.0346 | |||
| HES / Hess Corporation | 0.01 | 0.00 | 0.90 | -13.29 | 0.2249 | -0.0252 | |||
| FANG / Diamondback Energy, Inc. | 0.01 | 0.00 | 0.90 | -14.14 | 0.2248 | -0.0275 | |||
| COOP / Mr. Cooper Group Inc. | 0.01 | 0.90 | 0.2236 | 0.2236 | |||||
| MNST / Monster Beverage Corporation | 0.01 | 0.00 | 0.89 | 6.97 | 0.2225 | 0.0220 | |||
| ISRG / Intuitive Surgical, Inc. | 0.00 | 82.78 | 0.72 | 100.84 | 0.1786 | 0.0927 | |||
| SHOP / Shopify Inc. | 0.01 | 0.00 | 0.64 | 20.83 | 0.1611 | 0.0325 | |||
| MELI / MercadoLibre, Inc. | 0.00 | 50.00 | 0.64 | 101.25 | 0.1606 | 0.0835 | |||
| CHTR / Charter Communications, Inc. | 0.00 | 0.59 | 0.1472 | 0.1472 | |||||
| PPBI / Pacific Premier Bancorp, Inc. | 0.03 | 0.57 | 0.1435 | 0.1435 | |||||
| BRK.B / Berkshire Hathaway Inc. | 0.00 | 0.57 | 0.1432 | 0.1432 | |||||
| CP / Canadian Pacific Kansas City Limited | 0.01 | 0.57 | 0.1428 | 0.1428 | |||||
| BLKB / Blackbaud, Inc. | 0.01 | 0.00 | 0.45 | 3.46 | 0.1123 | 0.0076 | |||
| DE / Deere & Company | 0.00 | 0.39 | 0.0984 | 0.0984 | |||||
| CAT / Caterpillar Inc. | 0.00 | 0.29 | 0.0729 | 0.0729 | |||||
| MCO / Moody's Corporation | 0.00 | 0.20 | 0.0507 | 0.0507 | |||||
| NVRO / Nevro Corp. | 0.00 | -100.00 | 0.00 | 0.0000 | |||||
| IVAC / Intevac, Inc. | 0.00 | -100.00 | 0.00 | 0.0000 | |||||
| SASR / Sandy Spring Bancorp, Inc. | 0.00 | -100.00 | 0.00 | 0.0000 | |||||
| CMG / Chipotle Mexican Grill, Inc. | 0.00 | -100.00 | 0.00 | 0.0000 | |||||
| MUSA / Murphy USA Inc. | 0.00 | -100.00 | 0.00 | 0.0000 | |||||
| MMLP / Martin Midstream Partners L.P. - Limited Partnership | 0.00 | -100.00 | 0.00 | 0.0000 | |||||
| ATSG / Air Transport Services Group, Inc. | 0.00 | -100.00 | 0.00 | 0.0000 | |||||
| FLIC / The First of Long Island Corporation | 0.00 | -100.00 | 0.00 | 0.0000 | |||||
| WMPN / William Penn Bancorporation | 0.00 | -100.00 | 0.00 | 0.0000 | |||||
| MSI / Motorola Solutions, Inc. | 0.00 | -100.00 | 0.00 | 0.0000 | |||||
| PH / Parker-Hannifin Corporation | 0.00 | -100.00 | 0.00 | 0.0000 | |||||
| PLYA / Playa Hotels & Resorts N.V. | 0.00 | -100.00 | 0.00 | 0.0000 | |||||
| VBFC / Village Bank and Trust Financial Corp. | 0.00 | -100.00 | 0.00 | 0.0000 | |||||
| JWN / Nordstrom, Inc. | 0.00 | -100.00 | 0.00 | 0.0000 | |||||
| KKR / KKR & Co. Inc. | 0.00 | -100.00 | 0.00 | 0.0000 | |||||
| FBMS / The First Bancshares, Inc. | 0.00 | -100.00 | 0.00 | 0.0000 | |||||
| VOXX / VOXX International Corporation | 0.00 | -100.00 | 0.00 | 0.0000 | |||||
| DESP / Despegar.com, Corp. | 0.00 | -100.00 | 0.00 | 0.0000 | |||||
| ITCI / Intra-Cellular Therapies, Inc. | 0.00 | -100.00 | 0.00 | 0.0000 | |||||
| BECN / Beacon Roofing Supply, Inc. | 0.00 | -100.00 | 0.00 | 0.0000 | |||||
| AMPS / Altus Power, Inc. | 0.00 | -100.00 | 0.00 | 0.0000 | |||||
| UNH / UnitedHealth Group Incorporated | 0.00 | -100.00 | 0.00 | 0.0000 | |||||
| EVBN / Evans Bancorp, Inc. | 0.00 | -100.00 | 0.00 | 0.0000 | |||||
| SYK / Stryker Corporation | 0.00 | -100.00 | 0.00 | 0.0000 | |||||
| CMRX / Chimerix, Inc. | 0.00 | -100.00 | 0.00 | 0.0000 | |||||
| TSVT / 2seventy bio, Inc. | 0.00 | -100.00 | 0.00 | 0.0000 |