Statistik Asas
| Pemilik Institusi | 134 total, 134 long only, 0 short only, 0 long/short - change of 4.65% MRQ |
| Purata Peruntukan Portfolio | 0.1246 % - change of 5.10% MRQ |
| Saham Institusi (Panjang) | 7,029,112 (ex 13D/G) - change of 0.21MM shares 3.07% MRQ |
| Nilai Institusi (Panjang) | $ 248,610 USD ($1000) |
Pemilikan Institusi dan Pemegang Saham
BlackRock Science and Technology Trust (US:BST) telah 134 pemilik institusi dan pemegang saham yang telah memfailkan borang 13D/G atau 13F dengan Suruhanjaya Bursa Sekuriti (SEC). Institusi ini memegang sejumlah 7,029,112 saham. Pemegang saham terbesar termasuk Morgan Stanley, Raymond James Financial Inc, Ameriprise Financial Inc, Invesco Ltd., PCEF - Invesco CEF Income Composite ETF, Karpus Management, Inc., Royal Bank Of Canada, 1607 Capital Partners, LLC, LPL Financial LLC, and Wedbush Securities Inc .
BlackRock Science and Technology Trust (NYSE:BST) struktur pemilikan institusi menunjukkan kedudukan semasa dalam syarikat mengikut institusi dan dana serta perubahan terkini dalam saiz kedudukan. Pemegang saham utama boleh termasuk pelabur individu, dana amanah, dana lindung nilai atau institusi. Jadual 13D menunjukkan bahawa pelabur memegang (atau menahan) lebih daripada 5% syarikat dan berhasrat (atau berniat) untuk secara aktif meneruskan perubahan dalam strategi perniagaan. Jadual 13G menunjukkan pelaburan pasif melebihi 5%.
The share price as of September 5, 2025 is 39.60 / share. Previously, on September 9, 2024, the share price was 33.34 / share. This represents an increase of 18.78% over that period.

Skor Sentimen Dana
Skor Sentimen Dana (Skor Pengumpulan Pemilikan fka) mencari saham yang paling banyak dibeli oleh dana. Ia adalah hasil daripada model kuantitatif pelbagai faktor yang canggih yang mengenal pasti syarikat dengan tahap pengumpulan institusi tertinggi. Model pemarkahan ini menggunakan gabungan jumlah kenaikan dalam pemilik yang didedahkan, perubahan dalam peruntukan portfolio dalam pemilik tersebut dan metrik lain. Nombornya berjulat dari 0 hingga 100, dengan nombor yang lebih tinggi menunjukkan tahap pengumpulan yang lebih tinggi kepada rakannya, dan 50 adalah nombor purata.
Kekerapan Kemas Kini: Harian
Lihat Peneroka Pemilikan yang menyediakan senarai syarikat yang mempunyai kedudukan tertinggi.
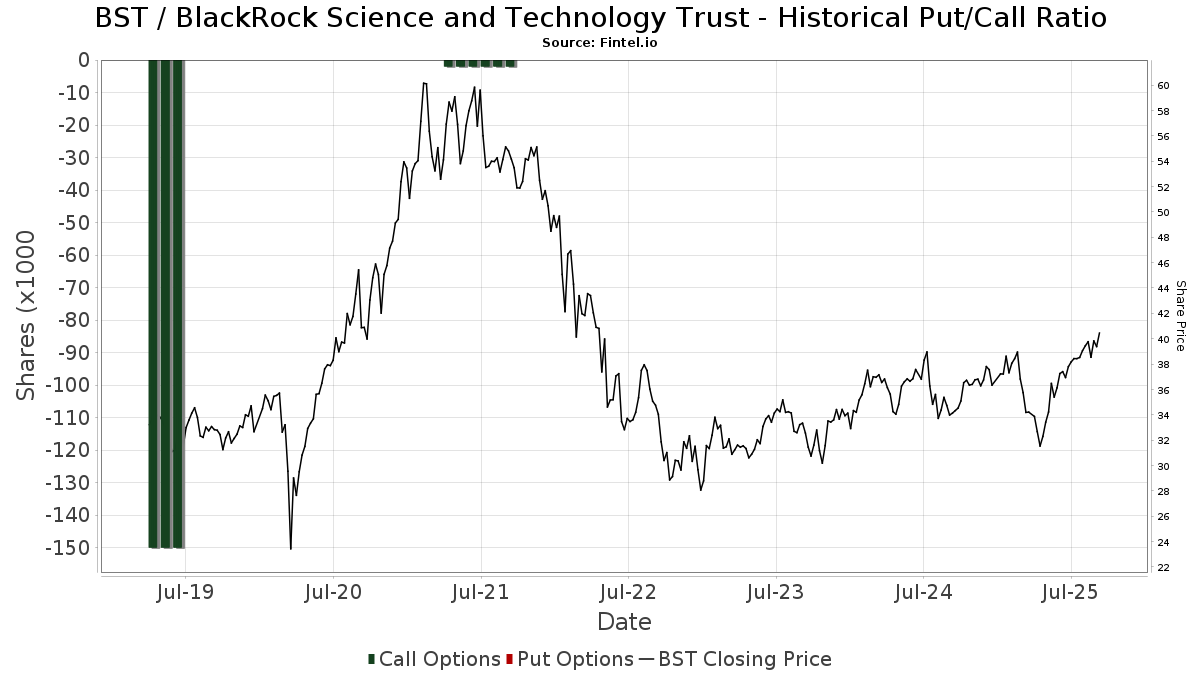
Nisbah Put/Call Institusi
Selain melaporkan isu ekuiti dan hutang standard, institusi yang mempunyai lebih daripada 100MM aset di bawah pengurusan juga mesti mendedahkan pegangan opsyen jual dan beli mereka. Memandangkan opsyen jual secara amnya menunjukkan sentimen negatif, dan opsyen beli menunjukkan sentimen positif, kita boleh mendapatkan gambaran keseluruhan sentimen institusi dengan merencanakan nisbah jual kepada beli. Carta di sebelah kanan memplotkan nisbah jual/beli sejarah untuk instrumen ini.
Menggunakan Nisbah Put/Callsebagai penunjuk sentimen pelabur mengatasi salah satu kekurangan utama menggunakan jumlah pemilikan institusi, iaitu sejumlah besar aset di bawah pengurusan dilaburkan secara pasif untuk menjejaki indeks. Dana yang diurus secara pasif biasanya tidak membeli opsyen, jadi penunjuk nisbah put/call mengekori rapat sentimen dana yang diurus secara aktif.
Pemfailan 13F dan NPORT
Butiran mengenai pemfailan 13F adalah percuma. Perincian mengenai pemfailan NP memerlukan keahlian premium. Baris hijau menunjukkan kedudukan baharu. Baris merah menunjukkan kedudukan tertutup. Klik pautan ikon untuk melihat sejarah transaksi penuh.
Naik Taraf
untuk membuka data premium dan mengeksport ke Excel ![]() .
.
| Tarikh Fail | Sumber | Pelabur | Jenis | Purata Harga (Ang) |
Saham | ΔSaham (%) |
Nilai Dilaporkan ($1000) |
Δ Nilai (%) |
Peruntukan Port (%) |
|
|---|---|---|---|---|---|---|---|---|---|---|
| 2025-07-08 | 13F | Parallel Advisors, LLC | 721 | 8.26 | 28 | 28.57 | ||||
| 2025-09-04 | 13F/A | Advisor Group Holdings, Inc. | 148,258 | 9.57 | 5,659 | 26.77 | ||||
| 2025-07-10 | 13F | Focus Financial Network, Inc. | 15,773 | 9.37 | 602 | 26.74 | ||||
| 2025-08-05 | 13F | Westside Investment Management, Inc. | 700 | 0.00 | 27 | 13.04 | ||||
| 2025-08-04 | 13F | Creative Financial Designs Inc /adv | 313 | 0.00 | 12 | 10.00 | ||||
| 2025-08-14 | 13F | Federation des caisses Desjardins du Quebec | 970 | 0.00 | 37 | 15.63 | ||||
| 2025-08-14 | 13F | Stifel Financial Corp | 59,465 | 8.80 | 2,270 | 25.85 | ||||
| 2025-07-18 | 13F | Consolidated Portfolio Review Corp | 6,901 | -1.16 | 263 | 14.35 | ||||
| 2025-08-13 | 13F | Capital Analysts, Inc. | 660 | 0.00 | 0 | |||||
| 2025-08-14 | 13F | Goldman Sachs Group Inc | 8,347 | 35.79 | 319 | 57.43 | ||||
| 2025-08-14 | 13F | Royal Bank Of Canada | 296,112 | -0.24 | 11,303 | 15.44 | ||||
| 2025-05-13 | 13F | NINE MASTS CAPITAL Ltd | 0 | -100.00 | 0 | |||||
| 2025-08-12 | 13F | LPL Financial LLC | 260,467 | 4.24 | 9,942 | 20.61 | ||||
| 2025-08-08 | 13F | Larson Financial Group LLC | 1,115 | 0.00 | 43 | 16.67 | ||||
| 2025-08-14 | 13F | Comerica Bank | 2,330 | 8.47 | 89 | 25.71 | ||||
| 2025-08-08 | 13F | Calamos Advisors LLC | 8,586 | 1.11 | 328 | 16.79 | ||||
| 2025-07-25 | 13F | Cwm, Llc | 3,336 | -2.54 | 0 | |||||
| 2025-08-05 | 13F | EPG Wealth Management LLC | 0 | -100.00 | 0 | |||||
| 2025-08-14 | 13F | Hilltop Holdings Inc. | 14,988 | 5.39 | 572 | 21.96 | ||||
| 2025-05-15 | 13F | Parvin Asset Management, LLC | 0 | -100.00 | 0 | |||||
| 2025-08-12 | 13F | Jpmorgan Chase & Co | 3,859 | 36.55 | 147 | 58.06 | ||||
| 2025-07-22 | 13F | Kessler Investment Group, LLC | 7 | 0.00 | 0 | |||||
| 2025-08-08 | 13F | Cetera Investment Advisers | 49,871 | 3.68 | 1,904 | 19.99 | ||||
| 2025-08-04 | 13F | Spire Wealth Management | 180 | -79.82 | 7 | -79.31 | ||||
| 2025-08-12 | 13F | Global Retirement Partners, LLC | 1,096 | 0.00 | 42 | 2.50 | ||||
| 2025-07-11 | 13F | Farther Finance Advisors, LLC | 9 | 0.00 | 0 | |||||
| 2025-07-24 | 13F | JNBA Financial Advisors | 359 | 0.00 | 14 | 18.18 | ||||
| 2025-08-07 | 13F | Mosaic Financial Group, Llc | 0 | -100.00 | 0 | |||||
| 2025-08-04 | 13F | Arkadios Wealth Advisors | 7,297 | -10.40 | 279 | 3.73 | ||||
| 2025-07-10 | 13F | Stolper Co | 18,390 | 4.78 | 1 | |||||
| 2025-08-27 | NP | RYMSX - Guggenheim Multi-Hedge Strategies Fund Class P | 13 | -91.28 | 0 | -100.00 | ||||
| 2025-07-07 | 13F | Investors Research Corp | 250 | 10 | ||||||
| 2025-07-31 | 13F | Cambridge Investment Research Advisors, Inc. | 46,043 | -28.85 | 2 | -50.00 | ||||
| 2025-07-16 | 13F | Perigon Wealth Management, LLC | 6,826 | -11.42 | 261 | 2.36 | ||||
| 2025-07-17 | 13F | Janney Montgomery Scott LLC | 148,438 | 0.41 | 6 | 25.00 | ||||
| 2025-08-14 | 13F | Ameriprise Financial Inc | 434,074 | -2.22 | 16,576 | 13.19 | ||||
| 2025-08-14 | 13F | Great Valley Advisor Group, Inc. | 9,980 | 0.00 | 381 | 15.50 | ||||
| 2025-05-12 | 13F | Fmr Llc | 0 | -100.00 | 0 | |||||
| 2025-08-14 | 13F | UBS Group AG | 123,252 | 7.50 | 4,705 | 24.38 | ||||
| 2025-08-27 | NP | RYDEX VARIABLE TRUST - Multi-Hedge Strategies Fund Variable Annuity | 22 | -78.85 | 1 | -100.00 | ||||
| 2025-07-28 | 13F | BRYN MAWR TRUST Co | 2,150 | 0.00 | 82 | 17.14 | ||||
| 2025-08-12 | 13F | J.w. Cole Advisors, Inc. | 32,451 | 13.47 | 1,239 | 31.28 | ||||
| 2025-08-15 | 13F | Kestra Advisory Services, LLC | 21,646 | 3.90 | 826 | 20.23 | ||||
| 2025-05-16 | 13F | Arete Wealth Advisors, LLC | 0 | -100.00 | 0 | |||||
| 2025-07-18 | 13F | TruNorth Capital Management, LLC | 100 | 2.04 | 4 | 0.00 | ||||
| 2025-08-06 | 13F | Prospera Financial Services Inc | 14,685 | 0.44 | 561 | 16.18 | ||||
| 2025-08-14 | 13F | Balyasny Asset Management Llc | 37,096 | 1,416 | ||||||
| 2025-07-08 | 13F | Next Level Private LLC | 9,521 | 1.31 | 363 | 17.10 | ||||
| 2025-08-01 | 13F | Boyd Watterson Asset Management Llc/oh | 96 | 0.00 | 4 | 0.00 | ||||
| 2025-08-12 | 13F | NWF Advisory Services Inc. | 75,000 | 2,474 | ||||||
| 2025-07-31 | 13F | Oppenheimer & Co Inc | 44,407 | 3.72 | 1,695 | 20.04 | ||||
| 2025-08-14 | 13F/A | Rockefeller Capital Management L.P. | 10,133 | 0.66 | 387 | 16.27 | ||||
| 2025-07-08 | 13F | Nbc Securities, Inc. | 16,431 | -0.02 | 1 | |||||
| 2025-08-05 | 13F | Huntington National Bank | 80 | 15.94 | ||||||
| 2025-07-18 | 13F | Truist Financial Corp | 32,373 | 8.09 | 1,236 | 25.00 | ||||
| 2025-08-19 | 13F | National Asset Management, Inc. | 9,834 | 15.68 | 375 | 20.97 | ||||
| 2025-08-06 | 13F | Wedbush Securities Inc | 220,815 | -8.97 | 8 | 0.00 | ||||
| 2025-08-04 | 13F | Bay Colony Advisory Group, Inc d/b/a Bay Colony Advisors | 8,221 | 2.57 | 314 | 16.79 | ||||
| 2025-08-14 | 13F | Jane Street Group, Llc | 10,777 | -48.48 | 411 | -40.43 | ||||
| 2025-08-14 | 13F | Polar Asset Management Partners Inc. | 14,730 | 1.47 | 562 | 17.57 | ||||
| 2025-07-14 | 13F | AdvisorNet Financial, Inc | 1,363 | 83.69 | 52 | 116.67 | ||||
| 2025-08-05 | 13F | Claro Advisors LLC | 8,594 | 1.17 | 328 | 17.14 | ||||
| 2025-08-12 | 13F | NFP Retirement, Inc. | 58,527 | -1.91 | 2,234 | 13.47 | ||||
| 2025-07-25 | 13F | Atria Wealth Solutions, Inc. | 12,482 | 477 | ||||||
| 2025-07-14 | 13F | Armstrong Advisory Group, Inc | 352 | 13 | ||||||
| 2025-07-18 | 13F | Trust Co Of Vermont | 1,500 | 0.00 | 57 | 16.33 | ||||
| 2025-08-01 | 13F | Envestnet Asset Management Inc | 27,410 | 2.53 | 1,046 | 18.73 | ||||
| 2025-07-29 | 13F | International Assets Investment Management, Llc | 13,652 | 2.32 | 521 | 18.41 | ||||
| 2025-08-07 | 13F | Readystate Asset Management Lp | 8,971 | 342 | ||||||
| 2025-08-13 | 13F | Northwestern Mutual Wealth Management Co | 7,210 | 11.80 | 275 | 29.72 | ||||
| 2025-07-25 | NP | FCEF - First Trust CEF Income Opportunity ETF This fund is a listed as child fund of First Trust Advisors Lp and if that institution has disclosed ownership in this security, then these positions will not be double counted when calculating total shares and total value | 35,204 | 10.38 | 1,284 | 10.32 | ||||
| 2025-07-14 | 13F | UMA Financial Services, Inc. | 307 | 0.00 | 12 | 10.00 | ||||
| 2025-08-08 | 13F | Kingsview Wealth Management, LLC | 24,453 | 0.00 | 933 | 15.76 | ||||
| 2025-08-12 | 13F | Walled Lake Planning & Wealth Management, Llc | 8,591 | 2.10 | 328 | 18.05 | ||||
| 2025-08-12 | 13F | Virtu Financial LLC | 0 | -100.00 | 0 | |||||
| 2025-07-21 | 13F | Future Financial Wealth Managment LLC | 14,000 | 0.00 | 534 | 15.84 | ||||
| 2025-07-09 | 13F | Mirador Capital Partners LP | 7,597 | 0.73 | 290 | 16.53 | ||||
| 2025-08-13 | 13F | First Trust Advisors Lp | 70,663 | -0.80 | 2,697 | 14.81 | ||||
| 2025-07-23 | 13F | Abel Hall, LLC | 13,000 | 496 | ||||||
| 2025-07-29 | 13F | Stephens Inc /ar/ | 16,485 | 3.13 | 629 | 19.35 | ||||
| 2025-08-19 | 13F | Newbridge Financial Services Group, Inc. | 68,399 | 2,611 | ||||||
| 2025-04-29 | 13F | Hm Payson & Co | 600 | 0.00 | 20 | -9.52 | ||||
| 2025-08-08 | 13F | Capital Investment Advisory Services, LLC | 6,447 | 6.00 | 246 | 23.00 | ||||
| 2025-06-27 | NP | Calamos ETF Trust - Calamos CEF Income & Arbitrage ETF | 7,812 | -34.79 | 261 | -42.38 | ||||
| 2025-08-14 | 13F | Monetary Management Group Inc | 445 | 0.00 | 17 | 14.29 | ||||
| 2025-08-13 | 13F | Level Four Advisory Services, Llc | 5,776 | -17.69 | 220 | -4.76 | ||||
| 2025-08-12 | 13F | Steward Partners Investment Advisory, Llc | 169,148 | -0.34 | 6,456 | 15.31 | ||||
| 2025-07-31 | 13F | Anchor Capital Management Group Inc | 18,000 | 0.00 | 687 | 15.85 | ||||
| 2025-08-13 | 13F | Invesco Ltd. | 432,215 | -12.41 | 16,498 | 1.34 | ||||
| 2025-07-16 | 13F | ORG Partners LLC | 1,033 | -26.42 | 39 | -17.02 | ||||
| 2025-07-28 | 13F | SFG Wealth Management, LLC. | 20,552 | 0.00 | 784 | 15.63 | ||||
| 2025-07-28 | 13F | Mission Hills Financial Advisory, LLC | 13,402 | 512 | ||||||
| 2025-07-24 | 13F | Aurora Private Wealth, Inc. | 8,808 | 1.46 | 0 | |||||
| 2025-08-14 | 13F | MGB Wealth Management, LLC | 0 | -100.00 | 0 | |||||
| 2025-08-12 | 13F | MAI Capital Management | 1,162 | 0.17 | 44 | 15.79 | ||||
| 2025-06-26 | NP | ATCAX - Anchor Risk Managed Credit Strategies Fund Advisor Class Shares | 18,000 | 0.00 | 656 | 0.00 | ||||
| 2025-07-25 | 13F | Apollon Wealth Management, LLC | 17,980 | 20.24 | 686 | 39.15 | ||||
| 2025-08-06 | 13F | New Millennium Group LLC | 1 | 0 | ||||||
| 2025-08-14 | 13F | Karpus Management, Inc. | 322,983 | 7.39 | 12,328 | 24.25 | ||||
| 2025-07-15 | 13F | Wealth Effects Llc | 14,685 | -14.42 | 561 | -1.06 | ||||
| 2025-08-14 | 13F | Raymond James Financial Inc | 1,045,902 | 2.38 | 39,922 | 18.46 | ||||
| 2025-08-14 | 13F | Herold Advisors, Inc. | 6,233 | 1.65 | 238 | 17.33 | ||||
| 2025-07-24 | 13F | Ronald Blue Trust, Inc. | 100 | 4 | ||||||
| 2025-08-14 | 13F | 1607 Capital Partners, LLC | 284,950 | -8.54 | 10,877 | 5.82 | ||||
| 2025-07-24 | 13F | Jfs Wealth Advisors, Llc | 383 | 0.00 | 15 | 16.67 | ||||
| 2025-08-07 | 13F | Vista Investment Partners Ii, Llc | 6,762 | 0.43 | 258 | 16.22 | ||||
| 2025-05-16 | 13F | Coordinated Financial Services, Inc./CO | 0 | -100.00 | 0 | |||||
| 2025-08-11 | 13F | Principal Securities, Inc. | 2,074 | 12.90 | 79 | 17.91 | ||||
| 2025-08-14 | 13F | Sunbelt Securities, Inc. | 11,435 | 97.16 | 418 | 118.85 | ||||
| 2025-08-07 | 13F | Allworth Financial LP | 7 | 16.67 | 0 | |||||
| 2025-08-08 | 13F | Pnc Financial Services Group, Inc. | 7,840 | -33.50 | 299 | -22.94 | ||||
| 2025-08-05 | 13F | Shaker Financial Services, LLC | 36,014 | 313.15 | 1,375 | 378.75 | ||||
| 2025-08-11 | 13F | Tidemark, LLC | 42 | 0.00 | 2 | 0.00 | ||||
| 2025-08-22 | NP | Cornerstone Strategic Value Fund Inc | 59,383 | 5.85 | 2,267 | 22.49 | ||||
| 2025-08-05 | 13F | Scarborough Advisors, LLC | 259 | 10 | ||||||
| 2025-08-11 | 13F | Elequin Capital Lp | 13,024 | 2,059.87 | 497 | 2,515.79 | ||||
| 2025-08-04 | 13F | Pensionmark Financial Group, Llc | 5,367 | 205 | ||||||
| 2025-07-28 | NP | PCEF - Invesco CEF Income Composite ETF This fund is a listed as child fund of Invesco Ltd. and if that institution has disclosed ownership in this security, then these positions will not be double counted when calculating total shares and total value | 418,145 | -5.67 | 15,246 | -5.70 | ||||
| 2025-07-09 | 13F | David J Yvars Group | 28,045 | 0.57 | 1,071 | 16.03 | ||||
| 2025-08-14 | 13F | GWM Advisors LLC | 820 | 1.61 | 31 | 19.23 | ||||
| 2025-08-12 | 13F | Proequities, Inc. | 0 | 0 | ||||||
| 2025-08-06 | 13F | Commonwealth Equity Services, Llc | 39,897 | -1.40 | 2 | 0.00 | ||||
| 2025-08-13 | 13F | EverSource Wealth Advisors, LLC | 710 | 0.00 | 27 | 17.39 | ||||
| 2025-08-12 | 13F | BlackRock, Inc. | 0 | -100.00 | 0 | |||||
| 2025-08-12 | 13F | Park Square Financial Group, LLC | 44 | 0.00 | 2 | 0.00 | ||||
| 2025-05-06 | 13F | Venturi Wealth Management, LLC | 0 | -100.00 | 0 | |||||
| 2025-08-04 | 13F | Wolverine Asset Management Llc | 13,153 | 502 | ||||||
| 2025-08-13 | 13F | Smith, Moore & Co. | 15,173 | 0.33 | 579 | 16.27 | ||||
| 2025-08-14 | 13F | Wells Fargo & Company/mn | 67,218 | 242.04 | 2,566 | 295.83 | ||||
| 2025-04-21 | 13F | Nelson, Van Denburg & Campbell Wealth Management Group, LLC | 0 | -100.00 | 0 | |||||
| 2025-08-13 | 13F | Keystone Financial Group | 6,734 | 0.00 | 257 | 15.77 | ||||
| 2025-08-04 | 13F | Daymark Wealth Partners, Llc | 5,975 | 228 | ||||||
| 2025-08-14 | 13F | Atomi Financial Group, Inc. | 11,765 | -9.33 | 449 | 4.91 | ||||
| 2025-08-22 | NP | Cornerstone Total Return Fund Inc | 28,142 | 0.00 | 1,074 | 15.73 | ||||
| 2025-08-08 | 13F | Cornerstone Advisors, LLC | 87,525 | 3.90 | 3,341 | 20.19 | ||||
| 2025-08-08 | 13F | Symphony Financial Services, Inc. | 6,311 | -0.71 | 241 | 14.83 | ||||
| 2025-07-01 | 13F | Harbor Investment Advisory, Llc | 3,163 | -9.40 | 121 | 4.35 | ||||
| 2025-07-30 | 13F | D.a. Davidson & Co. | 15,340 | 23.35 | 586 | 42.68 | ||||
| 2025-07-24 | 13F | Us Bancorp \de\ | 0 | -100.00 | 0 | |||||
| 2025-08-14 | 13F | Wealth Preservation Advisors, LLC | 0 | -100.00 | 0 | |||||
| 2025-07-28 | 13F | Mutual Advisors, LLC | 14,245 | 5.40 | 555 | 22.84 | ||||
| 2025-08-14 | 13F | Colony Group, LLC | 0 | -100.00 | 0 | |||||
| 2025-08-14 | 13F | Ambassador Advisors, LLC | 8,673 | 0.91 | 331 | 16.96 | ||||
| 2025-08-15 | 13F | Morgan Stanley | 1,281,194 | -1.47 | 48,903 | 14.00 | ||||
| 2025-08-14 | 13F | Bank Of America Corp /de/ | 192,302 | 1.32 | 7,340 | 17.23 | ||||
| 2025-07-28 | 13F | Harbour Investments, Inc. | 1,455 | 0.00 | 56 | 14.58 | ||||
| 2025-08-11 | 13F | HighTower Advisors, LLC | 35,413 | 1.49 | 1,352 | 17.38 | ||||
| 2025-08-12 | 13F | Boreal Capital Management LLC | 600 | 23 | ||||||
| 2025-08-14 | 13F | IHT Wealth Management, LLC | 0 | -100.00 | 0 | |||||
| 2025-08-15 | 13F | Captrust Financial Advisors | 5,856 | 224 | ||||||
| 2025-05-14 | 13F | Van Hulzen Asset Management, LLC | 0 | -100.00 | 0 | -100.00 | ||||
| 2025-08-14 | 13F | Mercer Global Advisors Inc /adv | 7,449 | 12.74 | 284 | 30.88 | ||||
| 2025-08-14 | 13F | Wiley Bros.-aintree Capital, Llc | 10,056 | 0.26 | 384 | 14.33 |