TPCS - TechPrecision Corporation Saham - Harga Saham, Pemilikan Institusi, Pemegang Saham (NasdaqCM)

TechPrecision Corporation
US ˙ NasdaqCM ˙ US8787392005

Statistik Asas
Pemilik Institusi 35 total, 35 long only, 0 short only, 0 long/short - change of 12.90% MRQ
Purata Peruntukan Portfolio 0.0488 % - change of 13.67% MRQ
Saham Diterbitkan shares (source: Capital IQ)
Saham Institusi (Panjang) 1,613,227 (ex 13D/G) - change of 0.09MM shares 5.65% MRQ
Nilai Institusi (Panjang) $ 5,967 USD ($1000)
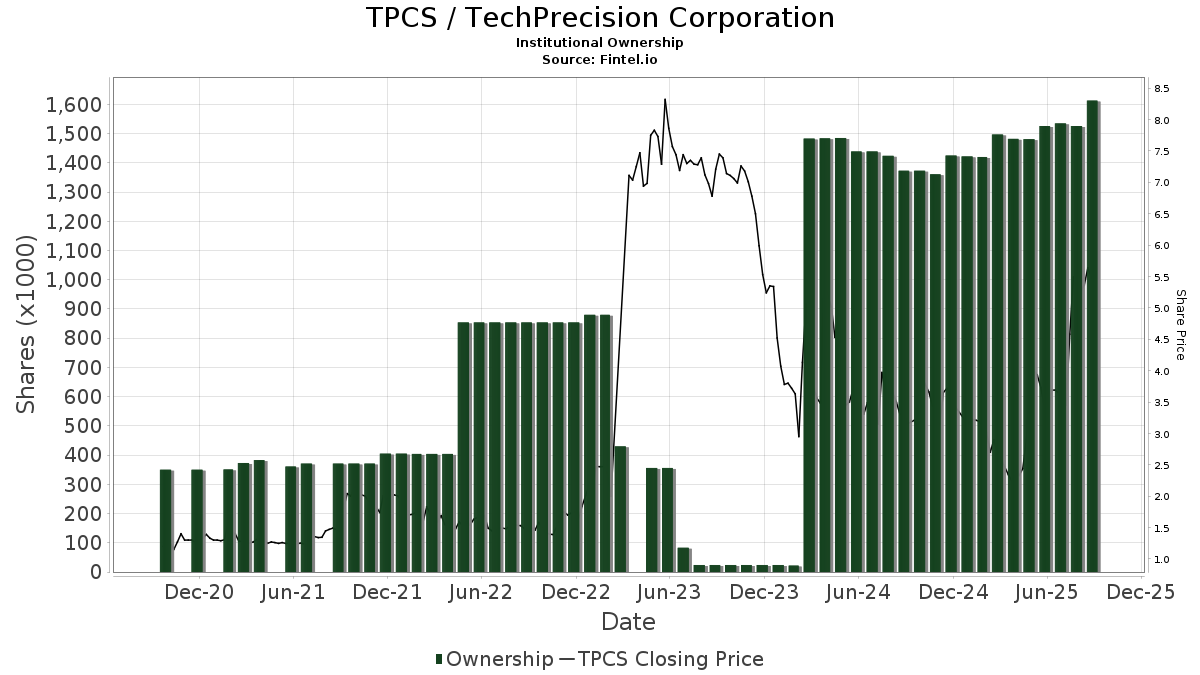
Pemilikan Institusi dan Pemegang Saham

TechPrecision Corporation (US:TPCS) telah 35 pemilik institusi dan pemegang saham yang telah memfailkan borang 13D/G atau 13F dengan Suruhanjaya Bursa Sekuriti (SEC). Institusi ini memegang sejumlah 1,613,227 saham. Pemegang saham terbesar termasuk Wynnefield Capital Inc, ARS Investment Partners, LLC, Vanguard Group Inc, VTSMX - Vanguard Total Stock Market Index Fund Investor Shares, VEXMX - Vanguard Extended Market Index Fund Investor Shares, Geode Capital Management, Llc, Perritt Capital Management Inc, Commons Capital, Llc, PRCGX - Perritt MicroCap Opportunities Fund Investor Class, and FSMAX - Fidelity Extended Market Index Fund .

TechPrecision Corporation (NasdaqCM:TPCS) struktur pemilikan institusi menunjukkan kedudukan semasa dalam syarikat mengikut institusi dan dana serta perubahan terkini dalam saiz kedudukan. Pemegang saham utama boleh termasuk pelabur individu, dana amanah, dana lindung nilai atau institusi. Jadual 13D menunjukkan bahawa pelabur memegang (atau menahan) lebih daripada 5% syarikat dan berhasrat (atau berniat) untuk secara aktif meneruskan perubahan dalam strategi perniagaan. Jadual 13G menunjukkan pelaburan pasif melebihi 5%.

The share price as of September 5, 2025 is 5.24 / share. Previously, on September 6, 2024, the share price was 3.27 / share. This represents an increase of 60.40% over that period.

TPCS / TechPrecision Corporation Institutional Ownership
Skor Sentimen Dana

Skor Sentimen Dana (Skor Pengumpulan Pemilikan fka) mencari saham yang paling banyak dibeli oleh dana. Ia adalah hasil daripada model kuantitatif pelbagai faktor yang canggih yang mengenal pasti syarikat dengan tahap pengumpulan institusi tertinggi. Model pemarkahan ini menggunakan gabungan jumlah kenaikan dalam pemilik yang didedahkan, perubahan dalam peruntukan portfolio dalam pemilik tersebut dan metrik lain. Nombornya berjulat dari 0 hingga 100, dengan nombor yang lebih tinggi menunjukkan tahap pengumpulan yang lebih tinggi kepada rakannya, dan 50 adalah nombor purata.

Kekerapan Kemas Kini: Harian

Lihat Peneroka Pemilikan yang menyediakan senarai syarikat yang mempunyai kedudukan tertinggi.

Nisbah Put/Call Institusi

Selain melaporkan isu ekuiti dan hutang standard, institusi yang mempunyai lebih daripada 100MM aset di bawah pengurusan juga mesti mendedahkan pegangan opsyen jual dan beli mereka. Memandangkan opsyen jual secara amnya menunjukkan sentimen negatif, dan opsyen beli menunjukkan sentimen positif, kita boleh mendapatkan gambaran keseluruhan sentimen institusi dengan merencanakan nisbah jual kepada beli. Carta di sebelah kanan memplotkan nisbah jual/beli sejarah untuk instrumen ini.

Menggunakan Nisbah Put/Callsebagai penunjuk sentimen pelabur mengatasi salah satu kekurangan utama menggunakan jumlah pemilikan institusi, iaitu sejumlah besar aset di bawah pengurusan dilaburkan secara pasif untuk menjejaki indeks. Dana yang diurus secara pasif biasanya tidak membeli opsyen, jadi penunjuk nisbah put/call mengekori rapat sentimen dana yang diurus secara aktif.

TPCS / TechPrecision Corporation Historical Put/Call Ratio
Pemfailan 13F dan NPORT

Butiran mengenai pemfailan 13F adalah percuma. Perincian mengenai pemfailan NP memerlukan keahlian premium. Baris hijau menunjukkan kedudukan baharu. Baris merah menunjukkan kedudukan tertutup. Klik pautan ikon untuk melihat sejarah transaksi penuh.

Naik Taraf untuk membuka data premium dan mengeksport ke Excel .

Tarikh Fail Sumber Pelabur Jenis Purata Harga
(Ang)
Saham ΔSaham
(%)
Nilai
Dilaporkan
($1000)
Δ Nilai
(%)
Peruntukan Port
(%)
2025-08-27 NP VTSMX - Vanguard Total Stock Market Index Fund Investor Shares This fund is a listed as child fund of Vanguard Group Inc and if that institution has disclosed ownership in this security, then these positions will not be double counted when calculating total shares and total value 135,185 75.85 504 186.36
2025-07-15 13F North Star Investment Management Corp. 3 0.00 0
2025-08-12 13F Proequities, Inc. 0 0
2025-06-26 NP DFSU - Dimensional US Sustainability Core 1 ETF 2,743 7
2025-06-26 NP DFA INVESTMENT DIMENSIONS GROUP INC - U.S. Sustainability Core 1 Portfolio Shares This fund is a listed as child fund of Dimensional Fund Advisors Lp and if that institution has disclosed ownership in this security, then these positions will not be double counted when calculating total shares and total value 3,904 10
2025-08-11 13F Vanguard Group Inc 263,466 28.42 983 108.49
2025-06-26 NP DFAC - Dimensional U.S. Core Equity 2 ETF 1,539 4
2025-06-03 NP PRCGX - Perritt MicroCap Opportunities Fund Investor Class 60,500 0.00 148 -22.22
2025-06-24 NP SWTSX - Schwab Total Stock Market Index Fund This fund is a listed as child fund of Charles Schwab Investment Management Inc and if that institution has disclosed ownership in this security, then these positions will not be double counted when calculating total shares and total value 4,478 0.00 11 -28.57
2025-08-14 13F Susquehanna International Group, Llp 20,216 21.33 75 97.37
2025-08-28 NP IWC - iShares Micro-Cap ETF This fund is a listed as child fund of BlackRock Inc. and if that institution has disclosed ownership in this security, then these positions will not be double counted when calculating total shares and total value 1,490 -91.04 6 -86.84
2025-07-28 13F Jag Capital Management, Llc 12,621 -46.57 47 -12.96
2025-07-24 NP FSKAX - Fidelity Total Market Index Fund This fund is a listed as child fund of Fmr Llc and if that institution has disclosed ownership in this security, then these positions will not be double counted when calculating total shares and total value 16,249 0.00 61 32.61
2025-08-14 13F State Street Corp 47,400 0.00 177 61.47
2025-07-24 NP FCFMX - Fidelity Series Total Market Index Fund This fund is a listed as child fund of Fmr Llc and if that institution has disclosed ownership in this security, then these positions will not be double counted when calculating total shares and total value 12,425 11.15 47 43.75
2025-08-08 13F Geode Capital Management, Llc 90,613 -0.04 338 62.50
2025-08-13 13F Northwestern Mutual Wealth Management Co 0 -100.00 0
2025-08-14 13F/A Perritt Capital Management Inc 77,522 0.00 290 62.36
2025-05-13 13F Northern Trust Corp 0 -100.00 0
2025-08-14 13F Citadel Advisors Llc 15,374 57
2025-08-12 13F Jpmorgan Chase & Co 0 -100.00 0
2025-08-12 13F BlackRock, Inc. 20,727 -45.83 78 -12.50
2025-07-24 NP FSMAX - Fidelity Extended Market Index Fund This fund is a listed as child fund of Fmr Llc and if that institution has disclosed ownership in this security, then these positions will not be double counted when calculating total shares and total value 47,668 4.60 180 38.46
2025-08-14 13F UBS Group AG 331 -97.45 1 -96.55
2025-08-14 13F GWM Advisors LLC 17,000 -28.14 64 16.67
2025-07-11 13F Caldwell Securities, Inc 750 0.00 3 100.00
2025-08-27 NP VEXMX - Vanguard Extended Market Index Fund Investor Shares This fund is a listed as child fund of Vanguard Group Inc and if that institution has disclosed ownership in this security, then these positions will not be double counted when calculating total shares and total value 125,690 0.00 469 61.94
2025-06-26 NP DCOR - Dimensional US Core Equity 1 ETF 3,842 9
2025-07-23 13F West Paces Advisors Inc. 0 -100.00 0 -100.00
2025-08-04 13F HBK Sorce Advisory LLC 27,000 0.00 101 61.29
2025-08-12 13F Dimensional Fund Advisors Lp 15,695 -7.82 59 48.72
2025-07-15 13F Wynnefield Capital Inc 433,605 0.00 1,622 62.59
2025-08-08 13F Kingsview Wealth Management, LLC 11,300 42
2025-08-14 13F Diversify Advisory Services, LLC 25,142 140
2025-07-29 13F Commons Capital, Llc 69,413 0.00 260 62.89
2025-08-15 13F Tower Research Capital LLC (TRC) 1,214 -50.49 5 -20.00
2025-08-26 NP EQ ADVISORS TRUST - 1290 VT Micro Cap Portfolio Class IB 174 -80.90 1 -100.00
2025-08-11 13F ARS Investment Partners, LLC 312,608 9.95 1,169 12.73
2025-08-14 13F Bank Of America Corp /de/ 119 58.67 0
2025-06-26 NP DFA INVESTMENT DIMENSIONS GROUP INC - U.S. Social Core Equity 2 Portfolio Shares This fund is a listed as child fund of Dimensional Fund Advisors Lp and if that institution has disclosed ownership in this security, then these positions will not be double counted when calculating total shares and total value 1,825 4
Fintel data has been cited in the following publications:
Daily Mail Fox Business Business Insider Wall Street Journal The Washington Post Bloomberg Financial Times Globe and Mail
NASDAQ.com Reuters The Guardian Associated Press FactCheck.org Snopes Politifact
Federal Register The Intercept Forbes Fortune Magazine TheStreet Time Magazine Canadian Broadcasting Corporation International Business Times
Cambridge University Press Investopedia MarketWatch NY Daily News Entrepreneur Newsweek Barron's El Economista