Statistik Asas
| Pemilik Institusi | 187 total, 187 long only, 0 short only, 0 long/short - change of 11.98% MRQ |
| Purata Peruntukan Portfolio | 0.5930 % - change of -13.90% MRQ |
| Saham Institusi (Panjang) | 89,947,598 (ex 13D/G) - change of 16.11MM shares 21.81% MRQ |
| Nilai Institusi (Panjang) | $ 2,273,915 USD ($1000) |
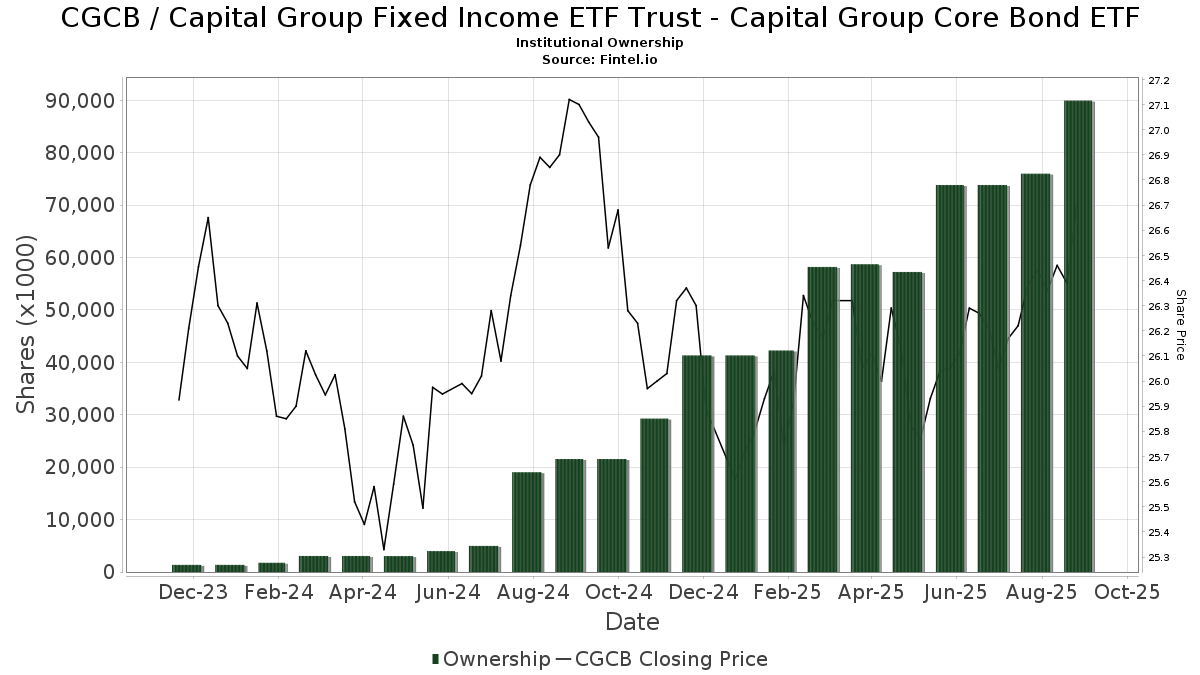
Pemilikan Institusi dan Pemegang Saham
Capital Group Fixed Income ETF Trust - Capital Group Core Bond ETF (US:CGCB) telah 187 pemilik institusi dan pemegang saham yang telah memfailkan borang 13D/G atau 13F dengan Suruhanjaya Bursa Sekuriti (SEC). Institusi ini memegang sejumlah 89,947,598 saham. Pemegang saham terbesar termasuk LPL Financial LLC, Advance Capital Management, Inc., Capital International Investors, CGBL - Capital Group Core Balanced ETF Share Class, Morgan Stanley, Envestnet Asset Management Inc, Northwestern Mutual Wealth Management Co, Raymond James Financial Inc, Cetera Investment Advisers, and Advisor Group Holdings, Inc. .
Capital Group Fixed Income ETF Trust - Capital Group Core Bond ETF (ARCA:CGCB) struktur pemilikan institusi menunjukkan kedudukan semasa dalam syarikat mengikut institusi dan dana serta perubahan terkini dalam saiz kedudukan. Pemegang saham utama boleh termasuk pelabur individu, dana amanah, dana lindung nilai atau institusi. Jadual 13D menunjukkan bahawa pelabur memegang (atau menahan) lebih daripada 5% syarikat dan berhasrat (atau berniat) untuk secara aktif meneruskan perubahan dalam strategi perniagaan. Jadual 13G menunjukkan pelaburan pasif melebihi 5%.
The share price as of September 5, 2025 is 26.61 / share. Previously, on September 6, 2024, the share price was 27.00 / share. This represents a decline of 1.44% over that period.
Skor Sentimen Dana
Skor Sentimen Dana (Skor Pengumpulan Pemilikan fka) mencari saham yang paling banyak dibeli oleh dana. Ia adalah hasil daripada model kuantitatif pelbagai faktor yang canggih yang mengenal pasti syarikat dengan tahap pengumpulan institusi tertinggi. Model pemarkahan ini menggunakan gabungan jumlah kenaikan dalam pemilik yang didedahkan, perubahan dalam peruntukan portfolio dalam pemilik tersebut dan metrik lain. Nombornya berjulat dari 0 hingga 100, dengan nombor yang lebih tinggi menunjukkan tahap pengumpulan yang lebih tinggi kepada rakannya, dan 50 adalah nombor purata.
Kekerapan Kemas Kini: Harian
Lihat Peneroka Pemilikan yang menyediakan senarai syarikat yang mempunyai kedudukan tertinggi.
Nisbah Put/Call Institusi
Selain melaporkan isu ekuiti dan hutang standard, institusi yang mempunyai lebih daripada 100MM aset di bawah pengurusan juga mesti mendedahkan pegangan opsyen jual dan beli mereka. Memandangkan opsyen jual secara amnya menunjukkan sentimen negatif, dan opsyen beli menunjukkan sentimen positif, kita boleh mendapatkan gambaran keseluruhan sentimen institusi dengan merencanakan nisbah jual kepada beli. Carta di sebelah kanan memplotkan nisbah jual/beli sejarah untuk instrumen ini.
Menggunakan Nisbah Put/Callsebagai penunjuk sentimen pelabur mengatasi salah satu kekurangan utama menggunakan jumlah pemilikan institusi, iaitu sejumlah besar aset di bawah pengurusan dilaburkan secara pasif untuk menjejaki indeks. Dana yang diurus secara pasif biasanya tidak membeli opsyen, jadi penunjuk nisbah put/call mengekori rapat sentimen dana yang diurus secara aktif.
Pemfailan 13F dan NPORT
Butiran mengenai pemfailan 13F adalah percuma. Perincian mengenai pemfailan NP memerlukan keahlian premium. Baris hijau menunjukkan kedudukan baharu. Baris merah menunjukkan kedudukan tertutup. Klik pautan ikon untuk melihat sejarah transaksi penuh.
Naik Taraf
untuk membuka data premium dan mengeksport ke Excel ![]() .
.
| Tarikh Fail | Sumber | Pelabur | Jenis | Purata Harga (Ang) |
Saham | ΔSaham (%) |
Nilai Dilaporkan ($1000) |
Δ Nilai (%) |
Peruntukan Port (%) |
|
|---|---|---|---|---|---|---|---|---|---|---|
| 2025-08-12 | 13F | Rather & Kittrell, Inc. | 9,455 | 0.00 | 249 | 0.00 | ||||
| 2025-08-14 | 13F | UBS Group AG | 137,621 | 13.40 | 3,619 | 13.48 | ||||
| 2025-07-23 | 13F | Cannon Wealth Management Services, LLC | 215,420 | 2.95 | 5,666 | 3.62 | ||||
| 2025-07-29 | 13F | Signature Estate & Investment Advisors Llc | 158,200 | -5.75 | 4,161 | -5.69 | ||||
| 2025-08-12 | 13F | XTX Topco Ltd | 7,724 | 203 | ||||||
| 2025-08-11 | 13F | Private Advisor Group, LLC | 406,758 | -7.54 | 10,698 | -7.47 | ||||
| 2025-07-25 | 13F | Envestnet Portfolio Solutions, Inc. | 97,364 | -22.99 | 2,561 | -22.94 | ||||
| 2025-08-11 | 13F | Principal Securities, Inc. | 1,264 | 33 | ||||||
| 2025-08-12 | 13F | Lodestone Wealth Management LLC | 87,073 | -0.49 | 2,290 | -0.39 | ||||
| 2025-08-12 | 13F | Jpmorgan Chase & Co | 197,988 | 3.00 | 5,207 | 3.09 | ||||
| 2025-05-02 | 13F | Capital A Wealth Management, LLC | 885 | -6.84 | 23 | -4.17 | ||||
| 2025-07-28 | 13F | Holistic Planning, LLC | 42,325 | 80.43 | 1,113 | 80.68 | ||||
| 2025-08-12 | 13F | Summit Global Investments | 8,273 | 0 | ||||||
| 2025-07-22 | 13F | Merit Financial Group, LLC | 115,220 | 135.22 | 3,030 | 135.43 | ||||
| 2025-07-29 | 13F | Balboa Wealth Partners | 10,047 | 264 | ||||||
| 2025-08-11 | 13F | Perennial Investment Advisors, LLC | 20,855 | 12.41 | 548 | 12.53 | ||||
| 2025-07-28 | 13F | Sagespring Wealth Partners, Llc | 11,161 | 17.73 | 294 | 17.67 | ||||
| 2025-08-14 | 13F | GWM Advisors LLC | 170,961 | 31.27 | 4,496 | 31.39 | ||||
| 2025-08-14 | 13F | Wiley Bros.-aintree Capital, Llc | 282,268 | 40.25 | 7,441 | 40.38 | ||||
| 2025-08-12 | 13F | AlphaCore Capital LLC | 19,558 | 0.05 | 514 | 0.19 | ||||
| 2025-08-14 | 13F | Royal Bank Of Canada | 1,287,571 | 6.84 | 33,863 | 6.92 | ||||
| 2025-07-25 | 13F | Cwm, Llc | 4,417 | 30.45 | 0 | |||||
| 2025-08-08 | 13F | Kingsview Wealth Management, LLC | 235,612 | 22.85 | 6,197 | 22.94 | ||||
| 2025-08-14 | 13F | Full Sail Capital, LLC | 0 | -100.00 | 0 | |||||
| 2025-08-06 | 13F | Golden State Wealth Management, LLC | 0 | -100.00 | 0 | -100.00 | ||||
| 2025-08-08 | 13F | CWS Financial Advisors, LLC | 30,204 | 8.02 | 794 | 8.17 | ||||
| 2025-07-24 | 13F | Cyndeo Wealth Partners, LLC | 14,094 | 0.37 | 371 | 0.27 | ||||
| 2025-07-25 | 13F | Atria Wealth Solutions, Inc. | 251,920 | -16.03 | 6,626 | -16.25 | ||||
| 2025-08-04 | 13F | Bay Colony Advisory Group, Inc d/b/a Bay Colony Advisors | 16,488 | -21.87 | 434 | -21.70 | ||||
| 2025-08-11 | 13F | Aptus Capital Advisors, LLC | 2,000 | 0.00 | 53 | 0.00 | ||||
| 2025-07-17 | 13F | Leverty Financial Group, LLC | 1,427,371 | 5.17 | 37,538 | 5.25 | ||||
| 2025-08-14 | 13F | Benjamin Edwards Inc | 76,292 | 24.30 | 2,006 | 24.36 | ||||
| 2025-08-14 | 13F | Great Valley Advisor Group, Inc. | 76,923 | 11.90 | 2,023 | 12.02 | ||||
| 2025-07-02 | 13F | Dentgroup LLC | 214,207 | 8.07 | 5,634 | 8.14 | ||||
| 2025-08-13 | 13F | Baird Financial Group, Inc. | 75,595 | -0.12 | 1,988 | -0.05 | ||||
| 2025-08-14 | 13F | IHT Wealth Management, LLC | 8,707 | 229 | ||||||
| 2025-08-11 | 13F | United Advisor Group, LLC | 85,895 | 22.20 | 2,259 | 22.31 | ||||
| 2025-08-12 | 13F | Global Retirement Partners, LLC | 82,963 | 1,031.52 | 2,182 | 1,053.97 | ||||
| 2025-08-04 | 13F | Saxony Capital Management, LLC | 72,711 | 2.25 | 1,912 | 2.36 | ||||
| 2025-08-05 | 13F | Hunter Associates Investment Management Llc | 8,730 | 0 | ||||||
| 2025-07-08 | 13F | Advance Capital Management, Inc. | 11,517,435 | 6.86 | 302,909 | 6.94 | ||||
| 2025-07-29 | 13F | Madison Wealth Partners, Inc | 10,971 | 289 | ||||||
| 2025-08-12 | 13F | Steward Partners Investment Advisory, Llc | 8,915 | 422.87 | 234 | 431.82 | ||||
| 2025-07-21 | 13F | Capital Planning LLC | 0 | -100.00 | 0 | |||||
| 2025-07-24 | 13F | IFP Advisors, Inc | 186 | 2.76 | 5 | 0.00 | ||||
| 2025-08-11 | 13F | Western Wealth Management, LLC | 107,262 | 4.28 | 2,821 | 4.33 | ||||
| 2025-08-12 | 13F | Titleist Asset Management, Llc | 9,000 | 237 | ||||||
| 2025-07-24 | 13F | MSH Capital Advisors LLC | 17,947 | 24.48 | 472 | 24.87 | ||||
| 2025-08-12 | 13F | Marshall & Sterling Wealth Advisors Inc. | 2,466 | 18.79 | 65 | 18.52 | ||||
| 2025-08-14 | 13F | Raymond James Financial Inc | 2,153,628 | 35.49 | 56,640 | 35.59 | ||||
| 2025-04-30 | 13F | Allworth Financial LP | 0 | -100.00 | 0 | |||||
| 2025-08-05 | 13F | Mission Wealth Management, Lp | 64,183 | 2.15 | 1,688 | 2.24 | ||||
| 2025-08-14 | 13F | Jane Street Group, Llc | 639,046 | 82.74 | 16,807 | 82.89 | ||||
| 2025-08-13 | 13F | Congress Wealth Management LLC / DE / | 70,156 | 5.59 | 1,845 | 5.85 | ||||
| 2025-08-12 | 13F | J.w. Cole Advisors, Inc. | 8,157 | 0.65 | 215 | 0.94 | ||||
| 2025-07-10 | 13F | Wealth Enhancement Advisory Services, Llc | 356,869 | -4.31 | 9,343 | -4.68 | ||||
| 2025-08-12 | 13F | Wood Tarver Financial Group, LLC | 67,610 | 23.39 | 2 | -99.93 | ||||
| 2025-05-08 | 13F | HHM Wealth Advisors, LLC | 0 | -100.00 | 0 | |||||
| 2025-07-18 | 13F | Trilogy Capital Inc. | 12,060 | 0.00 | 317 | 0.32 | ||||
| 2025-08-08 | 13F | Cetera Investment Advisers | 1,549,123 | 36.76 | 40,742 | 36.87 | ||||
| 2025-08-14 | 13F | Citadel Advisors Llc | 0 | -100.00 | 0 | |||||
| 2025-07-16 | 13F | Freestate Advisors LLC | 12,913 | 340 | ||||||
| 2025-08-13 | 13F | Continuum Advisory, LLC | 742,923 | 11.84 | 19,539 | 11.93 | ||||
| 2025-07-24 | 13F | Drucker Wealth 3.0, LLC | 0 | -100.00 | 0 | |||||
| 2025-07-22 | 13F | Berger Financial Group, Inc | 71,444 | 14.66 | 1,879 | 14.72 | ||||
| 2025-08-12 | 13F | SRS Capital Advisors, Inc. | 392 | 10 | ||||||
| 2025-08-15 | 13F | Captrust Financial Advisors | 658,661 | 77.47 | 17,323 | 77.61 | ||||
| 2025-08-13 | 13F | Flow Traders U.s. Llc | 0 | -100.00 | 0 | |||||
| 2025-07-25 | 13F | Bill Few Associates, Inc. | 47,071 | 0.91 | 1,238 | 0.98 | ||||
| 2025-08-14 | 13F | Old Mission Capital Llc | 8,647 | -64.84 | 227 | -64.86 | ||||
| 2025-07-21 | 13F | Ameritas Advisory Services, LLC | 12,516 | 32.25 | 329 | 32.66 | ||||
| 2025-08-06 | 13F | Prospera Financial Services Inc | 30,329 | 40.87 | 798 | 41.06 | ||||
| 2025-07-30 | 13F | Smith Thornton Advisors LLC | 192,687 | -0.01 | 5,068 | 0.06 | ||||
| 2025-08-04 | 13F | Kovack Advisors, Inc. | 0 | -100.00 | 0 | |||||
| 2025-07-11 | 13F | Farther Finance Advisors, LLC | 308 | 8 | ||||||
| 2025-08-05 | 13F | Aurdan Capital Management, LLC | 30,786 | 0.06 | 810 | 0.12 | ||||
| 2025-08-14 | 13F | Sei Investments Co | 505,722 | 1,552.31 | 13,300 | 1,554.23 | ||||
| 2025-08-18 | 13F | Geneos Wealth Management Inc. | 376,695 | 173.42 | 9,907 | 173.67 | ||||
| 2025-08-13 | 13F | Capital Group Private Client Services, Inc. | 18,827 | 20.58 | 495 | 20.73 | ||||
| 2025-08-15 | 13F | Equitable Holdings, Inc. | 128,855 | 41.88 | 3,389 | 41.99 | ||||
| 2025-08-13 | 13F | Capital Analysts, Inc. | 9,813 | 139.11 | 0 | |||||
| 2025-08-14 | 13F | Wells Fargo & Company/mn | 326,252 | 217,401.33 | 8,580 | 285,900.00 | ||||
| 2025-08-04 | 13F | Creekmur Asset Management LLC | 344,870 | 9,070 | ||||||
| 2025-07-30 | 13F | Strategic Blueprint, LLC | 210,070 | 19.89 | 5,525 | 19.98 | ||||
| 2025-07-09 | 13F | Pines Wealth Management, LLC | 37,032 | 18.82 | 969 | 19.48 | ||||
| 2025-07-17 | 13F | Janney Montgomery Scott LLC | 30,315 | 73.99 | 1 | |||||
| 2025-08-08 | 13F | Meridian Wealth Management, LLC | 56,897 | -3.21 | 1,496 | -3.11 | ||||
| 2025-08-14 | 13F | Integrated Wealth Concepts LLC | 46,793 | 32.03 | 1,231 | 32.12 | ||||
| 2025-08-12 | 13F | LPL Financial LLC | 12,296,282 | 31.09 | 323,392 | 31.19 | ||||
| 2025-07-31 | 13F | Cambridge Investment Research Advisors, Inc. | 1,192,570 | 7.88 | 31 | 6.90 | ||||
| 2025-07-18 | 13F | Panoramic Capital Partners, LLC | 586,898 | 15,365 | ||||||
| 2025-08-04 | 13F | IFG Advisory, LLC | 43,320 | 91.23 | 1,139 | 91.43 | ||||
| 2025-07-29 | 13F | Werba Rubin Papier Wealth Management | 9,243 | 243 | ||||||
| 2025-07-25 | 13F | Concurrent Investment Advisors, LLC | 130,444 | 2.18 | 3,431 | 2.27 | ||||
| 2025-08-14 | 13F | Freedom Financial Partners LLC | 232,886 | 1.76 | 6,125 | 1.83 | ||||
| 2025-07-14 | 13F | U.S. Capital Wealth Advisors, LLC | 40,497 | 13.51 | 1,065 | 13.66 | ||||
| 2025-08-12 | 13F | Proequities, Inc. | 0 | 0 | ||||||
| 2025-07-21 | 13F | Barrett & Company, Inc. | 3,050 | 0.00 | 80 | 0.00 | ||||
| 2025-08-14 | 13F | Ancora Advisors, LLC | 121,231 | -8.88 | 3,188 | -8.81 | ||||
| 2025-07-10 | 13F | American Financial Advisors, LLC | 878,099 | -2.90 | 23,094 | -2.83 | ||||
| 2025-05-09 | 13F | Delta Financial Group, Inc. | 33,195 | -3.92 | 1 | |||||
| 2025-07-30 | 13F | Financial Perspectives, Inc | 6,004 | 17.73 | 158 | 17.16 | ||||
| 2025-07-16 | 13F | ORG Partners LLC | 6,819 | 19,955.88 | 179 | |||||
| 2025-07-29 | 13F | Stephens Inc /ar/ | 584,325 | 7.84 | 15,368 | 7.92 | ||||
| 2025-07-16 | 13F | Spinnaker Investment Group, LLC | 773,624 | 10.78 | 20,346 | 10.87 | ||||
| 2025-08-14 | 13F/A | Rockefeller Capital Management L.P. | 189,609 | -1.36 | 4,987 | -1.29 | ||||
| 2025-07-17 | 13F | Venture Visionary Partners LLC | 11,434 | 301 | ||||||
| 2025-07-11 | 13F | AA Financial Advisors, LLC | 24,616 | 647 | ||||||
| 2025-07-29 | 13F | Morgan Dempsey Capital Management Llc | 5,622 | 15.80 | 148 | 15.75 | ||||
| 2025-07-30 | 13F | Cullen/frost Bankers, Inc. | 89,177 | 36.33 | 2,345 | 36.42 | ||||
| 2025-09-04 | 13F/A | Advisor Group Holdings, Inc. | 1,504,689 | -0.82 | 39,578 | -0.74 | ||||
| 2025-05-15 | 13F | Smith, Moore & Co. | 0 | -100.00 | 0 | |||||
| 2025-08-12 | 13F | Richmond Investment Services, LLC | 24,508 | 645 | ||||||
| 2025-08-15 | 13F | Kestra Advisory Services, LLC | 338,811 | 14.93 | 8,911 | 15.01 | ||||
| 2025-07-09 | 13F | Sunpointe, LLC | 13,764 | 362 | ||||||
| 2025-08-13 | 13F | M Holdings Securities, Inc. | 24,124 | 1 | ||||||
| 2025-07-28 | 13F | Eq Wealth Advisors, Llc | 11,138 | 18.44 | 293 | 18.22 | ||||
| 2025-08-13 | 13F | Townsquare Capital Llc | 0 | -100.00 | 0 | |||||
| 2025-08-13 | 13F | Colonial Trust Co / SC | 2,375 | 39.71 | 62 | 40.91 | ||||
| 2025-07-11 | 13F | LongView Wealth Management | 53,120 | 30.10 | 1,397 | 30.32 | ||||
| 2025-07-17 | 13F | Johnson Bixby & Associates, LLC | 8,272 | 0.00 | 218 | 0.00 | ||||
| 2025-08-25 | 13F | Silverlake Wealth Management Llc | 7,909 | 208 | ||||||
| 2025-08-14 | 13F | Evergreen Wealth Solutions, LLC | 73,025 | 61.97 | 1,921 | 62.16 | ||||
| 2025-08-15 | 13F | Lantern Wealth Advisors, LLC | 8,679 | 228 | ||||||
| 2025-08-11 | 13F | Rothschild Investment Llc | 99,188 | 26.58 | 2,609 | 26.66 | ||||
| 2025-07-15 | 13F | Hartmann Taylor Wealth Management, LLC | 12,546 | 58.55 | 330 | 58.94 | ||||
| 2025-07-21 | 13F | Ameriflex Group, Inc. | 340 | 0.29 | 9 | 0.00 | ||||
| 2025-07-09 | 13F | Dynamic Advisor Solutions LLC | 195,948 | 13.63 | 5,153 | 13.73 | ||||
| 2025-08-06 | 13F | Cannon Financial Strategists, Inc. | 464,593 | 0.96 | 12,219 | 1.04 | ||||
| 2025-07-17 | 13F | Tempus Wealth Planning, LLC | 26,583 | 2.91 | 699 | 3.10 | ||||
| 2025-08-11 | 13F | Synergy Investment Management, LLC | 0 | -100.00 | 0 | |||||
| 2025-07-25 | 13F | Apollon Wealth Management, LLC | 28,298 | 744 | ||||||
| 2025-08-07 | 13F | Kestra Private Wealth Services, Llc | 9,731 | 256 | ||||||
| 2025-07-15 | 13F | Regatta Capital Group, Llc | 718,467 | 1.76 | 18,896 | 1.83 | ||||
| 2025-08-14 | 13F | Guardian Wealth Advisors, Llc / Nc | 2,000 | 0.00 | 53 | 0.00 | ||||
| 2025-07-14 | 13F | Armstrong Advisory Group, Inc | 0 | -100.00 | 0 | |||||
| 2025-07-23 | 13F | Valmark Advisers, Inc. | 876,546 | 2.36 | 23,053 | 2.44 | ||||
| 2025-08-11 | 13F | HighTower Advisors, LLC | 37,981 | 999 | ||||||
| 2025-08-07 | 13F | PFG Advisors | 12,967 | -7.92 | 341 | -7.84 | ||||
| 2025-08-15 | 13F | Morgan Stanley | 6,013,104 | 8.34 | 158,145 | 8.42 | ||||
| 2025-07-28 | 13F | Keeler & Nadler Financial Planning & Wealth Management | 128,648 | -30.26 | 3,383 | -30.07 | ||||
| 2025-08-13 | 13F | Strategic Family Wealth Counselors, L.L.C. | 172,022 | 7.08 | 4,524 | 7.18 | ||||
| 2025-07-28 | 13F | RFG Advisory, LLC | 208,523 | -2.22 | 5,484 | -2.14 | ||||
| 2025-07-28 | 13F | Harbour Investments, Inc. | 75,910 | 8.31 | 1,996 | 8.42 | ||||
| 2025-08-08 | 13F | Good Life Advisors, LLC | 0 | -100.00 | 0 | |||||
| 2025-08-04 | 13F | Pensionmark Financial Group, Llc | 18,393 | 118.39 | 484 | 118.55 | ||||
| 2025-08-19 | 13F | Advisory Services Network, LLC | 11,497 | 0.21 | 300 | -0.33 | ||||
| 2025-08-05 | 13F | Tsfg, Llc | 257,051 | 7 | ||||||
| 2025-08-14 | 13F | Comerica Bank | 17,099 | 22.00 | 450 | 22.01 | ||||
| 2025-08-13 | 13F | Capital International Investors | 9,883,029 | 27.71 | 259,924 | 27.81 | ||||
| 2025-08-15 | 13F | WFA of San Diego, LLC | 500 | 13 | ||||||
| 2025-08-14 | 13F | Bank Of America Corp /de/ | 1,203,357 | 269.76 | 31,648 | 270.07 | ||||
| 2025-07-22 | 13F | Orca Wealth Management, LLC | 9,735 | 0.85 | 256 | 1.19 | ||||
| 2025-08-14 | 13F | Keystone Financial Services, LLC | 162,251 | 6.12 | 4,267 | 6.22 | ||||
| 2025-08-27 | 13F/A | Brinker Capital Investments, LLC | 32,320 | 83.24 | 850 | 83.59 | ||||
| 2025-07-03 | 13F | Arvest Investments, Inc. | 976 | 0.00 | 26 | 0.00 | ||||
| 2025-08-14 | 13F | Smartleaf Asset Management LLC | 282,228 | 10.05 | 7,394 | 9.93 | ||||
| 2025-07-14 | 13F | AdvisorNet Financial, Inc | 25,878 | 9.57 | 681 | 9.68 | ||||
| 2025-08-06 | 13F | Commonwealth Equity Services, Llc | 796,700 | 33.48 | 21 | 33.33 | ||||
| 2025-07-08 | 13F | Nbc Securities, Inc. | 365 | 0.00 | 0 | |||||
| 2025-08-05 | 13F | Bank Of Montreal /can/ | 5,300 | 23.26 | 139 | 23.01 | ||||
| 2025-08-04 | 13F | Creative Financial Designs Inc /adv | 14,635 | 116.40 | 385 | 116.95 | ||||
| 2025-08-14 | 13F | Mml Investors Services, Llc | 1,044,671 | 50.44 | 27 | 50.00 | ||||
| 2025-07-31 | 13F | Future You Wealth Llc | 255,289 | 13.96 | 6,714 | 14.05 | ||||
| 2025-07-17 | 13F | Greenbush Financial Group, LLC | 351,514 | 7.32 | 9,245 | 7.40 | ||||
| 2025-07-23 | 13F | InTrack Investment Management Inc | 85,025 | 2,236 | ||||||
| 2025-07-10 | 13F | Sovran Advisors, LLC | 275,159 | 2,040.48 | 7,176 | 2,048.50 | ||||
| 2025-08-01 | 13F | Rossby Financial, LCC | 161 | 4 | ||||||
| 2025-05-15 | 13F/A | Orion Portfolio Solutions, LLC | 17,638 | 464 | ||||||
| 2025-07-31 | 13F | Richards, Merrill & Peterson, Inc. | 66,720 | 33.24 | 1,755 | 33.38 | ||||
| 2025-08-14 | 13F | Herold Advisors, Inc. | 8,679 | 228 | ||||||
| 2025-08-04 | 13F | Assetmark, Inc | 9,359 | 246 | ||||||
| 2025-07-18 | 13F | Truist Financial Corp | 61,167 | 35.88 | 1,609 | 36.04 | ||||
| 2025-07-30 | 13F/A | KPP Advisory Services LLC | 65,349 | -3.55 | 1,719 | -3.48 | ||||
| 2025-08-13 | 13F | Jones Financial Companies Lllp | 347,328 | 65.16 | 9,100 | 64.97 | ||||
| 2025-08-13 | 13F | VestGen Advisors, LLC | 188,202 | 8.53 | 4,950 | 8.60 | ||||
| 2025-08-14 | 13F | Stifel Financial Corp | 1,268,037 | 0.25 | 33,349 | 0.32 | ||||
| 2025-08-05 | 13F | Sigma Planning Corp | 28,069 | -0.00 | 738 | 0.14 | ||||
| 2025-07-28 | 13F | Mutual Advisors, LLC | 103,067 | 31.98 | 2,699 | 31.72 | ||||
| 2025-07-30 | 13F | D.a. Davidson & Co. | 580,897 | -31.15 | 15,278 | -31.10 | ||||
| 2025-07-29 | 13F | Private Trust Co Na | 3,964 | 133.18 | 104 | 136.36 | ||||
| 2025-07-22 | 13F | Confluence Wealth Services, Inc. | 62,377 | 6.84 | 1,641 | 8.11 | ||||
| 2025-08-13 | 13F | Vermillion & White Wealth Management Group, LLC | 3,952 | 5.56 | 104 | 5.10 | ||||
| 2025-08-20 | NP | CGBL - Capital Group Core Balanced ETF Share Class | 9,798,204 | 28.17 | 257,693 | 28.27 | ||||
| 2025-07-29 | 13F | Stratos Wealth Partners, LTD. | 55,369 | 480.33 | 1,456 | 482.40 | ||||
| 2025-08-14 | 13F | Sunbelt Securities, Inc. | 10,927 | 16.12 | 282 | 13.77 | ||||
| 2025-08-13 | 13F | Gateway Wealth Partners, LLC | 22,246 | 31.15 | 585 | 31.46 | ||||
| 2025-07-07 | 13F | Peterson Wealth Advisors, LLC | 7,614 | 200 | ||||||
| 2025-07-30 | 13F | Brookstone Capital Management | 21,382 | -50.24 | 562 | -50.22 | ||||
| 2025-08-12 | 13F | Jacobi Capital Management LLC | 20,904 | 2.30 | 550 | 2.43 | ||||
| 2025-07-24 | 13F | Endeavor Private Wealth, Inc. | 114,217 | 27.62 | 3,004 | 27.73 | ||||
| 2025-08-14 | 13F | Mariner, LLC | 67,940 | -3.76 | 1,787 | -3.72 | ||||
| 2025-07-09 | 13F | Fiduciary Alliance LLC | 122,871 | 3,232 | ||||||
| 2025-08-07 | 13F | Resources Investment Advisors, LLC. | 10,847 | 32.73 | 285 | 33.18 | ||||
| 2025-08-08 | 13F | Avantax Advisory Services, Inc. | 98,394 | 38.10 | 2,588 | 38.19 | ||||
| 2025-07-09 | 13F | Southern Style Financial, Inc. | 0 | -100.00 | 0 | |||||
| 2025-08-05 | 13F | GPS Wealth Strategies Group, LLC | 34,112 | 18.05 | 897 | 18.18 | ||||
| 2025-08-01 | 13F | Envestnet Asset Management Inc | 3,576,899 | 28.00 | 94,072 | 28.10 | ||||
| 2025-08-13 | 13F | Northwestern Mutual Wealth Management Co | 3,504,539 | 32.04 | 92,169 | 32.14 | ||||
| 2025-08-12 | 13F | Cornerstone Wealth Management, LLC | 23,496 | -0.99 | 618 | -0.96 | ||||
| 2025-08-08 | 13F | Capital Investment Advisory Services, LLC | 1,085 | 0.00 | 29 | 0.00 | ||||
| 2025-07-01 | 13F | Harbor Investment Advisory, Llc | 16,213 | 13.46 | 426 | 13.60 | ||||
| 2025-08-14 | 13F | Snowden Capital Advisors LLC | 11,695 | 0.78 | 308 | 0.99 |