Statistik Asas
| Pemilik Institusi | 186 total, 186 long only, 0 short only, 0 long/short - change of 3.31% MRQ |
| Purata Peruntukan Portfolio | 0.2536 % - change of -5.65% MRQ |
| Saham Institusi (Panjang) | 8,652,062 (ex 13D/G) - change of 1.10MM shares 14.64% MRQ |
| Nilai Institusi (Panjang) | $ 626,617 USD ($1000) |
Pemilikan Institusi dan Pemegang Saham
iShares Trust - iShares Morningstar Mid-Cap ETF (US:IMCB) telah 186 pemilik institusi dan pemegang saham yang telah memfailkan borang 13D/G atau 13F dengan Suruhanjaya Bursa Sekuriti (SEC). Institusi ini memegang sejumlah 8,652,062 saham. Pemegang saham terbesar termasuk UBS Group AG, Morgan Stanley, RMG Wealth Management LLC, LPL Financial LLC, Commonwealth Equity Services, Llc, Means Investment Co., Inc., Raymond James Financial Inc, Cetera Investment Advisers, Steele Capital Management, Inc., and Matrix Trust Co .
iShares Trust - iShares Morningstar Mid-Cap ETF (ARCA:IMCB) struktur pemilikan institusi menunjukkan kedudukan semasa dalam syarikat mengikut institusi dan dana serta perubahan terkini dalam saiz kedudukan. Pemegang saham utama boleh termasuk pelabur individu, dana amanah, dana lindung nilai atau institusi. Jadual 13D menunjukkan bahawa pelabur memegang (atau menahan) lebih daripada 5% syarikat dan berhasrat (atau berniat) untuk secara aktif meneruskan perubahan dalam strategi perniagaan. Jadual 13G menunjukkan pelaburan pasif melebihi 5%.
The share price as of September 5, 2025 is 82.44 / share. Previously, on September 9, 2024, the share price was 72.77 / share. This represents an increase of 13.29% over that period.

Skor Sentimen Dana
Skor Sentimen Dana (Skor Pengumpulan Pemilikan fka) mencari saham yang paling banyak dibeli oleh dana. Ia adalah hasil daripada model kuantitatif pelbagai faktor yang canggih yang mengenal pasti syarikat dengan tahap pengumpulan institusi tertinggi. Model pemarkahan ini menggunakan gabungan jumlah kenaikan dalam pemilik yang didedahkan, perubahan dalam peruntukan portfolio dalam pemilik tersebut dan metrik lain. Nombornya berjulat dari 0 hingga 100, dengan nombor yang lebih tinggi menunjukkan tahap pengumpulan yang lebih tinggi kepada rakannya, dan 50 adalah nombor purata.
Kekerapan Kemas Kini: Harian
Lihat Peneroka Pemilikan yang menyediakan senarai syarikat yang mempunyai kedudukan tertinggi.
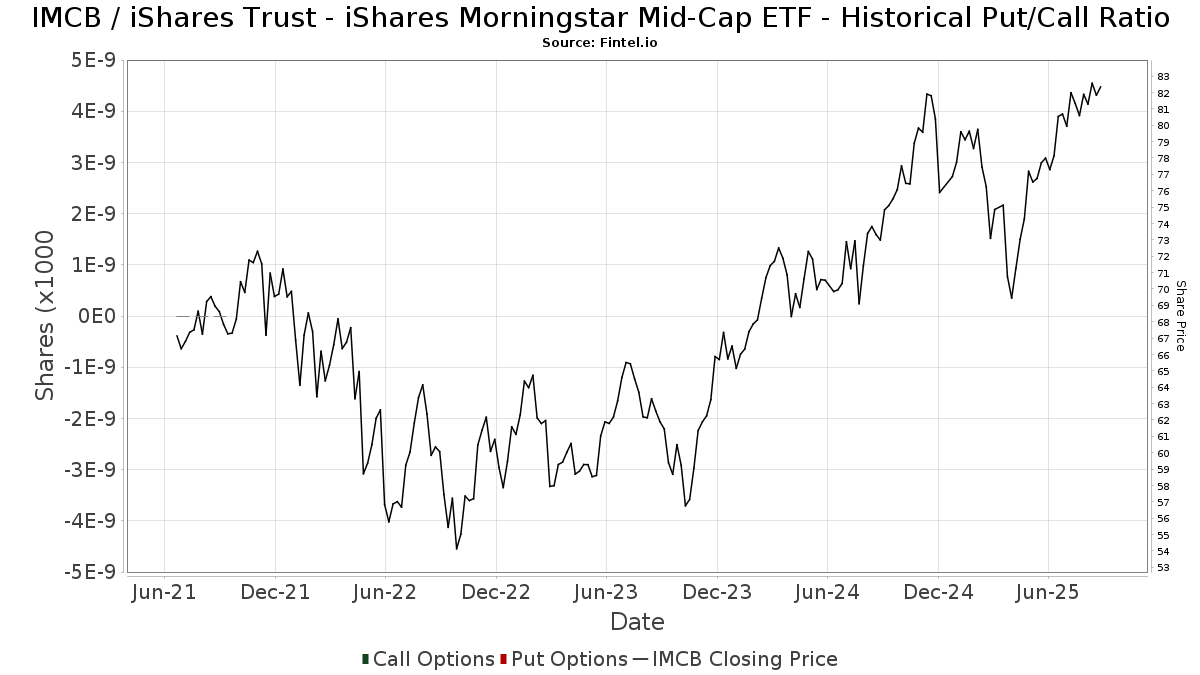
Nisbah Put/Call Institusi
Selain melaporkan isu ekuiti dan hutang standard, institusi yang mempunyai lebih daripada 100MM aset di bawah pengurusan juga mesti mendedahkan pegangan opsyen jual dan beli mereka. Memandangkan opsyen jual secara amnya menunjukkan sentimen negatif, dan opsyen beli menunjukkan sentimen positif, kita boleh mendapatkan gambaran keseluruhan sentimen institusi dengan merencanakan nisbah jual kepada beli. Carta di sebelah kanan memplotkan nisbah jual/beli sejarah untuk instrumen ini.
Menggunakan Nisbah Put/Callsebagai penunjuk sentimen pelabur mengatasi salah satu kekurangan utama menggunakan jumlah pemilikan institusi, iaitu sejumlah besar aset di bawah pengurusan dilaburkan secara pasif untuk menjejaki indeks. Dana yang diurus secara pasif biasanya tidak membeli opsyen, jadi penunjuk nisbah put/call mengekori rapat sentimen dana yang diurus secara aktif.
Pemfailan 13F dan NPORT
Butiran mengenai pemfailan 13F adalah percuma. Perincian mengenai pemfailan NP memerlukan keahlian premium. Baris hijau menunjukkan kedudukan baharu. Baris merah menunjukkan kedudukan tertutup. Klik pautan ikon untuk melihat sejarah transaksi penuh.
Naik Taraf
untuk membuka data premium dan mengeksport ke Excel ![]() .
.
| Tarikh Fail | Sumber | Pelabur | Jenis | Purata Harga (Ang) |
Saham | ΔSaham (%) |
Nilai Dilaporkan ($1000) |
Δ Nilai (%) |
Peruntukan Port (%) |
|
|---|---|---|---|---|---|---|---|---|---|---|
| 2025-08-14 | 13F | Diversify Advisory Services, LLC | 8,729 | -3.06 | 706 | 7.29 | ||||
| 2025-08-06 | 13F | Hoxton Planning & Management, LLC | 5,841 | 465 | ||||||
| 2025-08-11 | 13F | Synergy Investment Management, LLC | 0 | -100.00 | 0 | |||||
| 2025-07-16 | 13F | Signaturefd, Llc | 1,596 | 1.79 | 127 | 9.48 | ||||
| 2025-07-15 | 13F | Pitti Group Wealth Management, LLC | 16,507 | -2.66 | 1,315 | 4.62 | ||||
| 2025-05-12 | 13F | C2P Capital Advisory Group, LLC d.b.a. Prosperity Capital Advisors | 0 | -100.00 | 0 | -100.00 | ||||
| 2025-07-31 | 13F | Cambridge Investment Research Advisors, Inc. | 83,538 | 4.81 | 7 | 20.00 | ||||
| 2025-08-14 | 13F | UBS Group AG | 1,309,271 | 3.80 | 104,297 | 11.61 | ||||
| 2025-08-14 | 13F | Wealth Preservation Advisors, LLC | 705 | 0.43 | 56 | 7.69 | ||||
| 2025-08-08 | 13F | Good Life Advisors, LLC | 5,076 | 0.00 | 404 | 7.45 | ||||
| 2025-08-13 | 13F | Financial Freedom, LLC | 936 | 0.00 | 75 | 7.25 | ||||
| 2025-08-05 | 13F | Sigma Planning Corp | 3,911 | 0.10 | 312 | 7.61 | ||||
| 2025-08-05 | 13F | GPS Wealth Strategies Group, LLC | 6 | 0.00 | 0 | |||||
| 2025-08-08 | 13F | Financial Gravity Companies, Inc. | 328 | 0.00 | 26 | 8.33 | ||||
| 2025-08-14 | 13F | Stifel Financial Corp | 74,517 | -1.10 | 5,936 | 6.36 | ||||
| 2025-08-11 | 13F | United Advisor Group, LLC | 22,837 | 16.99 | 1,819 | 25.80 | ||||
| 2025-08-05 | 13F | Ellevest, Inc. | 2,639 | 210 | ||||||
| 2025-07-21 | 13F | HighMark Wealth Management LLC | 1,297 | 0.00 | 103 | 7.29 | ||||
| 2025-07-21 | 13F | Barrett & Company, Inc. | 3,216 | 0.34 | 256 | 8.02 | ||||
| 2025-07-30 | 13F | Fingerlakes Wealth Management, Inc. | 2,618 | 209 | ||||||
| 2025-08-05 | 13F | Atlas Private Wealth Advisors | 3,882 | -34.82 | 309 | -29.93 | ||||
| 2025-08-11 | 13F | Rothschild Investment Llc | 1,451 | 0.00 | 116 | 7.48 | ||||
| 2025-08-19 | 13F | Advisory Services Network, LLC | 12,085 | -6.91 | 978 | 1.77 | ||||
| 2025-08-13 | 13F | Haverford Trust Co | 6,517 | 0.00 | 519 | 7.68 | ||||
| 2025-07-21 | 13F | Pacific Financial Group Inc | 64,764 | 1.21 | 5,159 | 8.84 | ||||
| 2025-08-06 | 13F | AE Wealth Management LLC | 1,348 | 97.65 | 107 | 114.00 | ||||
| 2025-07-28 | 13F | Private Wealth Asset Management, LLC | 1,245 | -23.85 | 99 | -18.18 | ||||
| 2025-08-14 | 13F | Citadel Advisors Llc | 12,425 | 990 | ||||||
| 2025-04-29 | 13F | Resources Investment Advisors, LLC. | 0 | -100.00 | 0 | -100.00 | ||||
| 2025-08-15 | 13F | Truefg, Llc | 9,332 | -0.70 | 743 | 6.75 | ||||
| 2025-07-23 | 13F | Detalus Advisors, LLC | 3,184 | 6.88 | 254 | 15.00 | ||||
| 2025-08-07 | 13F | Addison Advisors LLC | 2,650 | -33.50 | 211 | -28.47 | ||||
| 2025-07-25 | 13F | Cwm, Llc | 13,933 | 3.84 | 1 | |||||
| 2025-04-10 | 13F | EWG Elevate Inc. | 0 | -100.00 | 0 | |||||
| 2025-07-24 | 13F | Morton Brown Family Wealth, LLC | 482 | 0.21 | 38 | 8.57 | ||||
| 2025-07-23 | 13F | Opulen Financial Group LLC | 8,149 | -3.34 | 649 | 4.01 | ||||
| 2025-08-13 | 13F | Capital Analysts, Inc. | 209 | 0.00 | 0 | |||||
| 2025-08-14 | 13F | Goldman Sachs Group Inc | 43,380 | 0.00 | 3,456 | 7.53 | ||||
| 2025-08-12 | 13F | PSI Advisors, LLC | 0 | -100.00 | 0 | |||||
| 2025-08-08 | 13F | Pnc Financial Services Group, Inc. | 692 | 0.29 | 55 | 7.84 | ||||
| 2025-08-12 | 13F | Ameritas Investment Partners, Inc. | 9,380 | 39.81 | 747 | 50.30 | ||||
| 2025-08-07 | 13F | Vise Technologies, Inc. | 4,978 | 397 | ||||||
| 2025-04-24 | 13F | Loring Wolcott & Coolidge Fiduciary Advisors Llp/ma | 0 | -100.00 | 0 | |||||
| 2025-08-12 | 13F | Franklin Resources Inc | 2,000 | 0.00 | 159 | 7.43 | ||||
| 2025-07-29 | 13F | Financial Futures Ltd Liability Co. | 5,586 | 0.00 | 445 | 7.51 | ||||
| 2025-08-13 | 13F | Flow Traders U.s. Llc | 0 | -100.00 | 0 | |||||
| 2025-08-14 | 13F | Glen Eagle Advisors, LLC | 184 | 0.00 | 15 | 7.69 | ||||
| 2025-08-08 | 13F | Evolution Wealth Advisors, LLC | 4,000 | 0.00 | 319 | 7.43 | ||||
| 2025-08-14 | 13F | Mercer Global Advisors Inc /adv | 81,572 | 6,498 | ||||||
| 2025-08-05 | 13F | Huntington National Bank | 80 | 6.76 | ||||||
| 2025-08-07 | 13F | Summit Asset Management, LLC | 9,855 | 0.00 | 785 | 7.53 | ||||
| 2025-08-06 | 13F | Commonwealth Equity Services, Llc | 382,362 | -4.16 | 30 | 3.45 | ||||
| 2025-08-12 | 13F | Proequities, Inc. | 0 | 0 | ||||||
| 2025-08-26 | 13F/A | Thrivent Financial For Lutherans | 0 | -100.00 | 0 | |||||
| 2025-07-25 | 13F | Means Investment Co., Inc. | 319,053 | 5.32 | 25,416 | 13.25 | ||||
| 2025-08-07 | 13F | Allworth Financial LP | 439 | 0.00 | 35 | 9.68 | ||||
| 2025-08-14 | 13F | CoreCap Advisors, LLC | 1,360 | 0.00 | 108 | 8.00 | ||||
| 2025-08-04 | 13F | Wealth Management Associates, Inc. | 3,822 | 0.00 | 304 | 7.42 | ||||
| 2025-08-13 | 13F | Russell Investments Group, Ltd. | 382 | 5.82 | 30 | 15.38 | ||||
| 2025-07-10 | 13F | Marshall Financial Group LLC | 5,600 | -9.98 | 450 | -2.17 | ||||
| 2025-08-12 | 13F | Archer Investment Corp | 1,099 | 242.37 | 88 | 278.26 | ||||
| 2025-07-17 | 13F | Janney Montgomery Scott LLC | 11,659 | 4.57 | 1 | |||||
| 2025-07-14 | 13F | AdvisorNet Financial, Inc | 977 | 0.21 | 78 | 6.94 | ||||
| 2025-08-05 | 13F | Westside Investment Management, Inc. | 177 | 0.57 | 14 | 7.69 | ||||
| 2025-07-10 | 13F | Wealth Enhancement Advisory Services, Llc | 30,634 | -1.47 | 2,482 | 7.73 | ||||
| 2025-07-31 | 13F | Glass Jacobson Investment Advisors llc | 957 | -2.15 | 76 | 2.70 | ||||
| 2025-08-08 | 13F | Creative Planning | 4,592 | 13.95 | 366 | 22.48 | ||||
| 2025-07-14 | 13F | Matrix Trust Co | 177,216 | 1.39 | 14 | 16.67 | ||||
| 2025-07-28 | 13F | Copia Wealth Management | 10 | 0.00 | 1 | |||||
| 2025-07-25 | 13F | Yarger Wealth Strategies, Llc | 68,964 | 0.25 | 5,494 | 7.79 | ||||
| 2025-07-29 | 13F | Woodard & Co Asset Management Group Inc /adv | 48,553 | -2.79 | 3,868 | 4.51 | ||||
| 2025-08-12 | 13F | MAI Capital Management | 340 | 0.00 | 27 | 8.00 | ||||
| 2025-08-12 | 13F | Bedel Financial Consulting, Inc. | 47,512 | 2.22 | 3,785 | 10.39 | ||||
| 2025-08-11 | 13F | Aptus Capital Advisors, LLC | 108,491 | 2.80 | 8,642 | 10.54 | ||||
| 2025-08-14 | 13F | Hilltop Holdings Inc. | 7,671 | 611 | ||||||
| 2025-08-18 | 13F | Tyler-Stone Wealth Management | 3,526 | 0.00 | 281 | 7.28 | ||||
| 2025-07-24 | 13F | Blair William & Co/il | 19 | 0.00 | 2 | 0.00 | ||||
| 2025-08-13 | 13F | Northwestern Mutual Wealth Management Co | 34,308 | 5.89 | 2,733 | 13.83 | ||||
| 2025-08-19 | 13F | Asset Dedication, LLC | 42 | 0.00 | 3 | 0.00 | ||||
| 2025-08-14 | 13F | Capital Planning Advisors, LLC | 7,963 | 6.27 | 634 | 14.23 | ||||
| 2025-07-07 | 13F | Global Wealth Strategies & Associates | 1,100 | 0.00 | 88 | 7.41 | ||||
| 2025-07-18 | 13F | PFG Investments, LLC | 6,354 | 29.07 | 506 | 39.01 | ||||
| 2025-08-12 | 13F | O'shaughnessy Asset Management, Llc | 2 | 0 | ||||||
| 2025-07-28 | 13F | Harbour Investments, Inc. | 1,930 | -1.43 | 154 | 5.52 | ||||
| 2025-07-21 | 13F | Ameritas Advisory Services, LLC | 370 | 29 | ||||||
| 2025-07-30 | 13F | Financial Perspectives, Inc | 6,138 | 4.12 | 489 | 11.93 | ||||
| 2025-06-11 | 13F | Fortitude Financial, LLC | 70,502 | -85.42 | 5,223 | -85.82 | ||||
| 2025-07-22 | 13F | Olistico Wealth, LLC | 300 | 0.00 | 24 | 4.55 | ||||
| 2025-07-25 | 13F | Apollon Wealth Management, LLC | 10,838 | 0.00 | 863 | 7.61 | ||||
| 2025-08-14 | 13F | Mml Investors Services, Llc | 121,599 | 1.08 | 10 | 12.50 | ||||
| 2025-08-14 | 13F | Ameriprise Financial Inc | 113,909 | -2.91 | 9,074 | 4.46 | ||||
| 2025-08-26 | NP | EQ ADVISORS TRUST - EQ/Mid Cap Value Managed Volatility Portfolio Class IB | 7,464 | 0.00 | 595 | 7.61 | ||||
| 2025-07-25 | 13F | Atria Wealth Solutions, Inc. | 8,727 | -84.34 | 695 | -83.16 | ||||
| 2025-08-14 | 13F | Mariner, LLC | 7,121 | -3.27 | 567 | 4.04 | ||||
| 2025-05-12 | 13F | Independent Advisor Alliance | 0 | -100.00 | 0 | |||||
| 2025-08-04 | 13F | Creative Financial Designs Inc /adv | 153,163 | 2,080.88 | 12,201 | 2,246.15 | ||||
| 2025-08-13 | 13F | M&t Bank Corp | 6,162 | 69.47 | 491 | 82.16 | ||||
| 2025-08-05 | 13F | Plante Moran Financial Advisors, LLC | 1,675 | 0.00 | 133 | 7.26 | ||||
| 2025-08-12 | 13F | Global Retirement Partners, LLC | 11,938 | -16.70 | 951 | -12.92 | ||||
| 2025-08-12 | 13F | J.w. Cole Advisors, Inc. | 13,139 | 1.99 | 1,047 | 9.64 | ||||
| 2025-07-25 | 13F | Lion Street Advisors, LLC | 2,880 | -18.53 | 229 | -12.26 | ||||
| 2025-07-14 | 13F | S.A. Mason LLC | 11,930 | 0.50 | 950 | 8.08 | ||||
| 2025-08-13 | 13F | Cerity Partners LLC | 20,889 | 0.18 | 1,664 | 7.77 | ||||
| 2025-05-09 | 13F | Bouchey Financial Group Ltd | 0 | -100.00 | 0 | |||||
| 2025-08-04 | 13F | Rede Wealth, LLC | 10,445 | 2.99 | 832 | 10.79 | ||||
| 2025-09-04 | 13F/A | Advisor Group Holdings, Inc. | 128,821 | 1.29 | 10,266 | 8.91 | ||||
| 2025-08-14 | 13F | Arete Wealth Advisors, LLC | 2,707 | 0.11 | 0 | |||||
| 2025-07-18 | 13F | Liberty Capital Management, Inc. | 10,200 | 0.00 | 813 | 7.55 | ||||
| 2025-07-24 | 13F | Robertson Stephens Wealth Management, LLC | 3,560 | 0.00 | 284 | 7.60 | ||||
| 2025-07-24 | 13F | IFP Advisors, Inc | 240 | 0.00 | 19 | 11.76 | ||||
| 2025-08-05 | 13F | Tsfg, Llc | 420 | 0.00 | 0 | |||||
| 2025-08-14 | 13F | Glenview Trust Co | 3,887 | 0.00 | 310 | 7.67 | ||||
| 2025-07-14 | 13F | Signature Securities Group Corporation | 23,750 | -1.80 | 1,892 | 5.58 | ||||
| 2025-08-05 | 13F | EPG Wealth Management LLC | 1,423 | -20.86 | 113 | -15.04 | ||||
| 2025-08-14 | 13F | Wells Fargo & Company/mn | 81,593 | -21.23 | 6,500 | -15.30 | ||||
| 2025-08-05 | 13F | Integrity Financial Corp /WA | 220 | 0.00 | 18 | 6.25 | ||||
| 2025-08-05 | 13F | Sunburst Financial Group, LLC | 107,230 | 2.84 | 8,542 | 10.58 | ||||
| 2025-08-01 | 13F | Envestnet Asset Management Inc | 67,204 | 31.88 | 5,353 | 41.80 | ||||
| 2025-07-22 | 13F | Merit Financial Group, LLC | 27,254 | 10.63 | 2,171 | 18.96 | ||||
| 2025-05-08 | 13F | NorthRock Partners, LLC | 0 | -100.00 | 0 | |||||
| 2025-07-18 | 13F | Philip James Wealth Mangement, LLC | 5,694 | 0.33 | 454 | 7.86 | ||||
| 2025-08-12 | 13F | NFP Retirement, Inc. | 4,803 | 0.00 | 383 | 7.61 | ||||
| 2025-07-31 | 13F/A | Avion Wealth | 643 | 0.00 | 0 | |||||
| 2025-08-13 | 13F | Jones Financial Companies Lllp | 4,402 | 29.78 | 348 | 39.76 | ||||
| 2025-07-08 | 13F | Apella Capital, LLC | 11,532 | 0.00 | 928 | 13.60 | ||||
| 2025-08-12 | 13F | Clearwater Capital Advisors, LLC | 3,446 | 0.00 | 275 | 7.45 | ||||
| 2025-08-19 | 13F | Cape Investment Advisory, Inc. | 1,786 | 0.00 | 142 | 7.58 | ||||
| 2025-08-11 | 13F | Western Wealth Management, LLC | 0 | -100.00 | 0 | |||||
| 2025-08-12 | 13F | LPL Financial LLC | 498,843 | 9.97 | 39,738 | 18.25 | ||||
| 2025-07-17 | 13F | Global Trust Asset Management, LLC | 12 | 0.00 | 1 | |||||
| 2025-08-11 | 13F | Citigroup Inc | 4,103 | -2.10 | 327 | 5.16 | ||||
| 2025-04-30 | 13F | Sofos Investments, Inc. | 328 | 0.00 | 24 | 9.09 | ||||
| 2025-08-08 | 13F | Cetera Investment Advisers | 181,928 | 0.89 | 14,492 | 8.49 | ||||
| 2025-08-12 | 13F | CIBC Private Wealth Group, LLC | 7,264 | -23.58 | 579 | -6.92 | ||||
| 2025-08-11 | 13F | Principal Securities, Inc. | 316 | -22.55 | 25 | -19.35 | ||||
| 2025-08-14 | 13F | Matrix Private Capital Group Llc | 2,617 | -3.25 | 208 | 4.00 | ||||
| 2025-07-31 | 13F | Carnegie Capital Asset Management, LLC | 6,935 | 552 | ||||||
| 2025-07-18 | 13F | Benchmark Wealth Management, LLC | 55,403 | 0.04 | 4,413 | 7.58 | ||||
| 2025-08-04 | 13F | Jim Saulnier & Associates, Llc | 17,856 | -7.91 | 1,422 | -0.97 | ||||
| 2025-08-15 | 13F | Morgan Stanley | 1,254,715 | 5.02 | 99,951 | 12.93 | ||||
| 2025-08-12 | 13F | Howe & Rusling Inc | 1,736 | 138 | ||||||
| 2025-07-28 | 13F | RFG Advisory, LLC | 3,051 | -3.91 | 243 | 3.40 | ||||
| 2025-07-17 | 13F | Sound Income Strategies, LLC | 280 | 0.00 | 22 | 10.00 | ||||
| 2025-07-21 | 13F | Patriot Financial Group Insurance Agency, LLC | 38,738 | 8.69 | 3,086 | 16.86 | ||||
| 2025-08-01 | 13F | Boyd Watterson Asset Management Llc/oh | 184 | 0.00 | 15 | 7.69 | ||||
| 2025-08-04 | 13F | Adell Harriman & Carpenter Inc | 4,300 | 0.00 | 343 | 7.55 | ||||
| 2025-07-11 | 13F | Farther Finance Advisors, LLC | 42,691 | 1,347.15 | 3,401 | 1,452.51 | ||||
| 2025-08-11 | 13F | HighTower Advisors, LLC | 43,592 | 0.00 | 3,473 | 7.53 | ||||
| 2025-04-10 | 13F | Portside Wealth Group, LLC | 0 | -100.00 | 0 | -100.00 | ||||
| 2025-07-18 | 13F | Centricity Wealth Management, LLC | 308 | 0.00 | 25 | 9.09 | ||||
| 2025-08-14 | 13F | Integrated Wealth Concepts LLC | 6,860 | 0.18 | 546 | 7.69 | ||||
| 2025-08-14 | 13F | Fmr Llc | 14,672 | -12.54 | 1,169 | -5.96 | ||||
| 2025-08-15 | 13F | CI Private Wealth, LLC | 9,450 | 20.41 | 753 | 29.43 | ||||
| 2025-07-09 | 13F | Procyon Private Wealth Partners, LLC | 4,594 | 0.15 | 366 | 7.67 | ||||
| 2025-07-17 | 13F | XML Financial, LLC | 3,740 | -1.24 | 298 | 6.07 | ||||
| 2025-08-04 | 13F | Pensionmark Financial Group, Llc | 19,056 | -7.99 | 1,518 | -1.04 | ||||
| 2025-08-08 | 13F | Avantax Advisory Services, Inc. | 83,245 | 1.08 | 6,631 | 8.69 | ||||
| 2025-08-15 | 13F | Tower Research Capital LLC (TRC) | 0 | -100.00 | 0 | |||||
| 2025-08-07 | 13F | 49 Wealth Management, Llc | 4,790 | 0.34 | 382 | 7.93 | ||||
| 2025-08-08 | 13F | Gts Securities Llc | 0 | -100.00 | 0 | |||||
| 2025-08-14 | 13F | Raymond James Financial Inc | 317,974 | -1.15 | 25,330 | 6.29 | ||||
| 2025-08-14 | 13F | IHT Wealth Management, LLC | 4,711 | -0.32 | 375 | 7.14 | ||||
| 2025-08-06 | 13F | Decker Retirement Planning Inc. | 17 | 0.00 | 1 | 0.00 | ||||
| 2025-07-29 | 13F | Goldstein Advisors, LLC | 39,303 | 4.60 | 3,131 | 12.47 | ||||
| 2025-07-09 | 13F | Brand Asset Management Group, Inc. | 36,400 | 1.20 | 2,900 | 8.82 | ||||
| 2025-08-13 | 13F | Summit Wealth Group Llc / Co | 3,825 | 305 | ||||||
| 2025-05-14 | 13F | Jane Street Group, Llc | 0 | -100.00 | 0 | |||||
| 2025-08-14 | 13F | Bank Of America Corp /de/ | 92,496 | 3.33 | 7,368 | 11.11 | ||||
| 2025-08-12 | 13F | Jpmorgan Chase & Co | 25,892 | 3.99 | 2,063 | 11.82 | ||||
| 2025-08-14 | 13F | Comerica Bank | 6,077 | 6.15 | 484 | 14.15 | ||||
| 2025-08-08 | 13F | Foundations Investment Advisors, LLC | 3,161 | 0.00 | 252 | 7.26 | ||||
| 2025-08-06 | 13F | Savant Capital, LLC | 5,284 | 0.00 | 421 | 7.42 | ||||
| 2025-08-15 | 13F | Equitable Holdings, Inc. | 34,725 | 7.43 | 2,766 | 15.54 | ||||
| 2025-05-14 | 13F | Van Hulzen Asset Management, LLC | 0 | -100.00 | 0 | |||||
| 2025-07-18 | 13F | Truist Financial Corp | 23,209 | -1.44 | 1,849 | 5.96 | ||||
| 2025-08-14 | 13F | Royal Bank Of Canada | 53,929 | 16.56 | 4,296 | 25.32 | ||||
| 2025-07-23 | 13F | Kingswood Wealth Advisors, Llc | 0 | -100.00 | 0 | |||||
| 2025-04-21 | 13F | Nelson, Van Denburg & Campbell Wealth Management Group, LLC | 0 | -100.00 | 0 | |||||
| 2025-07-18 | 13F | Parsons Capital Management Inc/ri | 17,498 | -1.80 | 1,394 | 5.53 | ||||
| 2025-07-28 | 13F | Mutual Advisors, LLC | 4,520 | 0.00 | 372 | 13.46 | ||||
| 2025-07-30 | 13F | Whittier Trust Co Of Nevada Inc | 68 | 0.00 | 5 | 0.00 | ||||
| 2025-07-09 | 13F | Pps&v Asset Management Consultants, Inc. | 3,851 | 0.00 | 307 | 7.37 | ||||
| 2025-08-14 | 13F | Silvercrest Asset Management Group Llc | 3,089 | 0.00 | 246 | 7.89 | ||||
| 2025-07-10 | 13F | Three Seasons Wealth, LLC | 4,686 | -0.66 | 373 | 6.88 | ||||
| 2025-08-14 | 13F | Susquehanna International Group, Llp | 0 | -100.00 | 0 | |||||
| 2025-08-14 | 13F | GWM Advisors LLC | 2,001 | 0.25 | 159 | 8.16 | ||||
| 2025-08-08 | 13F | WASHINGTON TRUST Co | 0 | -100.00 | 0 | |||||
| 2025-07-22 | 13F | Steele Capital Management, Inc. | 177,217 | 1.39 | 14,117 | 9.03 | ||||
| 2025-05-28 | 13F | Silicon Valley Capital Partners | 954 | 70 | ||||||
| 2025-08-15 | 13F | Kestra Advisory Services, LLC | 47,602 | 11.28 | 3,792 | 19.63 | ||||
| 2025-08-08 | 13F | Capital Investment Advisory Services, LLC | 96 | 8 | ||||||
| 2025-08-13 | 13F | Proactive Wealth Strategies LLC | 4,256 | 0.33 | 0 | |||||
| 2025-07-31 | 13F | Briaud Financial Planning, Inc | 60 | 0.00 | 0 | |||||
| 2025-05-08 | 13F | Empirical Financial Services, LLC d.b.a. Empirical Wealth Management | 0 | -100.00 | 0 | |||||
| 2025-07-21 | 13F | Triad Wealth Partners, LLC | 7,632 | 608 | ||||||
| 2025-07-22 | 13F | Miracle Mile Advisors, LLC | 8,522 | -18.80 | 679 | -12.74 | ||||
| 2025-04-30 | 13F | Stratos Wealth Partners, LTD. | 0 | -100.00 | 0 | |||||
| 2025-08-04 | 13F | Assetmark, Inc | 2,383 | -76.52 | 190 | -74.83 | ||||
| 2025-07-23 | 13F | RMG Wealth Management LLC | 1,083,709 | 87,672 | ||||||
| 2025-07-29 | 13F | Salomon & Ludwin, LLC | 241 | 0.00 | 19 | 11.76 | ||||
| 2025-08-12 | 13F | Steward Partners Investment Advisory, Llc | 2,163 | 0.84 | 172 | 8.86 | ||||
| 2025-08-12 | 13F | Gladstone Institutional Advisory LLC | 67,124 | -0.44 | 5,347 | 7.07 | ||||
| 2025-07-14 | 13F | Farmers & Merchants Investments Inc | 3,012 | 0.00 | 240 | 7.17 | ||||
| 2025-07-31 | 13F | Schneider Downs Wealth Management Advisors, LP | 4,053 | 323 | ||||||
| 2025-07-11 | 13F | Kaydan Wealth Management, Inc. | 5,392 | 0.00 | 430 | 7.52 | ||||
| 2025-08-18 | 13F | Geneos Wealth Management Inc. | 4,480 | 100.00 | 357 | 115.76 | ||||
| 2025-05-14 | 13F | Mission Creek Capital Partners, Inc. | 0 | -100.00 | 0 | |||||
| 2025-08-05 | 13F | Bank Of Montreal /can/ | 0 | -100.00 | 0 | |||||
| 2025-07-24 | 13F | Edge Financial Advisors LLC | 3,114 | 250 | ||||||
| 2025-07-10 | 13F | Security National Bank | 100 | 0.00 | 8 | 0.00 | ||||
| 2025-08-01 | 13F | SYM FINANCIAL Corp | 228 | 18 | ||||||
| 2025-07-14 | 13F | Sowell Financial Services LLC | 38,539 | 3,070 | ||||||
| 2025-08-11 | 13F | Private Advisor Group, LLC | 2,893 | 4.82 | 230 | 12.75 |